
Louisiana Slave Database 1719-1820
SUMMARY
Number of slaves with origin specified 29,769
American born (“Creole”) 13,618 (45% of total)
African born 16,099 (54% of total)
African specified ethnically 8,994 (30% of total)
TOP 3 BREAKDOWN OF AFRICAN BORN SLAVES
Congo (Central Africa) 2,988 – 33% of African specified
Mandinga (Upper Guinea) 922 – 10% of African specified
Mina (Ghana, Togo, Benin) 628 – 7% of African specified
Source: Slavery and African Ethnicities in the Americas: Restoring the Links (Hall, 2005).

____________________
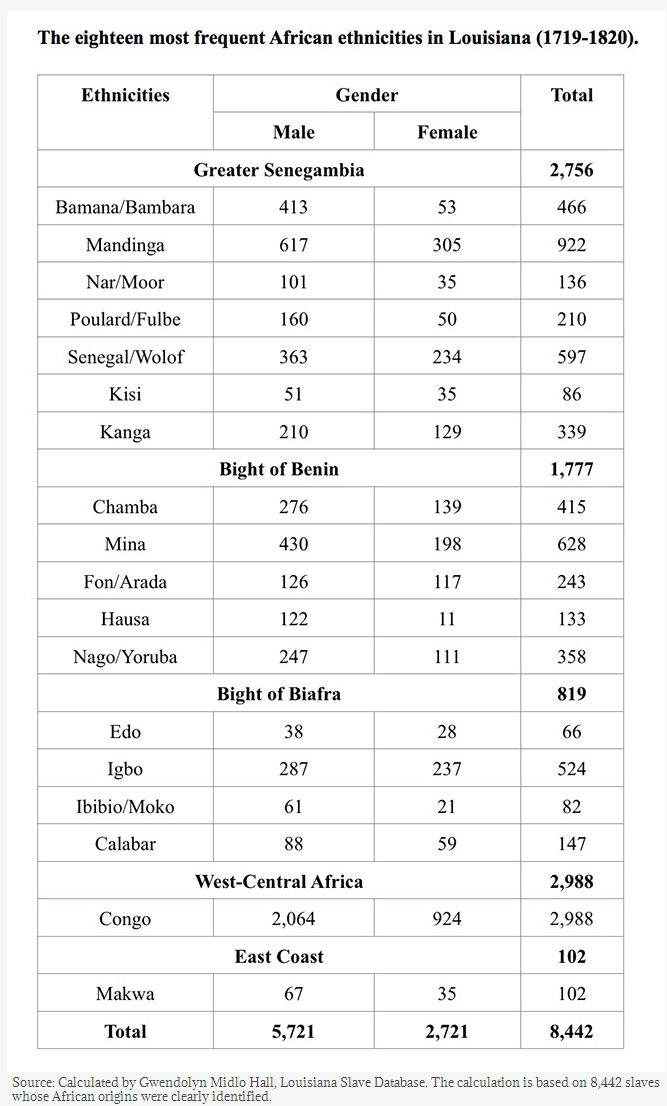
“Gwendolyn Midlo Hall’s remarkable relational database of Louisiana slaves and freedmen (1719-1820), which contains records of over 100,000 enslaved people, includes nearly 9,000 individual Africans by specific ethnicity. The database was first published in 2000 as a CD-ROM, and it is now available free on the Internet. The database is derived largely from notarial and ‘‘succession’’ (probate) records, mostly in French, in which slaves often self-identified their ‘‘nations’’ or ‘‘countries’’. There are 217 different ethnicities recorded, of which 96 have been identified, and a further 121 (comprising 152 individuals) which have not been identified. Of those identified, just 18 ethnicities account for over 96% of the Africans in the Louisiana records. In addition, within that set of 18 principal ‘‘nations,’’ the seven most common (in order, Kongo, Mandingo, Mina, Senegal/Wolof, Igbo, Bamana, Chamba), comprise over three-quarters of the sample. The single most numerous ‘‘nation’’ in the dataset was Africans from Kongo (nearly 3,000 individuals), the vast majority of whom arrived in the late eighteenth and early nineteenth centuries” (Chambers, 2008, pp.335-336).
____________________
For a direct link to this extremely fascinating and online searchable database created by Gwendolyn Midlo Hall see below:
Louisiana Slave Database 1719-1820
A full overview of the 18 most frequently named African origins can be seen in the remaining part of this blogpost in which i will attempt to provide more details and context about Louisiana’s African diversity.
***
Disclaimers
By no means is the data featured in this blogpost presented as 100% representative of the ancestral make up of the present day population of Louisiana! Only largescale DNA research might perhaps one day provide more solid clues in that direction (see upcoming blogpost on AncestryDNA results for Louisianians). As always when it comes to sample based overviews you will have to take into consideration how representative the data might possibly be and also from which context they are drawn (timeperiod, type of documentation, parishes being covered etc.etc.).
Fortunately most scholars will agree that the Louisiana Slave Database is one of the biggest and most extensive of its kind, especially for the USA! Despite a high share of locally born “creole” slaves with unknown ethnic origins and also slaves who were just labeled as being “African”. Overall its ethnic coverage of 30% compares very favourably with the slave ethnicity data from the West Indies and Cape Verde which i blogged about earlier (follow this link for an overview), only the Trinidad Slave Register of 1813 being more detailed and larger in samplesize.
Even when many of the 217 (!) ethnic names being used to identify the slaves are very specific, some of the more frequently appearing ethnic names can have wideranging regional interpretations aside from pinpointing only any particular and unique ethnicity. These interpretations of the socalled nations or country names have been hotly debated at times by historians, incl. Gwendolyn Midlo Hall herself. All the same the information being conveyed by these ethnonyms is very valuable in itself already. See also “Ethnic identities of African-born slaves: valid or imposed?“.
Everyone has a unique family tree and what’s described for Louisiana as a whole might not necessarily apply in individual cases. The complex colonial history of Louisiana, featuring periods of French, Spanish and American rule, has contributed to a possibly greater degree of African diversity than found anywhere else in the USA. Each timeperiod was characterized by its own distinct ethnic/regional pattern of slave imports. When tracing your personal African roots it’s therefore crucial to find out when your ancestors arrived in Louisiana and via which route: Trans Atlantic Slave Trade (directly from Africa), Inter Colonial Slave Trade (via the West Indies) or the Domestic Slave Trade (via mainly Virginia or South Carolina). In many cases it will be a combination of course and your family might be very deeply rooted within Louisiana (1700’s) along some lines while other family members arrived relatively later (1800’s).
Ethnic clustering
***
***

Trans-Atlantic Slave Trade Database (2010) (http://www.slavevoyages.org)
____________________
“There is a particularly high percentage of identified birthplaces, especially many African “nations” of slaves, recorded in documents dating between 1770 and 1820 in the lower Mississippi parishes: St. Charles, St. John the Baptist, Pointe Coupee, and, to a lesser extent, Orleans. […]
“The notion of “frequency” is determined by the number of times the name of a particular ethnic group or geographical origin is attached to the description of slaves documented in inventories, wills, trials, mortgages, etc. It is a good indicator of the volume of the slave trade from different regions of West Africa since ethnic designations listed in Louisiana documents overwhelmingly involved self-identification by Africans.” (http://www.whitneyplantation.com/the-louisiana-slave-database.html)
” Some of our best, most detailed information comes from Louisiana. The total slave population of early Louisiana was small compared to that of many. But the richness of the information, especially about African ethnicities, is certainly unique for documents about slaves who became part of the population of the United States and quite possibly for documents generated in any other place in the Americas.” (Hall, 2005, p.40)
“But Africans from the same regions and ethnicities arrived in various places in the Americas in waves and were often clustered over time and place. Dynamic perception and comparative analysis reveal clustered patterns while static perception gives the false impression of random, dispersed patterns.” (Hall, 2005, p.50)
“African ethnicities recorded in particular places in the Americas do not allow us to draw conclusions about the numbers or proportions of a particular ethnicity exported from a particular African coast, and African buyers and sellers; the timing of ther transatlantic trade involving increasing numbers of African coasts over the centuries; and the preferences of masters in American regions for particular African peoples. Africans from particular coasts and ethnicties often arrived in waves clustering them in specific places in the Americas” (Hall, 2005, pp.167-168)
” The culture of the slaves in Louisiana was one of the most transparently ‘‘African’’ (directly African-influenced) of the several regional slave cultures of North America. Markers of specific ethnic African influence in Afro-Louisiana culture, such as gris-gris and Bouki and couscous (Wolof/Mande), gombo and calinda and ‘‘Congo Square’’ (Kongo/Mbundu), and of course vodou and the loa (‘‘Gbe’’/Fon), and many personal names (and even family names, such as ‘‘Ebow’’ and ‘‘Senega’’) all endured well into the twentieth century. They were indispensable to creating the recognizably African-flavored ‘‘gumbo’’ of Louisiana’s distinctive folk culture, even if no one called their names.” (Chambers, 2008, p.335)
“Although the slave trade to Louisiana was marked by several peculiarities, its defining characteristic was that it created an unusually diverse black population in New Orleans, including representatives from a multitude of African nations and African-American culture groups. The local black population reached a high degree of creolization by the middle of the eighteenth century, but during the Spanish regime this increasing Creole stability of the black community was ended by the successful effort of the Spanish crown to augment the slave trade to Louisiana and other colonies., The Louisiana Purchase marked a new phase in the development of the black community in New Orleans that gave it a truly remarkable degree of ethnic diversity. Indeed, New Orleans came to have the most diverse black population in the United States.” (Ingersoll, 1996, p.133)
” New Orleans’s already diverse slave population was now forced to accommodate some of the tens of thousands of Englishspeaking slaves that planters from the United States began to either transport into or export to Orleans Territory. The Saint-Domingans and the Americans made New Orleans truly distinctive, more culturally diverse than any population in the United States.” (Ingersoll, 1996, p.160)
“Compared to the Carolina Low country (150,000 landed) and the Chesapeake (85,000 landed), the transatlantic slave trade to Spanish Louisiana was relatively small (perhaps 50,000). Indeed, before 1810, the slave population of Louisiana (35,000) remained relatively small compared to Virginia (392,500) and South Carolina (196,000).” (Chambers, 2008, p.342)
“Our newest and most systematic data about the trade in slaves shipped from Caribbean ports is from Spanish Louisiana. This colony relied very heavily on the transshipment trade rather than on the transatlantic slave trade. It is certain that almost all slaves shipped to Louisiana from the Caribbean were new Africans purchased from transatlantic slave trade voyages as they arrived in various Caribbean ports.” (Hall, 2005, p.70)
“Ironically, given the newly recovered visibility of Africans in pre-1820 Louisiana, especially in the Spanish period (1763-1803) when the region clearly was ‘‘re-Africanized’’ (and probably ‘‘Kongolized’’), the colonial slave trade to Louisiana is the least-documented of the North American trades.” (Chambers, 2008, p.336)
____________________
As can be read in the above quotations and especially by looking at the chart featuring the 18 most frequent ethno-labels, the African diversity in Louisiana looks quite astonishing! It’s possible that this impression is created partially because French and Spanish colonizers paid closer attention to the ethnic background of their African slaves. As blogged about earlier the ethnic references for Africans in South Carolina and Virginia are markedly fewer. See also: Ethnic Origins of South Carolina Runaway Slaves.
However it’s probably Louisiana’s complex colonial history itself, which explains it’s wider array of African ethnic origins. With enslaved labourers being supplied by both French, Spanish, English (contraband) and American (domestic/interstate) slave traders – usually via the West Indies and the Thirteen Colonies but ultimately hailing from Africa’s Atlantic coast and even Mozambique – it’s no wonder that a richly flavoured gumbo of African ethnicity developed within Louisiana.
Aside from direct slave imports from Africa or the West Indies Louisiana received many enslaved labourers via ultimately Virginia and South Carolina. It might therefore be assumed that Louisiana’s own African diversity both reflects and includes the diversity found in those two biggest entry points for Africans into the USA. But on top of that Louisiana also has its own distinct features because of its connections with the French speaking Caribbean and the slave trade carried on during the French period.
Therefore the overview above taken from the Trans Atlantic Slave Trade database doesn’t tell the whole story for Louisiana (shown as “Gulf Coast”). For Virginia and South Carolina the breakdown can be considered to be quite representative because they had much less indirect slave trade and their slave voyages were better documented. For Louisiana however it’s only in combination with the Louisiana Slave Database that we get a better understanding of the full range of its African origins.
One major discrepancy between both databases is the numerous mentioning of the Kanga and Kissi, ethnic groups from Sierra Leone and Liberia in the Louisiana Slave Database. While going just by documented Trans Atlantic slave voyages you would have expected to see none! Both Sierra Leone & Wind Ward Coast being shown with 0% in the overview. In fact the proportions of the other embarkation regions will also be up for review if ALL African and also Afrodescended arrivals by whichever route into Louisiana are taken into consideration. It’s likely that the averages shown in the column to the far right might more closely resemble Lousiana’s approximate African ancestral breakdown.
As mentioned by Hall (2005) many transshipped Africans were clustered in related ethnic groups and may have been culturally or even ancestrally predominant during specific timeperiods or within selected places/parishes. In this section i will discuss some of the 18 ethnicities being mentioned. Especially the ones which stand out because, as far as i know, they are rarely or not all mentioned anywhere else in the USA. For an excellent indepth study however it’s highly recommended to read Hall’s book itself: Slavery and African Ethnicities in the Americas: Restoring the Links (Hall, 2005).
Another very useful overview of the ethnic origins of 14,000 liberated Africans from Cuba can be found on this recently published website: Liberated Africans of the Havana Slave Trade Commission. It’s highly interesting in itself but also relevant for interpreting the Louisiana data as many of the same ethnolabels were being applied in both Louisiana and Cuba and both regions are known to have shared significant historical connections. Special attention should be paid to the various socalled sub-groups of each “nacion”, it seems to demonstrate the clustering of related ethnic groups under one umbrella ethnolabel/country name:
“To complicate matters, there were 241 different nación sub-groups, which are listed below and distributed accordingly: Mandinga (18 sub-groups), Gangá (12), Mina (2), Arará (3), Lucumí (29), Carabali (51) and Congo (129). These ethnonyms clearly specified more distinct African ethnolinguistic groups, places or regions in a variety of ways and spellings. However, these terms are also highly debatable in terms of their origins and meanings.” (Liberated Africans website)
Greater Senegambia
This is the term used by Hall (2005) to refer to the Upper Guinea region (for maps see this link). Unlike most other slave trade historians she combines the Senegambia area with Sierra Leone and even the Windward Coast and regards it as one single embarkation region. There are indeed valid reasons to do so, as many socalled Mandingo’s and also Fula were exported from slave ports located in both northern Senegambia and more to the south from Guinea Conakry/Sierra Leone. Personally i however prefer the term Upper Guinea as i find it less confusing. Despite many commonalities Senegambia proper being a subregion to be distinguished from Guiné Bissau + Casamance and also Guinea Conakry+ (northern) Sierra Leone for both cultural and geographical/ecological reasons.
In an upcoming blogpost i will discuss the Senegambian (sensu stricto) origins of Louisiana in greater detail. For now it can already be noted that the variety of distinct ethnic groups from Upper Guinea is bigger than any of the other regions, plus the total number is only second to Central Africa. This seems to correspond well enough with known slave trade patterns when also intercolonial voyages via the West Indies are taken into account.
Just highlighting now two groups being mentioned: the Kanga and the Nar/Moors. Both rarely or not at all being reported elsewhere in the USA as far as i know. Which doesn’t per se mean they weren’t present though. In the West Indian Slave Registers especially the Canga are frequently mentioned. Kanga, also spelled Canga or Ganga, is a reference to people hailing from the border area between Sierra Leone and Liberia. Various ethnic groups might be hiding under this term though. In Cuba they were given 12 separate nación sub-groups, incl. possibly the Vai, and the Gola people (see the Liberated Africans website). But also infact the Kissi from Sierra Leone/Liberia who were mentioned 86 times in the Louisiana database, were sometimes in Cuba indentified as “Ganga Kisi”! Demonstrating the overlap in terminology. For maps showing the ethnolinguistical diversity in Liberia follow this link.
The number of socalled Nar/Moors in Louisiana documentation might be quite exceptional for anywhere else in the Americas. Nar is apparently the Wolof/Senegalese term to refer to Moors, most likely from Mauritania. There have been several mentionings of “Moors” or “North Africans” in West Indian as well as Brazilian slave registers, but far fewer in number. To be sure they are still overall a minority but still noticeably present, even quite a few females. It’s tempting to assume many of them might have arrived as a result of the warfare between Mauritanian Moors and Senegalese Wolof instigated by the British during their brief occupation in the 1770’s of the French slave port Saint Louis near the mouth of the Senegal river (Searing, 1993, p.153). It is often forgotten that despite having a reputation of having been slave raiders both the Moors and the Fula were often victimized themselves as well, as not all of their military campaigns were succesful. For maps and more context see also this page: Sahel Region.
Bight of Benin
This is the third largest region of featured origins according to total number and second when it comes to reported diversity. This area is also likely to be hosting the most distinctive African origins for Louisiana when compared with other parts of the USA. Generally speaking it can be said that Louisiana shares its Upper Guinean and Central African roots to a great degree with especially South Carolina. While its Bight of Biafra and Gold Coast origins will also be similar to other parts of the USA. However it is known from documented slave voyages that both Virginia and South Carolina received relatively very few captives from the Bight of Benin, below 3% according to the Trans Atlantic Slave Trade Database (see chart above). While for Louisiana it could be as high as 20%. But that’s not even including the inflow of Haitians in 1809.
The socalled Mina however might also (partially) hail from the Gold Coast. Overall they are the third biggest group being mentioned in the Lousisana Database, but there is uncertainty about the exact meaning of “Mina”. It might sometimes refer to Gbe speaking people from Benin/Togo however Akan speakers from Ghana could also be intended (imported by way of either Jamaica or South Carolina). In Hall (2005) it is rightfully mentioned that in Brazil this very same “Mina” ethnolabel was usually applied for people being shipped from the Bight of Benin. As the Portuguese referred to the whole Lower Guinea coast as the Mina Coast, after their famous Elmina or rather São Jorge da Mina fortress on Ghana’s coastline but most of their actual slave trade was more to the east. In Cuba a distinction was made between “Mina Popo” from Benin/Togo and the “Mina Fanti” from Ghana (see Liberated Africans website). For more indepth discussion see:
- “African Ethnicities and the meanings of ‘Mina‘” by Gwendolyn Midlo Hall.
- And also “Ethnicities of Enslaved Africans in the Diaspora: On the Meanings of “Mina” (Again)” .
So as far as the Mina would be hailing from Ghana they might actually not be that very much distinct for Louisiana in a USA context. However it’s likely that the Fon, Hausa and Yoruba presence in other parts of the USA was much less significant than for Louisiana. As this pronounced Bight of Benin connection for Louisiana seems to be related to French slave trade patterns also to be observed in Haiti for example. And possibly also because Louisiana continued to illegally import African slaves after 1807 in greater proportion than other USA states.
The socalled Chamba make for an interesting casestudy, as they are a bit mysterious. It is thought they represent people from the interior of both the Gold Coast and the Bight of Benin with probably mostly Gur speaking people being involved (see ethnolinguistical maps). The Chamba are not often discussed or “claimed” by people seeking their African roots. However they were quite numerous not only in Louisiana but also in the various Slave Registers for the West Indies and also among the Runaway Slaves from Jamaica (see this Anglo-Caribbean overview for charts). So i would imagine they could also have arrived in considerable numbers in other parts of the USA (Virginia, South Carolina), even when hardly (?) documented.
Bight of Biafra
Louisiana’s Bight of Benin origins are also striking because unlike for example Virginia the proportion for Bight of Biafra in documented Trans Atlantic Slave Trade is much smaller than it is for Bight of Benin. However this leaves out of the equation Intercolonial Slave Trade with especially Jamaica, illegal slave smuggling after 1807 and the massive flow of enslaved persons being brought to Louisiana after 1820 through the Domestic Slave Trade with the Upper South and especially Virginia. By these indirect or undocumented routes many Louisianians might still have a great deal of Bight of Biafra and specifically Igbo origins yet. See also this previous blogpost: The Igbo Connection for Virginia & Virginia-Descendants.
In fact already in the above overview (which only goes to 1820 and doesn’t specify the African origins of native born slaves) the Igbo presence is quite pronounced, being placed fifth as most frequently mentioned. Most of them might indeed have been ethnically Igbo but it’s good to be aware that other ethnic possibilities for Biafran ancestry also exist, even aside from the Ibibio/Moco and the Calabar who also get mentioned along the Igbo. Interestingly Calabar is much more frequently used in the Hispanic Americas as an umbrella term for people from the Bight of Biafra. In Cuba apparently a finer distinction was made as well. For the Liberated Africans in Havanna no less than 51 Carabali subgroups have been documented! Yet again highlighting the clustering effect and African identies being redefined in the Americas itself.
Very intriguing is the notable presence of the Edo people, a.k.a. Bini, who were from the famous Benin Empire in southern Nigeria (not to be confused with the modernday country of Benin which only “borrowed” the name). Hall places them under Bight of Biafra, but i suppose it could also very well be possible they were transshipped via slaveports in Yorubaland along the Bight of Benin. The Edo being located right in the center of southern Nigeria. Compared with the Igbo and the Yoruba, the Edo are rarely mentioned as possible ancestors of the Afro-Diaspora. And in fact there’s apparently also little evidence of their presence in the Americas. Which makes these Louisiana data all the more fascinating. For more details see also Hall (2005, p.105).
West Central Africa
The socalled Congo’s are by a far stretch the most numerous African group being mentioned in the Louisiana Database, constituting about a third of all ethnic references! A bit higher than expected on basis of Trans Atlantic slave voyages but again that database is far from complete when it comes to Louisiana’s African origins. The significant cultural impact of the Congo’s has been studied by scholars for many years even when the general public might not be fully aware. The Congo Square perhaps being of the highest symbolic meaning (see this link for detailed info). But also the trademark dish of Louisiana cuisine, Gumbo, might very well be connected to them as its etymology is considered by many to have derived from a Bantu language.
It is quite remarkable that only one single ethnic/regional descriptor was used for all captives hailing from Central Africa. However from other historical sources it’s apparent that the Congo was used as an umbrella term, even when possibly a majority or plurality might have been ethnically Bakongo. See also West-Central African Maps. In fact people of the very same background might very well have been termed “Angolan” in 18th century South Carolina. It’s very telling that in the recently published data on Liberated Africans from Cuba, no less than 129 (!) separate sub-groups were distinguished for the “Congo”. Revealing that they might not have been as homogenous as portrayed.
In the next section i will provide more details on the timing and circumstance of their arrivals in Louisiana. Generally speaking they are said to have become increasingly prevalent especially in the late 1700’s and early 1800’s. However already in the early 1700’s their presence has been attested for.
East Coast
This would be referring to Southeast African connections. Relatively speaking very minor in overall Trans Atlantic Slave trade because of the distances involved and the far greater pull of Indian Ocean Slave Trade instead. In this Louisiana Slave Database the 102 socalled Makwa, an ethnic group from northern Mozambique, are about 1% of all 8994 ethnically specified Africans, which is pretty much in line with what we know from documented slave voyages. Actually some Mozambicans might also have arrived by way of Haiti. The French having trading relations with Southeast Africa mostly because of their island colonies in the Indian Ocean: Mauritius, Réunion and the Seychelles.
It is still very interesting that these Makua people are documented also for Louisiana, even when limited in number they might still have been quite distinct for the USA context. Elsewhere the Southeast African slave trade was also quite minor and more so focussed on Madagascar rather than Mozambique. But especially for Virginia and New York some early founding effects might have made their genetical contributions greater than their initial numbers. In fact due to the Domestic Slave Trade, often ultimately involving Virginia, some Louisianians might also have inherited traces of Malagassy ancestry in addition to their documented Makua origins from Mozambique.
***
Waves of Ethnic Origins
***French Period 1723-1769 (homens=males; mulheres=females)

Source: Hall (2005b)
***Spanish Period 1770-1803 (homens=males; mulheres=females) (Canga total should read 168)

Source: Hall (2005b)
***American Period 1804-1820 (homens=males; mulheres=females)

Source: Hall (2005b)
***New Orleans 1796-1803

Source: “Slaves and Slavery in Louisiana – The Evolution of Atlantic World Identities, 1791-1831” (Roberts, 2003)
____________________
“In fact, with the exception of one trans-atlantic voyage from Senegambia to Louisiana in 1743, almost no Africans arrived in Louisiana between 1731 and the early 1780s. The result was that the “charter generation” of slaves, most of whom were apparently native Bambara, Mandinga, and other Mande peoples, became distinctly Senegambian in character.” (Roberts, 2003, p.15 )
“encapsulated a much larger trend that was fundamentally altering the ethnic composition and social identities of Louisiana’s enslaved people: the massive, forced migration of nearly 10,000 African slaves to the colony between 1796 and 1810. Though termed “re –Africanization” by two scholars of the period, this process is more aptly described as “Congolization,” given the preponderance of Congolese peoples within this most recent influx of Africans. Not since 1743 had a major wave of Africans arrived in the colony, and even that migration, for all its significance in the historiography, was dwarfed by the size of this later one” (Roberts, 2003, p.102)
“Just as thousands of Africans poured into the colony from 1791 to1810, slaves from the Upper South dominated the migrations following that period. ” (Roberts, 2003, p.199)
“Because so many of Louisiana’s new cotton planters were Anglo-Americans, they brought with them enslaved African Americans from Upper Southern cultures that had been creolized for decades. Simultaneously, then, the twin economic evolutions in sugar and cotton cultivation imposed oppositional cultural forces upon the colony’s existing slaves. Though African and American slaves appear in records from all districts of the colony during this period, clear geographical delineations existed: slaves of Anglo-American owners arrived primarily in the upland cotton districts, Natchitoches and the Florida parishes, while the newly-arrived Africans dominated the sugar region immediately north and west of New Orleans. Attakapas and Opelousas— given their location in between these two regions—served as a transition zone with a blend of cotton and sugar cultures that produceda meeting place for African and American slave cultures.” (Roberts, 2003, p.105)
“ In 1806 and 1807, the Charleston Courier reported on five vessels leaving the city for New Orleans; since each of these was newsworthy because of odd events in their voyage, they must represent only a fraction of South Carolina’s re-export trade to Louisiana. That trade, which has been largely overlooked by scholars, was as important to Louisiana as the Caribbean re-export trade during the 1780s.” (Roberts, 2003, p.135)
“The main Caribbean transshipment points for Spanish Louisiana were Jamaica, St. Dominigue, Martinique, and, after 1790, Cuba. ” (Hall, 2005, p.74)
“[…] the small overall slave population in Spanish Louisiana meant that in the era of the slave trade waves of new Africans had a disproportionate influence on the cultural geography of the region.” (Chambers, 2008, p.342)
“After the United States took over Louisiana in late 1803, it is evident that Africans from the Bight of Biafra were being smuggled into Louisiana in large numbers. The Igbo became one of the five African ethnicities found most frequently in Louisiana documents after 1803. […] Igbo were obviously among ethnicities actively smuggled into Louisiana as well as into Cuba long after the foreign slave trade was outlawed.” (Hall, 2005, pp.140-141)
____________________
The arrival in Louisiana of distinct ethnic groups from Africa and also locally born people from the Upper South and Haiti of perhaps already mixed (within Africa) ethnic origins has been a very complex process. Something which often tends to get underestimated. Even so, some broader patterns of clustered waves might still be distinguished. I’ve highlighted a few quotations in an attempt to shed some light on all the history behind it but obviously it’s only a very limited selection. However very roughly summarizing the authors i’ve been quoting i think the following scheme might be useful (even when not fully complete 😉 )
- French period: irregular and small scaled Trans Atlantic Slave Trade involving mainly Senegambians and also people from the Bight of Benin and Central Africa to a lesser degree
- Spanish period: mostly Intercolonial Slave Trade with the West Indies, especially Jamaica. Much more diversified origins than previously but increasingly from Central Africa
- American period: at first Intercolonial trade with South Carolina involving reexported Africans, many of them again Congolese but also from the Gold Coast & Sierra Leone; later on a massive inflow of enslaved Americans of hybrid African origin, but possibly with elevated Bight of Biafra ancestry. Also illegal Trans Atlantic Slave Trade which paralleled the one to Cuba in origins.
Of course there will be remaining uncertainties about exact proportions and how all these various people might have intermingled over time and gave birth to new generations of locally born Louisianians. The African ethnic origins of American-born slaves as well as Free Blacks and Creoles of mixed-race heritage can usually not be verified by the Louisiana Slave Database. In a follow-up blogpost i will devote more attention to what this may imply specifically for the Senegambian origins of Louisiana.
But i find it personally already very insightful that in order to get a full scope on Louisiana’s African origins you should look beyond merely documented Trans Atlantic Slave Trade with Africa and also consider Intercolonial Slave Trade with the West Indies and the Domestic Slave Trade with the Upper South. This goes more so for Louisiana than perhaps any other USA state. Again because of its particular colonial history.
To conclude this section it might be a useful exercise to tease out the top 5’s from the charts i posted above. Just to see if they reasonably correspond with the general trends i also described above. Keeping in mind that it’s samplebased data we’re dealing with and especially for the earliest period the samplesize is quite small. Also i suppose it’s possible some individuals might have been doublecounted or appearing in documentation of two overlapping periods.
Top 5 most frequently mentioned ethnic groups
French Period 1723-1769
- Bambara/Bamana (51)
- Congo (51)
- Yoruba/Nago (22)
- Wolof/Senegal (21)
- Fon/Alada (20)
Spanish Period 1770-1803
- Congo (999)
- Mandinga (467)
- Mina (325)
- Wolof/Senegal (313)
- Bamana/Bambara (263)
American Period 1804-1820
- Congo (1938)
- Mandinga (448)
- Mina (292)
- Igbo (281)
- Wolof/Senegal (263)
New Orleans 1796-1803
- Congo (33.6%)
- Mandinga (13.8%)
- Chamba (8.3%)
- Mina (8.2%)
- Igbo (4.9%)
I would say that the top ranking of the Congo is very consistent, surprisingly even for the early French period. The Upper Guinean presence, as measured by the Bambara, Wolof and Mandinga, is also quite steady. But especially the Bambara make a decline relatively speaking, while the Igbo and Mina are on the rise starting from the Spanish period. All in all pretty much in line with what historians have been uncovering about the African origins of Louisiana. I find it striking that the Chamba are positioned third in the more limited overview for only New Orleans. They are probably the least discussed ethnic group but undeservedly so as far as i’m concerned. Afterall the full range of ethnic origins of Louisiana is of value when wanting to Trace African Roots!
___________________________________________________
Suggested Links:
- Louisiana Slave Database
- New Orleans Slave and Free People of Color Baptismal Records
- Folklife in Louisiana
- Whitney Plantation (Slave Inventory, incl. ethnic origins)
- IN MOTION: The African-American Migration Experience.
- The Louisiana Purchase and South Carolina’s Reopening of the Slave Trade in 1803
- To Be Sold: The American Slave Trade from Virginia to New Orleans
_________________________________________________________
Sources:
– Chambers, D. (2008). Slave trade merchants of Spanish New Orleans, 1763–1803 – Clarifying the colonial slave trade to Louisiana in Atlantic perspective. Atlantic Studies: Global Currents, 5, (3), 335-346.
– Hall, G. (2005). Slavery and African Ethnicities in the Americas: restoring the Links.
– Hall, G. (2005b). Crossing the Atlantic Ocean: African ethnic groups in the Americas. Topoi, 6, (10), 29-70 (available online in Portuguese).
– Ingersol, T.N. (1996). The Slave Trade and the Ethnic Diversity of Louisiana’s Slave Community. Louisiana History: The Journal of the Louisiana Historical Association, 37, (2), 133-161.
– Roberts, K.D. (2003). Slaves and Slavery in Louisiana: The Evolution of Atlantic World Identities, 1791-1831, dissertation. (available online)
– Searing, J.F. (1993). West African Slavery and Atlantic Commerce: The Senegal River Valley, 1700-1860.

I think Louisiana was more representative of the African populations transported to North America (i.e., the states). It also shows that Africans weren’t simply randomly thrown together as some scholars would have people to believe. Thank you so much for sharing this fine work.
LikeLiked by 1 person
You’re very welcome! I agree that overall Louisiana’s African make up may not be fundamentally different from other parts of the USA, except maybe a higher relative contribution from the Bight of Benin and also the Senegal river + hinterland. I suspect that the ancestral impact of the domestic slave trade is often underestimated. From the AncestryDNA results i’ve been collecting for people with 4 Louisiana-born grandparents their averages are pretty much in line with other parts of the USA. But there’s some individual outliers, especially higher Mali scores it seems. I will blog about it shortly.
LikeLike
My father’s side is predominantly French Creole and my mother is half white and half “black” with her black ancestry coming predominantly from Georgia. On my father’s side, I was able to trace one direct ancestor back to Africa, since he listed his place of birth.
I have included my DNA results:
Mali 20%
Great Britain 18%
Scandinavia 13%
Benin/Togo 13%
Cameroon/Congo 10%
Ivory Coast/Ghana 6%
Low Confidence Regions:
Africa Southeastern Bantu 3%
Senegal 3%
Iberian Peninsula 3%
Europe West 3%
Ireland/Scotland/Wales 2%
Europe East 2%
Africa South-Central Hunter-Gatherers 1%
Europe South 1%
Africa North <1%
Asia East <1%
Migrations:
Louisiana Creoles & African Americans
New York Settlers
LikeLiked by 1 person
Thanks for sharing! Very interesting to see the top ranking score for “Mali”. It’s something I have also often observed during my survey for Louisiana AncestryDNA results. See this spreadsheet for a complete overview:
https://docs.google.com/spreadsheets/d/1_sjsM56m-0ewGu1RlWbg2MtEwhWJrcbc4sRnvpkUquU/edit#gid=79552682
LikeLike