
Contents
- Trans-Atlantic Slave Trade Database
- Disclaimers / Pitfalls / Search Parameters
- Screenshots for Cape Verde, All Americas, USA, Brazil, Caribbean, Suriname/Guyana, Latin America
- Intra-American Slave Trade Database
- Disclaimers / Search Parameters
- Screenshots for All Americas, USA, Brazil, Latin America, French Caribbean
This main page is reserved for overview tables which have been generated from the excellent Slave Voyages website. Accompanied by observations from my side. Screenshots featured on this page have been taken in 2020 from first of all the Trans-Atlantic Slave Trade database. As well as the more recent Intra-American Slave Trade database.
Via the drop-down menu in the menu bar above or these links below you will find many additional overview tables & charts listing the ethnic origins of dislocated Africans and/or their cultural influences split out per region. I will regularly add new material after first posting on my main blog. Whenever appropriate these blog posts will also be referenced for more detailed context.
- Africa (incl. Cape Verde)
- Anglo-Caribbean
- Brazil
- Dutch-Caribbean, Suriname & South Africa
- Franco-Caribbean
- Hispanic Americas
- USA
I am convinced that the data contained in this section can be very educational and useful for anyone wanting to learn more about their African roots. Just as long as you keep in mind inherent limitations and inform yourself about the relevant context. This kind of aggregated information is probably most useful on a population level. But also for your personal quest it can provide you with a very valuable starting point! In particular in order to judge the historical plausibility of any DNA test results you may have received. For more detailed discussion see:
***
UPDATE 20-10-2020: this page was first published on 30 November 2014. Using screenshots from the Slave Voyages Database which I had originally generated already in 2010. Across the years this invaluable website has been steadily augmenting its coverage of documented Trans-Atlantic Slave Voyages. Which is why I have decided to update this page. Also in light of the recent addition of a separate Intra-American Slave Trade Database. New screenshots have been made, reflecting the current state of knowledge. Follow this link for the previous (2014) version of this page:
- Ethnic/Regional Origins (2014 version)
______________________________________________________________
1) Trans-Atlantic Slave Trade Database
____________________
“The Trans-Atlantic Slave Trade Database now comprises 36,000 individual slaving expeditions between 1514 and 1866. Records of the voyages have been found in archives and libraries throughout the Atlantic world. They provide information about vessels, routes, and the people associated with them, both enslaved and enslavers. Sources are cited for every voyage included. Users may search for information about a specific voyage or group of voyages. The website provides full interactive capability to analyze the data and report results in the form of statistical tables, graphs, maps, a timeline, and an animation.”
____________________
Despite several limitations the Slave Voyages Database is simply the most comprehensive and up-to-date resource available when wanting to look into Trans Atlantic Slave Trade patterns. Numerous historians have contributed to this database and it has practically become a standard reference among researchers worldwide. As always it is of course essential that this massive amount of data is interpreted correctly.
One major shortcoming used to be that only Trans-Atlantic Slave Voyages were taken into account. While Inter-Colonial Slave Trade between for example the West Indies and North America was not in scope. However in 2019 the website has been expanded with a new section featuring exactly these Inter-Colonial or rather Intra-American Slave Voyages. Screenshots dealing with Intra-American slave trade are shown further down this page. I will start by first listing an overview of possible disclaimers/pitfalls (not meant to be exhaustive). Followed by screenshots from the Trans-Atlantic Slave Trade database, which were all taken in October 2020. Therefore representing the most current state of knowledge.
Disclaimers:
- Slave trade patterns dating back from several centuries ago should NOT be expected to provide a 100% accurate or fully conclusive overview of ethnic/regional origins for modernday Afro-descended populations. The Slave Voyages database has been set up as an ongoing research effort. Also due to other complexities (such as overland Domestic Slave Trade and post-Slavery migrations) this data can only ever be seen as INDICATIVE!
- The Trans-Atlantic Slave Trade database only contains documented slave voyages sailing directly from Africa. Indirect slave voyages (from the West Indies to North America for example) are NOT included in the overviews immediately below. However such information can be found if you scroll further down to the second section of this page. The overviews which are shown in this separate section are based on the new Intra-American Slave Trade database. Which again is very much a work in progress!
- Obviously undocumented slave voyages (usually contraband) are NOT included within these overviews. Unless these voyages were intercepted or written about otherwise. Still according to the website its coverage for Northwest European slave trade (UK, France, Netherlands, Denmark etc.) is assumed to be nearly complete. For British slave trade this coverage is even estimated to be around 95%! Which is of course very impressive and therefore likely to be quite representative!
- The coverage for early Portuguese/Spanish slave voyages (1500’s) has been greatly improved as well. Although it is said to be still lacking when compared with (more recent) records for Dutch, French and British slave trade. The new additions (which took place since 2016 it seems) have been enormously helpful to gain greater insight! 1
- As always familiarize yourself with the full CONTEXT before jumping to conclusions! Aside from overviews which feature proportional shares I have also included overview tables featuring the underlying numbers. For greater understanding do take note of the absolute numbers the %’s represent.
- Keep in mind that the African embarkation regions have been defined according to historical convention (“Sierra Leone” is also including Guinea Conakry e.g.). To learn more about what for example is being implied by Bight of Biafra or Bight of Benin follow these links :
- Slave Trade Maps (scroll down to the end)
- Introductory Maps
- Map containing all embarkation regions & ports (zoom in for it by using your mouse wheel)
- Anyone who is truly interested in learning how to correctly interpret this vast amount of data should read the website’s guidance: UNDERSTANDING THE DATABASE.
***
Pitfalls:
I myself have often relied heavily on the material on display in this section as some sort of baseline. To establish historical plausibility within my ongoing research efforts on how personal DNA test results of Afro Diasporans may already be in alignment with historical expectations. See also:
- AncestryDNA surveys (2013-2018)
- Documented African origins confirmed on group level? (2016) (scroll down to section 4)
- Afro-Diasporan AncestryDNA Survey (part 1) (2018)
- 23andme surveys (2019-ongoing)
- African DNA Matching patterns (2017-ongoing)
It can be very tempting to correlate slave trade records with population genetics or assumed ethnic/regional origins of Afro-descended populations. Given the absence of more straightforward information. But such an approach can hold many pitfalls. Even if the Slave Voyages database is deemed to provide nearly fully coverage for any particular country. This is because you cannot just simply assume that there will be a direct extrapolation from the data at hand. Reality is too complex regrettably. Some factors to take into account:
- Reproduction and other essential demographic aspects for each ethnic/regional group coming from Africa are a big unknown and might vary according to time period and destination.
- Sex ratio’s of ethnic/regional groups being brought in. The gender ratio of captives on the slave ships is actually a key search parameter within the database! Also from other historical sources it is known for example that Senegambian captives have often been mainly male POW’s. Unlike enslaved Igbo’s who had a more balanced gender ratio. All things being the same otherwise it may perhaps be assumed that women may have had more offspring than men.
- Timing of the slave imports, early arrivals, so-called charter generations, might have set in motion a cumulative founding effect. Especially if they were able to set the standards of a new creolized culture to which subsequent newcomers had to adapt themselves to.
- Difference in mortality rates caused by slave regime being more brutal in some regions or time periods than others. Also the employment of slaves in cities/households versus rural areas would have mattered for their life expectancy. As well as differences in climate zones, disease environments etc.
- Coastal embarkation regions do not always correspond with modern day national borders or presentday ethnic groups. Despite ongoing research and new insights historians will not always agree upon the approximate share of slave trade from the (deep) interior. And also if there was any difference between time periods.
- Slave ships often visited more than just one slave port during one voyage and these slaveports themselves sometimes functioned as a gathering point for more than one single embarkation region. So for example a captive with a Mande background could have boarded a slave ship in not only Senegambia and Sierra Leone but also (less frequently) in the Gold Coast.
- Intra-American Slave Trade, Domestic overland Slave Trade and Post Slavery migrations have resulted in great deal of additional intermingling and diversification of African lineage. This is especially true for the USA and Brazil because of their continental size. But in fact also for most parts of the Caribbean and Latin America.
Obviously there will be other factors as well that could explain genetic results being disproportionate to what you might expect based on slave trade data. Substructure within any given Afro-descended population also being highly relevant. I will return to this topic frequently in my blog posts. For a recent article of mine specifically dealing with these pitfalls:
Search parameters
Only one final disclaimer/caveat to go before the actual overviews: I have left out “Other Africa” as place of purchase. In fact I have also excluded “Europe” and “Other” within my search queries to generate the overview tables shown below. These latter categories are very minimal in number and also irrelevant when wanting to focus on African slave trade destined for the Americas. However “Other Africa” represents a considerable number of slave voyages. Around 20% of the total (see this screenshot). As the name implies this category is intended for slave voyages which cannot be grouped under the existing pre-defined embarkation regions (see this map). Usually because this information is completely absent or unknown. But sometimes also because of multiple or overlapping embarkation regions. In these latter cases it is of course worthwhile to look for further clues. But generally speaking I have decided that for my research purposes this category does not have much added value. Which is why “Other Africa” is not being shown in the overviews below. (go to the 2014 version of this page to see tables which do include “Other Africa”).
If you start on this page and then go to “Itinerary” you can reproduce anything shown below if you select the same search parameters as I did for:
- Place of Purchase / Principal place of slave purchase = Africa with “other Africa” unticked.
- Place of Landing / Principal place of slave landing = whichever Disembarkation Region I have highlighted
- Rows = Embarkation Regions or Time Periods (100 years but you can also select other intervals)
- Columns = Broad/Specific Disembarkation Regions
- Cells = Sum/Percent of Disembarked Slaves
The ony exception are the first two tables I generated whereby I selected Cape Verde as a specific place of purchase within Africa. While the disembarkation regions across the Americas are featured in the rows. Of course you can set up your own queries any way you like and therefore produce your own customized overviews as well. It is also good to know that actually there is a separate Estimates section on the Slave Voyages website. Which goes beyond documented Slave Voyages. It “takes into account the incomplete nature of historical evidence and adjust figures derived from the Voyages Database upwards to provide an account of the actual volume of the slave trade.” Follow this link:
See also these overviews taken from the Estimates section. Mostly in line with what has been documented. Compare also with tables 1.6 and 1.7. But it seems that these Estimates have not been updated yet since 2010/2016? In particular the Senegambian estimates for the Hispanic Americas appear to be subdued given the recent addition of early Portuguese/Spanish slave voyages.2
- Overview of estimated slave trade for all of the Americas (numbers)
- Overview of estimated slave trade for all of the Americas (%)
______________________________________________________________
Cabo Verde
Table 1.1 (click to enlarge)

Trans-Atlantic Slave Trade Database (2020) (www.slavevoyages.org)
***
Table 1.2 (click to enlarge)

Trans-Atlantic Slave Trade Database (2020) (www.slavevoyages.org)
***
Table 1.3 (click to enlarge)

Trans-Atlantic Slave Trade Database (2020) (www.slavevoyages.org)
***
Table 1.4 (click to enlarge)

Trans-Atlantic Slave Trade Database (2020) (www.slavevoyages.org)
- Coverage of slave trade data from Cape Verde has increased tremendously! It seems this update took place already in 2016. When compared with the 2010 version of the database a tripling in number of disembarked captives occurred (35,669 versus 108,700; see also this previous screenshot taken in 2014).
- Keep in mind that Cape Verde was serving as a collection/transit hub for captives born on the mainland from the wider Upper Guinean area (incl. both Senegambia and Sierra Leone actually). Hardly any locally-born islanders would be among these captives. Although incidentally (especially during droughts) Cape Verdean-born captives have been recorded as well. The preceding slave voyages which took place between Cape Verde and Upper Guinea are regrettably not well in scope yet. Although there is much historical evidence available about the main trends. See also:
- Regional Origins of Cape Verdeans (CVRAIZ.com)
- Cape Verde Slave Census of 1856 (part 1)
- Cape Verde Slave Census of 1856 (part 2)
- Take note that overwhelmingly (~75%) slave trade departing from Cape Verde took place in the 1500’s and was mostly directed to the Spanish ruled colonies of Latin America (incl. Hispanic Caribbean around 90%). This addition has been very beneficial therefore for showcasing the early Upper Guinean founding effect for Hispanic Americans. Something which I have been blogging about since starting this blog in 2014. For more details:
All of the Americas
This overview below shows the percentage of disembarked slaves according to century of arrival. The dating of these arrivals and the transition to a majority of locally-born “creolized” populations is fundamental for Tracing African Roots. In particular when zooming into regional lineage but also in fact historically plausible ethnic lineage. It also impacts your African DNA matches and expected shared DNA amounts.
Take note that for African Americans and most West Indians it will be the 1700’s when the greater part (>75%) of their African ancestors arrived in the Americas. However for many Latin Americans instead it will be much earlier: the 1500’s/1600s. While for Brazilians it is actually the 1700’s/1800’s! For more detailed discussion read these blogposts:
- From African to Creole (2015)
- Why even small African matches matter! (2020)
Table 1.5 (click to enlarge)

Follow this link for the underlying numbers. Trans-Atlantic Slave Trade Database (2020) (www.slavevoyages.org)
***
All destinations within the Americas received African captives from various places in between Senegambia and Mozambique. In that sense the entire Trans-Atlantic Afro-Diaspora shares a common feature in that their African ancestry is bound to be an intricate and seemingly randomized blending of various ancestral lineages from throughout West, Central and Southeast Africa. However more distinctive patterns and locally defining clusters can be seen as well. When looking into relative and proportional shares as well as primary regions:
- Bight of Benin (includes western Nigeria) has the highest % in Brazil but is also elevated for the Caribbean
- Bight of Biafra (includes eastern Nigeria) is most significant for the Caribbean but also important for the USA
- Gold Coast is again biggest for the Caribbean (includes all the islands, not just English speaking ones)
- Senegambia is shown to be most important for the Hispanic Americas and not for the USA as is often assumed
- Sierra Leone & Windward Coast shares are biggest for USA and quite minor or even neglible elsewhere
- Central Africa peaks in Brazil and the Hispanic Americas but is also important for the USA & the Caribbean
- Southeast Africa is minor for all but most noticeable in Brazil & the Hispanic Americas
***
Table 1.6 (click to enlarge)

Trans-Atlantic Slave Trade Database (2020) (www.slavevoyages.org)
***
Table 1.7 (click to enlarge)

Trans-Atlantic Slave Trade Database (2020) (www.slavevoyages.org)
Selected parts of the Americas
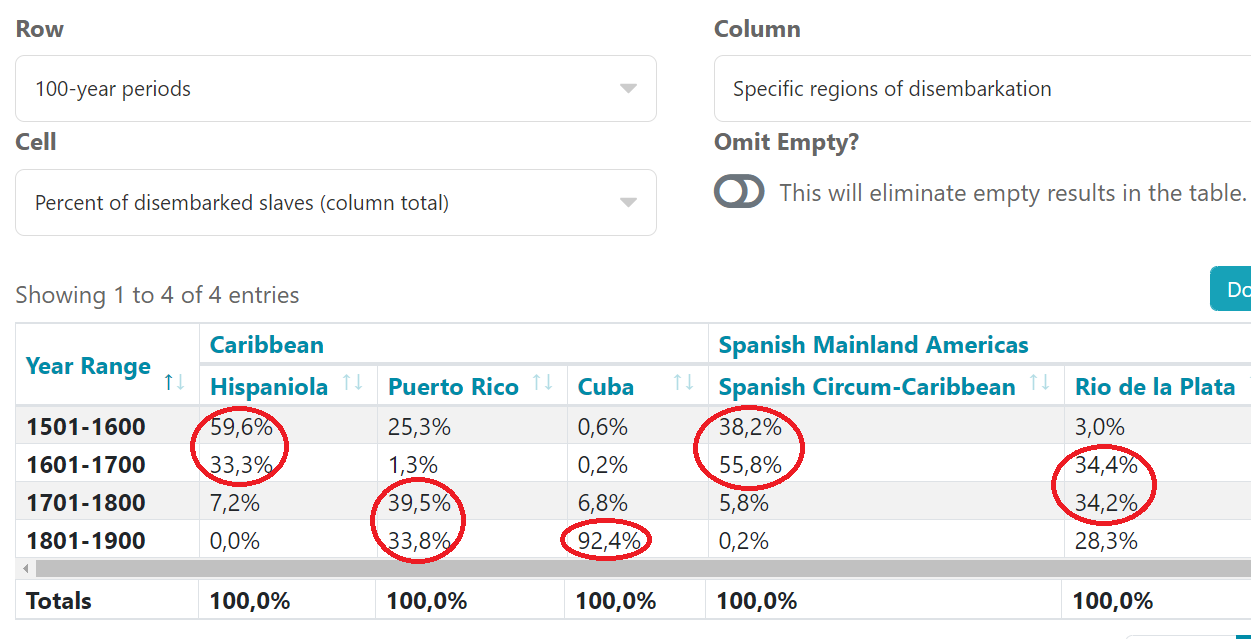
These overviews feature most of the trends identified above. But zooming into more specific places within countries or the broader area of the Caribbean is very beneficial for detecting localized patterns.
See tables 1.8 and 1.9:
- Slave imports for Cuba, Trinidad and Southeast Brazil took place mostly in the 1800’s which is in great contrast with in particular the Dominican Republic (=Hispaniola) but also the so-called Spanish Circum-Caribbean (=mostly Mexico and Colombia) where most African ancestry is to be dated to the 1500’s/1600’s.
- Most other countries/regions are somewhere in between (1700’s). Barbados also showing a minor but still considerable share from the 1600’s.
Table 1.8 (click to enlarge)

Trans-Atlantic Slave Trade Database (2020) (www.slavevoyages.org)
***
Table 1.9 (click to enlarge)

Trans-Atlantic Slave Trade Database (2020) (www.slavevoyages.org)
***
See tables 1.10 and 1.11:
- Bight of Benin is most notable for Bahia/Brazil and Saint Domingue (=Haiti). However it is also quite considerable for the Dutch Guianas (=Suriname & Guyana) and Barbados
- Bight of Biafra dominates slave trade especially in Trinidad and Virginia. But is also significant in Jamaica and Barbados.
- Gold Coast is almost equally important for Jamaica, Barbados and the Dutch Guianas (=Suriname & Guyana)
- Senegambia is peaking in the Dominican Republic, Puerto Rico and the Spanish Circum-Caribbean (=mostly Mexico and Colombia)
- Sierra Leone is showing up with its highest share in South Carolina, followed by Cuba and Puerto Rico
- Windward Coast is having its highest proportion in the Dutch Guianas (=Suriname & Guyana) but also noteworthy in South Carolina
- Central Africa is clearly predominant in Southeast Brazil and otherwise also showing up strongly in the Spanish Circum-Caribbean and Haiti (Saint Domingue)
- Southeast Africa is relatively speaking at its highest in Southeast Brazil and Cuba
Table 1.10 (click to enlarge)

Follow this link for the underlying numbers. Trans-Atlantic Slave Trade Database (2020) (www.slavevoyages.org)
***
Table 1.11 (click to enlarge)

Follow this link for the underlying numbers. Trans-Atlantic Slave Trade Database (2020) (www.slavevoyages.org)
***
USA
- Keep in mind that Intra-American & Domestic slave trade as well as modern day migrations are not accounted for! If you scroll down to the second section of this page you can have a look at additional overviews detailing Intra-American slave trade for the USA.
- According to estimates Inter-Colonial Slave Trade by way of the West Indies covers about 15% of total slave trade (internationally and by sea) for the USA. Therefore Trans Atlantic Slave trade is far more important for the USA, generally speaking. Then again for certain states this Intra-American Slave Trade was more significant than for others. Domestic Slave Trade however involved a greater number of people (possibly 1.2 million) than Trans-Atlantic and Intra-American Slave Trade combined (around 450,000 disembarked).
Table 1.12 (click to enlarge)

Follow this link for the underlying numbers. Trans-Atlantic Slave Trade Database (2020) (www.slavevoyages.org)
***
Remember that some of %’s highlighted above represent a relatively small number of people (see this link for the underlying numbers). Naturally also the previous disclaimers about all sorts of either forced or voluntary migrations are to be taken into account! As such movement and intermingling of people across the generations has inevitably lead to greater diversification. This overview therefore is not intended to be fully representative of the specific African origins of each state mentioned. Most likely only for Virginia and South Carolina the proportional shares are still reasonably reflected in localized genepools as well. That is to say for people with same state origins on all lines, preferably to be traced back beyond the mid-1800’s!
Then again taking note of the highest proportional shares for each embarkation region can be informative.
- Bight of Benin is neglible for most states but quite considerable %’s are showing up for Florida and the Gulf Coast (=mainly Louisiana). Given the underlying numbers (only 698 for Florida) as well as the additional known connection with Haiti this might be more so applicable for Louisiana.
- Bight of Biafra dominates slave trade especially for Virginia. And to a lesser degree also in neighbouring Maryland. Do notice that South Carolina does have a considerable share of 10% as well! Given that Virginia holds such a pivotal role in Domestic Slave Trade this outcome is actually also very relevant for other African Americans who might often have ultimate Virginia state origins if they trace back far enough. See also:
- Gold Coast is proportionally speaking most elevated for New York, but the underlying number is only 504. Otherwise it can be assumed that such lineage is actually fairly evenly distributed across most states with a share of around 10-15%. Also reinforced by Intra-American Slave trade from the West Indies.
- Senegambia is clearly peaking for Louisiana (Gulf Coast), at least when going by %’s. Take note that this strikingly high share of 52% is actually based on a relatively low number of 5,208 captives. In absolute numbers by far the most Senegambians went to South Carolina instead (24,766). Given additional Intra-American as well as Domestic Slave trade into Louisiana actually table 1.12 could be severely distorting the actual proportions. Afterall this breakdown is measured by Trans-Atlantic Slave trade only! See also:
- Sierra Leone is showing up with its highest share in Georgia and Florida followed by South Carolina (which received the greatest number). These are all neighbouring states. And notable for the Gullah-Geechee Corridor passing through their adjoining coastal areas! See also:
- Windward Coast is again peaking in Georgia and South Carolina. But actually also present in Virginia.
- Central Africa is widespread at elevated levels (>20%) across most states. However South Carolina has the biggest share, both relatively speaking and in sheer numbers. See also:
- Southeast Africa is overall speaking only representing a share of less than 2% (see table 1.6). However interestingly it was especially apparent in direct Trans-Atlantic Slave Voyages to New York. Bringing in Malagasy captives from Madgascar in the late 1600’s and early 1700’s. Also noticeable for Virginia, which received a greater number of them actually (1,441 vs. 880) See also:
- The DNA Trail from Madagascar to Manhattan (Part 1 & Part 2) (Radiant Roots, Boricua Branches)
- The DNA Trail from Madagascar to Virginia (Radiant Roots, Boricua Branches)
Table 1.13 (click to enlarge)

Trans-Atlantic Slave Trade Database (2020) (www.slavevoyages.org)
- Table 1.13 shows which time periods were characterized by the most numerous arrivals of enslaved persons from Africa for either Virginia or South Carolina. It shows a clear and important differentiation. South Carolina has a minor but significant share of African arrivals in the early 1800’s of about 30%. While Virginia’s imports of African captives were mostly occurring before 1750, implying a rather early Creolization (read more in this post).
- Virginia and South Carolina were by far the most important ports of entry for Africans into North America. And many if not most African Americans will ultimately trace their USA origins back to these states even if their families have lived elsewhere for several generations. If you have tested with Ancestry their so-called genetic communties will usually give solid clues of your main state-origins within the USA.
- It is often remarked that going by absolute numbers South Carolina surpasses Virginia when it comes to direct Trans-Atlantic arrivals of Africans. And this is true. Most likely around twice as many even! See also this overview:
- However what is often forgotten or not taken into full consideration is that Virginia’s slave imports took place earlier in time than for South Carolina. And perhaps even more crucially early population growth of enslaved African Americans in Virginia was much greater than in South Carolina. Which resulted in Virginia having the most numerous African American population well into the mid-1800’s (see this link). Due to subsequent Domestic Slave which is known to have affected Virginia more than any other state this lead to a great dispersal of Virginia-born African Americans. The African lineage of their descendants who are now spread all over the USA therefore might still often reflect the specific slave trade patterns of that state. In particular increased Bight of Biafra ancestry. See also:
Brazil
- Amazonia is referring mostly to the state of Maranhão and secondly Pará in northern Brazil; Bahia & Pernambuco are states located in Northeast Brazil; Southeast Brazil is referring mostly to Rio de Janeiro & Minas Gerais.
- Brazil was by far the greatest importer of enslaved Africans within the Americas. This massive slave trade took place during a very long time span. Similar to Cuba lasting into the mid-1800’s. And in fact the greatest number of Africans were also arriving in the 1800’s! Probably contributing to a greater degree of African retention (culturally speaking) than among for example African Americans.
- As shown in the first overview there is some regional distinction to me made though. Northern & Northeast Brazil received more than half of its slave imports from Africa before 1800. Although only representing a minor share for Bahia and Pernambuco also a considerable number of enslaved Africans arrived already in the 1600’s (combined around 100,000). However for Southeast Brazil/Rio it was clearly the 1800’s when overwhelmingly most Africans arrived.
- More research needs to be done but I suspect that similar to many other Latin Americans the African geneflow for Brazilians with relatively low amounts of African admixture (let’s say 25%) took place during earlier time periods than the 1800’s though. Due to large scale racial mixing which took place right from the start in Brazil’s colonisation in the 1500’s and onwards. Resulting in a separate racially mixed population segment (“pardo”) which because of social stigma may have been relatively endogamous. Or atleast less inclined to incorporate new African lineage. While self-identified “black” Brazilians may more often indeed trace most of their African lineage to the 1800’s. This should also be indicated by their African DNA matches showing a higher average of shared DNA I imagine. See also my discussion of this type of substructure according to admixture level for Puerto Ricans:
- Substructure in regional African origins according to admixture degree? (scroll down to section 2)
Table 1.14 (click to enlarge)

Follow this link for the underlying numbers. Trans-Atlantic Slave Trade Database (2020) (www.slavevoyages.org)
***
Table 1.15 (click to enlarge)

Trans-Atlantic Slave Trade Database (2020) (www.slavevoyages.org)
***
Table 1.16 (click to enlarge)

Trans-Atlantic Slave Trade Database (2020) (www.slavevoyages.org)
***
Same as for the USA keep in mind that domestic slave trade and modernday migrations are not accounted for! All of which may have contributed to greater diversification of African lineage and deviation from the expected regional orgins according to documented slave trade patterns. However I suspect that more so than for the USA this data will in fact often be clearly reflected in localized genepools as well. That is to say for people with same state origins on all lines, preferably to be traced back beyond the mid-1800’s! Given that Brazil’s slave trade patterns are more focused, making it easier to identify their main clusters of specific African lineage. Most embarkation regions only reaching a share smaller than 5% (see last column of table 1.15 ). While clearly Central Africa (to be combined with Southeast Africa=68%) and Bight Benin (24%) stand out as the major components.
- Bight of Benin is the place where most of Bahia’s African slave imports occurred. The contrast with especially Southeast Brazil as well as Amazonia is quite striking. Pernambuco being somewhat intermediate.
- Bight of Biafra was relatively speaking a minimal source of African captives for Brazil. However in absolute numbers still many people from the Bight of Biafra ended up in Brazil (~98,000).The greater part of them in Bahia.
- Gold Coast is again a minimal place of origin for Brazil’s slave trade. Interestingly however most Gold Coast captives arrived in Pernambuco. And more specifically from the former Portuguese Elmina fortress. Apparently mostly within the time-period 1700-1750 (see this query). At that time Elmina was already in Dutch hands for several decades. Also this took place after the short-lived Dutch occupation of Pernambuco (1630-1654). Still intriguing to see this continued Dutch connection.
- Senegambia is also a minor region of provenance for Brazil, overall speaking. However it is strikingly predominant in slave trade with Northern Brazil (Amazonia). This seems to have been caused mainly by currents and trading winds being more favourable for slaveships departing from mostly presentday Guiné Bissau, but at times also Cape Verde! The total numbers involved were relatively speaking minor. Atleast within the Brazilian context, see table 1.16. Then again this distinctive outcome may very well have caused a significant Upper Guinean shift in African origins for multi-generational Northern Brazilians.
- Sierra Leone & Windward Coast are the most marginal areas of slave trade for Brazil. Combined representing only 0.2% of total slave imports.
- Central Africa: undoubtedly the biggest part of Brazil’s African slave trade took place with Angola and the Congo. While also captives from modernday Zambia and other neighbouring countries were quite likely included. Really this goes for any region within Brazil as you will notice from table 1.15 that the Central African share never gets lower than 35% (in Bahia). But it is easily Southeast Brazil where most Central African captives landed. Representing the highest proportion also: an astonishing 81%! For Pernambuco this share is also very impressive though: 70%.
- Southeast Africa: again clearly peaking in Southeast Brazil with 15%. Rather minimal elsewhere, except for Pernambuco which still has a distinctive share of 3%. These captives would usually be shipped from Mozambique. But could actually also be hailing from neighbouring countries, especially Malawi. Unlike the USA the slave trade with Madagascar was usually minimal (see also this comparison).
***
Table 1.17 (click to enlarge)

Trans-Atlantic Slave Trade Database (2020) (www.slavevoyages.org)
***
In table 1.17 the regional breakdown is measured along the row. So it adds up to 100% when going from left to right, instead of along the column! It provides an extra pronounced display of the main patterns described above already. In particular it shows that:
- Senegambian slavevoyages were going overwhelmingly (88%) to Amazonia
- Bight of Benin slave voyages were overwhelmingly (89%) destined for Bahia
- Southeast Africa voyages were overwhelmingly (87%) directed towards Southeast Brazil
- Central African slave voyages were mostly (58%) headed for Southeast Brazil, although also a considerable share went to Bahia (22.8%) and Pernambuco (16.3%) instead.
- Gold Coast slave voyages were mostly (66%) routed to Pernambuco.
***
Anglo-Caribbean (Leeward & Windward)
- I have grouped these islands (all formerly part of the British Empire) according to geography mostly (see this map). But actually it is also their particular settlement history which seems to be decisive for most of the patterns on display. Previous colonization by the French for some of these islands also to be taken into account. Which is why I have grouped Dominica together with the Windward islands. Just as a reminder these overviews are only measuring Trans-Atlantic Slave Trade. However for some islands actually Intra-American Slave Trade by way of Jamaica, Barbados but also Martinique may have been more substantial! This theme will be picked up again in the second section of this page further down.
- Tortola is part of the British Virgin Islands and “Other British Caribbean” is mostly covering Bermuda’s.
Table 1.18 (click to enlarge)

Trans-Atlantic Slave Trade Database (2020) (www.slavevoyages.org)
***
Table 1.19 (click to enlarge)

Trans-Atlantic Slave Trade Database (2020) (www.slavevoyages.org)
***
See tables 1.18 and 1.19:
- As established previously (table 1.5) most Caribbeans will trace back the greater part of their African ancestry to the 1700’s. However there are some interesting exceptions and variations. Islands which have been (more or less) continuously under British rule and were also settled early on (mid-1600’s) seem more likely to have African ancestry from earlier time periods (1650-1750). This goes especially for Barbados, Nevis and Montserrat. And to a lesser degree also Antigua, St. Kitts and Jamaica.
- In contrast most if not all of the islands which used to be under French rule (most of the time) until 1763 tend to have a greater share of Trans-Atlantic slave imports from the period 1750-1850. These are mostly Windward islands, formerly also known as the “ceded islands” and interestingly often still retaining a French Patois: Dominica, St. Lucia, St. Vincent and Grenada. It should be reiterated that Intra-American Slave trade (incl. from Martinique) may have been significant in earlier time periods though.
- Trinidad and the Bahamas are somewhat outliers in that they show a predominant share of Trans-Atlantic slave trade occurring in the 1800’s. Trinidad has a complex colonial history involving also close ties with Martinique despite formal Spanish rule. It was incorporated within the British empire at a relatively late stage (1797). The Bahamas are known to have had a major influx of enslaved African Americans from mostly South Carolina after the American War of Independence (Loyalists). While even more exceptionally the Bahamas also had a minor but still quite detectable inflow (3.4% after 1850!) of so-called Recaptives: liberated Africans from intercepted slave ships.
Table 1.20 (click to enlarge)
***

Follow this link for the underlying numbers. Trans-Atlantic Slave Trade Database (2020) (www.slavevoyages.org)
***
Table 1.21 (click to enlarge)

Follow this link for the underlying numbers. Trans-Atlantic Slave Trade Database (2020) (www.slavevoyages.org)
***
Remember that some of %’s highlighted above represent a relatively small number of people. Do also check out the links mentioned underneath the tables for the underlying numbers. Naturally also previous disclaimers about Intra-American Slave Trade as well as Post-Slavery migrations between the islands are to be taken into account! As such constant movement and intermingling of people across the generations has inevitably lead to greater diversification of African lineage. This overview therefore is not intended to be fully representative of the specific African origins of each island. Most likely only for Jamaica and Barbados, the two main entry points of enslaved Africans in the Anglo-Caribbean, the proportional shares are still reasonably reflected in localized genepools as well. That is to say for people with same island origins on all lines, preferably to be traced back beyond the mid-1800’s!
See tables 1.20 and 1.21:
- Bight of Benin is showing up most strongly for Barbados and Nevis. Which fits well with their historically greater involvement with Trans-Atlantic Slave trade in the late 1600’s & early 1700’s when British slave traders were still frequently visiting the Bight of Benin.
- Bight of Biafra has a consistently big share on almost each island, usually in between 30-40%. Which is in line with British slave trade having its greatest focus in this region. Increasing till the very end of official slave trade in 1807. Perhaps no surprise that the highest shares are being reported therefore for Dominica and Trinidad because these islands had a peak in African arrivals in the last decades of slave trade.
- Gold Coast is another typical region of provenance for British slave trade. However interestingly much more variation to be seen. Probably to do with each island’s settlement history. Islands with well established and long-settled British rule tend to have the highest Gold Coast shares: Nevis, Montserrat, Jamaica and Barbados. Do also notice the rather low shares for Bahamas, Dominica and St. Lucia.
- Senegambia is overall speaking only a minor embarkation region for the Anglo-Caribbean. But a fascinatingly high share (22.8%) is being shown for Montserrat. Then again the underlying number (1,375) is rather small. And additional Intra-American Slave Trade will have decreased the actual Senegambian lineage among Montserratians.
- Sierra Leone is generally subdued and in the same league as Senegambia, overall speaking. Highest shares being obtained by Tobago, Bahamas and Grenada are quite telling though. Because they are in line with other historical clues for the latter two islands (Gullah connection between Bahamas and South Carolina and Carriacou’s Temnes link for Grenada).
- Windward Coast is again clearly in the lower range for most islands. No higher than 13.6% in Antigua. But also double-digit shares in Grenada, Tortola, Dominica and possibly the Bermuda’s (“Other British Caribbean”). Which is still quite distinctive when compared with other parts of the Afro-Diaspora.
- Central Africa is more noticeable in most islands. But it makes a very striking appearance in the Bahamas with a singular share of nearly 38%! Probably correlated with the relatively late arrival of African captives in the Bahamas in the 1800’s and also incl. many so-called Congo’s.
- Southeast Africa is practically absent for most islands. But very intriguingly it does show up with minor but still distinctive %’s for Nevis, Barbados, Montserrat and even Jamaica. Barbados having the highest number: 5,600. All these islands being characterized by steady British settlement in the late 1600’s – early 1700’s. In this timeperiod several unique but also well-documented slave voyages were undertaken to Madagascar! These were actually also disembarking in the British colonies in North America (Virginia and New York). A small proportion over all. But despite inevitable dilution amazingly this Madagascar connection is still leaving genetic traces in the form of Asian haplogroups, Southeast Asian trace admixture and actual Madagascar DNA matches! Also noteworthy that the 0.8% Southeast Africa share for Dominica is associated rather with a single slave voyage from Mozambique (Voyage ID 33524), a place more so visited by the French than the British.
Franco-Caribbean
Just as a reminder these overviews below are only measuring Trans-Atlantic Slave Trade. However for most of the French Caribbean Intra-American Slave Trade carried out by the British may have been quite substantial! But because most of this slave trade was clandestine actually much of it is still out of scope. In fact also the Inter-Colonial Slave trade carried out from Martinique to other French colonies seems to be underreported sofar (see this query, which only mentions one voyage to Guadeloupe). This theme will be picked up again in the second section of this page further down.
As an alternative it might be useful to pay close attention to any discrepancies in DNA testing for establishing any geneflow possibly reflecting British slave trade. For example in my 2015 survey of Haitian AncestryDNA results I came across a higher group average of “Ivory Coast/Ghana” than may have been expected. That is when relying solely on Trans-Atlantic Slave Data. The difference could very well be explained by additional Intra-American slave trade by the British from either Jamaica or Barbados. In an upcoming survey of African DNA matches for Haitians I hope to also shed more light on the possible extent of Bight of Biafra ancestry among Haitians. Possibly introduced chiefly by way of British Slave Trade. See also:
- Haitian AncestryDNA results (2015)
Table 1.22 (click to enlarge)
***

Follow this link for the underlying numbers. Trans-Atlantic Slave Trade Database (2020) (www.slavevoyages.org)
***
- Martinique is the only place within the French Caribbean where more than 50% of all enslaved Africans arrived before 1750 (by way of Trans Atlantic Slave Trade). Implying a relatively early creolization process for Martinique. This island was settled earlier than Saint-Domingue (current-day Haiti) and also used to be more important to the French, at least in the late 1600’s. It played a similar role to Barbados, in that it supplied other French colonies both with settlers and enslaved Africans. This includes Guadeloupe but also the so-called “ceded islands” which used to be under French rule (most of the time) before 1763: Dominica, St. Vincent, St. Lucia, Grenada. While also Trinidad received settlers from Martinique along with their enslaved labourforce in the late 1700’s.
- Saint-Domingue (=Haiti) instead was steadily increasing its slave imports during the 1700’s. On a massive scale even. Untill the Haitian Revolution put a stop to that. Practically all African ancestry for currentday Haitians is traceable to the 1700’s therefore. The second half of the 1700’s clearly saw the biggest number of Africans entering Haiti (471,000 = 77.3% of the total). Despite high mortality a locally born (creole) population segment did arise already in the first half of the 1700’s. So therefore it might still be that the genetic impact of earlier generations might turn out to be disproportionate to their initial numbers. A key sign of this might be the relative proportions of combined “Benin/Togo” and “Nigeria” scores in DNA testing versus Central African DNA. See also:
- Looking into the slave trade patterns across time for Guadeloupe it should be remembered that this island used to be dependent more so on Intra-American Slave Trade rather than Trans-Atlantic Slave Trade. However during a short-lived occupation by the British (1759-1763) such slave imports increased very rapidly. Which explains why for Guadeloupe it is rather the period 1750-1850 which saw the greatest degree of Trans-Atlantic Slave Trade. Do take note that in total numbers of Trans Atlantic Slave trade Guadeloupe was clearly secondary to Martinique (46,624 vs. 139,214, see this overview).
- French Guyane appears to have been a rather marginal colony within the French Caribbean. Judging also from the total number of African captives imported (16,163). Although it probably relied on Intra-American Slave trade as well. Trans-Atlantic Slave Trade was still quite consistent from early-on. It will be interesting to see if future research may reveal which time period left behind the most genetic impact.
Table 1.23 (click to enlarge)

Follow this link for the underlying numbers. Trans-Atlantic Slave Trade Database (2020) (www.slavevoyages.org)
***
See Table 1.23:
- Bight of Benin: a standout region for most parts of the French Caribbean. But in particular Martinique and Saint-Domingue (=Haiti). Slave trade with this region was especially prevalent in the first part of the 1700’s. Hence why it appears to be most significant for Martinique. Among Haitians lineage associated with the Bight of Benin might possibly be more pronounced among people with a greater degree of ancestry to be traced back to the earliest generations of locally-born Haitians. Although actually also inbetween 1750-1800 many captives from the Bight of Benin arrived.
- Bight of Biafra: a primary embarkation region for Guadeloupe. Quite striking because slave trade with this region was mostly done by the British. And in fact it seems many captives brought in to Guadeloupe from the Bight of Biaffra were also taken on British slave ships! See this query. Quite subdued in Saint Domingue / Haiti with a share of only around 5%. However this is leaving out Intra-American Slave trade by the British which may have been especially significant for the southern part of Haiti.
- Gold Coast: a minor source of enslaved Africans for the French Caribbean. Most noticeable in Martinique but only with a share smaller than 10%. In Haiti this share is even smaller than 5% which is naturally in contrast with places like Jamaica and Barbados. However again this outcome is excluding the possibility of additional imports of Gold Coast captives by way of contraband British slave trade.
- Senegambia: is rather consistent at a subdued but still considerable level of around 7-11%. French Guyane being a surprising outlier with a share of 27%! Undoubtedly additional Intra-American Slave Trade did occur whereby this sort of lineage probably got more diluted. But still a rather unique aspect which might also be corroborated in DNA testing.
- Sierra Leone & Windward Coast: quite minimal for most parts of the French Caribbean. But tellingly much more noticeable for Guadeloupe. Combined with an also atypically high share of Bight of Biafra this really underlines how Guadeloupe’s proportional breakdown of African origins looks more similar to many Anglo-Caribbean islands (especially Windward ones, see table 1.21). Prior Intra-American Slave Trade with Martinique might still have resulted in a greater pull to in particular Bight of Benin though.
- Central Africa: a very important region of provenance across the French Caribbean. But clearly peaking in Haiti (Saint Domingue)! These Central African captives arrived mostly in the second half of the 1700’s. And apparently more so in the north than in the south of Haiti. Therefore most likely causing regional substructure within Haiti’s genepool. A very useful piece of information when wanting to know about your principal African lineage as a Haitian. See also:
- Southeast Africa: only appearing with minimal percentages but still a very distinctive share of 3.6% being reported for Saint Domingue. Together with Cuba Haiti might have the greatest share of Southeast African lineage in the Caribbean. These captives arrived relatively late (1775-1800) and were usually coming from Mozambique. And a few times even from the Swahili Coast, further north. Quite singular for the Trans-Atlantic Afro-Diaspora! But rarely from Madagascar (see this query). The French involvement in Southeast Africa being well documented also because of its former colonies in the Indian Ocean: Mauritius, Réunion and the Seychelles. See also:
Caribbean (Dutch, Danish & Swedish)
- Keep in mind that these islands were heavily involved in Intra-American Slave Trade. And therefore a greater part of the African captives being mentioned in the overviews below would not have remained on the islands. Instead they would be transshipped to other destinations.
- Curacao, the main island of the Dutch Caribbean, used to be the most significant hub for re-exporting enslaved Africans into the Spanish Americas, especially the nearby mainland. This occurred in a relatively early time period as can be seen in table 1.24. Mostly in between 1650-1750. This might imply that for currentday Dutch Caribbeans their African ancestry is generally speaking dating back more generations than for other parts of the (non-Hispanic) Caribbean. And probably also when compared with Suriname (see table 1.27).
- The Danish West Indies, currently the US Virgin Islands, also greatly relied on contraband slave trade. But more so with neighbouring Caribbean islands, incl. also Puerto Rico! Rather than with the mainland. This slave trade took place mostly in the 1700’s. In fact there was also some Dutch involvement as many of the local slave owners in the Danish West Indies were Dutch. Resulting in a now extinct Dutch creole language called NegerHollands.
- The Swedish Caribbean only refers to one island: St. Barthélemy, which the Swedes ruled in between 1784-1878. After which it was returned to the French. Again most of the slave trade which took place was actually intended for neighbouring islands. The scale of this trade was relatively small and took place in a relatively late time period, mostly the early 1800’s. See also:
Table 1.24 (click to enlarge)

Follow this link for the underlying numbers. Trans-Atlantic Slave Trade Database (2020) (www.slavevoyages.org)
***
See tables 1.25 and 1.26:
- Bight of Benin is most notable for the Dutch Caribbean. Which is not surprising as Dutch slave trade with this area was at its height exactly during the time period of 1650-1750, when Curacao had its heyday as a hub for Intra-American slave trade to the Spanish Americas.
- Bight of Biafra is most notable for St. Barthélemy. Take note how Bight of Biafra is quite minimal for the Dutch Caribbean (2%). Resulting in similar proportions when compared with Bight of Benin as also seen for Brazilians and to a lesser degree Haitians.
- Gold Coast is at a strikingly high level for the Danish West Indies. More so than other parts of the Caribbean (except for Berbice/Guyana, see table 1.28). Then again the extent of Intra-American Slave Trade makes it difficult to judge how much of a local genetic impact this may have had. See also:
- Senegambia and Sierra Leone are only showing up as minimal regions of provenance for the Dutch and Danish Caribbean. Even when recent research has stated that the local Creole language of the Dutch Caribbean (Papiamento) may have been derived from an earlier Upper Guinean Portuguese Creole, similar to Cape Verdean Creole! But this took place at the very beginning of Dutch settlement in the mid 1600’s. It seems likely therefore that the genetic impact from Upper Guinea could be much smaller than its cultural legacy. See also:
- Senegambia & Sierra Leone are both showing up much more strongly for St. Barthélemy. Of course the underlying numbers are very small (<400, combined). But then again this island also still has a very small population size. Intriguingly some of the ethnic origins of enslaved Africans on St. Barthélemy have been documented and so-called “Mandingue” = Mandingo were mentioned several times! See also:
- Windward Coast and Southeast Africa are practically absent or very neglible for all. The only Southeast African slave voyage recorded for the Dutch Caribbean (voyagedID 36588) was coming from Mozambique and not Madagascar.
- Central Africa is most important for the Dutch Caribbean, representing nearly half of all slave trade! But in fact this embarkation region was also significant for the Danish West Indies and St. Barthélemy. Central Africa certainly makes for a stand-out component for Dutch Caribbeans, together with Bight of Benin. Gold Coast being somewhat less conspicuous, when wanting to compare with Suriname. Although obviously still significant with a share of around 15%.
Table 1.25 (click to enlarge)

Trans-Atlantic Slave Trade Database (2020) (www.slavevoyages.org)
***
Table 1.26 (click to enlarge)

Follow this link for greater detail, specifying numbers also for Curacao and St. Eustatius. Trans-Atlantic Slave Trade Database (2020) (www.slavevoyages.org)
***
Suriname & Guyana
- Although often not fully realized (incl. by the Dutch) Guyana used to be a Dutch colony like Suriname until the British took over in the late 1700’s. And this obviously has important consequences when considering the Slave Trade which took place during this Dutch period. The Slave Voyages database is therefore including slave imports for Berbice and Essequibo in the 1700’s under “Dutch Guianas”. As these places originally were set up as separate Dutch colonies. There are many complexities to take into account. Because actually during Dutch rule of Guyana in the 1700’s many British slave owners were present already (especially in Demerara). And (clandestine) Intra-American Slave Trade with Barbados may have been significant at that time already. Aside from Trans-Atlantic Slave Trade carried out by the Dutch. Interestingly this Barbados connection was also maintained in the 1800’s and even after Slavery ended.
- For Suriname itself it seems that Intra-American Slave Trade (carried out by the British or other slave trading nations) was never really important (see this query). However Suriname was under British occupation during the Napoleonic Wars (1799-1816). And during this period slave trade (both Trans-Atlantic and Intra-American) was carried out by the British and would have reflected their distinctive sourcing patterns. In particular a focus on the Bight of Biafra, which was a region seldomly visited by the Dutch (see this query). Except for a brief period in the 1600’s. When actually also a very intriguing Dutch Creole language developed with heavy Ijaw influences:
- Another circumstance to keep in mind while looking at the overviews shown below: Guyana received many African contract labourers after Slavery was ended! This constitutes a major difference with Suriname (despite initial overlap). Because this implies that for many Guyanese a considerable part of their African ancestors actually arrived in a relatively recent timeperiod: the mid 1800’s. All things being the same also resulting in African DNA matches with a higher average amount of shared DNA. See also:
- The Liberated Africans of Berbice, 1841-1865 (Stabroek News, 2010)
- As shown in table 1.27 below Surinamese people instead will overwhelmingly trace back their African lineage to the 1700’s. Although representing a minor share actually the slave trade which occurred in the late 1600’s and early 1700’s is still very relevant as well. Especially for a unique population group living in (eastern) Suriname the socalled Marrons or Bushinengue. Descendants of enslaved Africans taken to Suriname to work in plantations. Admirably the Surinamese Marrons fought off the Dutch already in the mid-1700’s and were able to establish their own self-sustaining communities. They retained a great part of their specific West & Central African culture. Probably more so than anywhere else in the Americas. Given their early history it seems that Dutch slave trade patterns of the late 1600’s and early 1700’s are therefore particularly significant when wanting to study their origins. See also:
***
Table 1.27 (click to enlarge)

Follow this link for the underlying numbers. Trans-Atlantic Slave Trade Database (2020) (www.slavevoyages.org)
***
Table 1.28 (click to enlarge)

Trans-Atlantic Slave Trade Database (2020) (www.slavevoyages.org)
***
Table 1.29 (click to enlarge)

Trans-Atlantic Slave Trade Database (2020) (www.slavevoyages.org)
***
See tables 1.28 and 1.29:
- Bight of Benin is showing up at a considerably high level for both Suriname and Essequibo (= part of modernday Guyana, see this map). Similar to the Dutch Caribbean but proportionally speaking somewhat less important. Probably even more relevant though for Surinamese Marrons, as this Bight of Benin slave trade occurred mostly before 1750! Going by total numbers Suriname received most of these captives. As overall speaking Dutch slave trade to Suriname was more important than to either Essequibo or Berbice. And in fact Surinamese slave imports were also greater in volume than for Demerara during the British period (see table 1.29).
- Bight of Biafra is generally subdued. Especially when compared with the Anglo-Caribbean or the USA. Which is not surprising as the British practically monopolized the slave trade with this region, atleast during the 1700’s. Most of the Bight of Biafra captives therefore probably arrived during British rule. As expected therefore this area is peaking for Demerara (=modernday Guyana). Notice how the share for Suriname is below 10%. It probably would have been even less if it not were for the brief occupation by the British from 1799-1816.
- Gold Coast is at a strikingly high level for Guyana (Berbice & Demerara) and to a lesser degree also Suriname. Certainly comparable to such levels for either Jamaica or Barbados. Dutch slave trade being focused on the Gold Coast because of their former West African head quarters at Elmina (which they held on to till 1872). Berbice standing out with the highest share (44%) is fascinating in particular because of the well known role of Akan rebels in the1763 Berbice slave uprising.
- Senegambia and Sierra Leone are only showing up as minimal regions of provenance for most parts of the Dutch Guianas. Similar to the Dutch Caribbean. Simply because the Dutch hardly had any trading activities in this area after they lost their factory in Gorée (named after a Dutch island) in Senegambia already in 1677. However Upper Guinean slave trade is more noticeable for Demerara, reflecting additional British slave trade with especially Sierra Leone.
- Windward Coast is however quite noticeable for both both Suriname & Guyana, and probably underestimated even. Unlike most other European slave traders this area was especially frequented by the Dutch in the second half of the 1700’s. However because they often combined with trading activities on the Gold Coast and Bight of Benin the actual numbers are most likely not properly reflected and often showing up under “Other Africa” instead (see this query). Either way this Windward component may constitute a distinctive part. When comparing with other parts of the Afro-Diapora this level of 10%+ could possibly be among the highest (see table 1.6). See also:
- Central Africa is showing up most strongly for Essequibo but is also most important for Suriname and significant in other parts of Guyana. In line with what was already established for the Dutch Caribbean. Also keeping in mind additional Central African contract labourers arriving in Guyana, after slavery had ended in the mid-1800’s. Interestingly not a single slave voyage departing from Southeast Africa has been recorded for either the Dutch Guianas or the British Guianas. However I suspect that through Intra-American slave trade (especially with Barbados) or also again by way of African contract labourers (at times also incl. Mozambicans) a small number of Southeast Africans might still have entered especially Guyana.
Hispanic America
Yet again a reminder that Intra-American Slave Trade is not included in the overviews shown directly below! Currently it is estimated that direct Trans-Atlantic Slave Trade may cover about 70% of all African captives being brought in to the Spanish Americas (600.0000 out of 2 million may have arrived by way of other non-Spanish colonies, see this essay). The second section of this page will provide more details about this significant (but still minor) Intra-American Slave Trade. It should also be kept in mind that clandestine and therefore usually undocumented slave trade to the Spanish Americas was also rampant. And the true extent of it may possibly never be fully recovered.
Either way a great improvement has been achieved by the addition of a large number of early Portuguese/Spanish Trans-Atlantic slave voyages destined for the Hispanic Americas (see comments for tables 1.1-1.4). Usually departing from either Upper Guinea (incl. Cape Verde) or Angola but also from São Tomé & Principe. These early slave voyages (1500’s) were mostly missing in the previous editions of the Trans-Atlantic Slave Trade database (before 2016) causing distortion of the main regional origins of Hispanic Americans when going by documented slave trade (esp. for Dominicans and Puerto Ricans). This has now however been corrected. Other slave voyages from later time periods have been added as well. All contributing to a much greater coverage of African slave trade for the Hispanic Americas as a whole.
Even when of course there are still many complicating factors to take into consideration. Too many actually to list over here. Just in summary it is always important to get acquainted with the localized context. Because despite commonalities there are also huge differences within the formerly Spanish Americas. Not surprising of course because Hispanic America comprises so many countries extending over an enormous territory. Going from Mexico in the north to Argentina in the south. One major aspect of differentiation is actual timing of slave trade. Looking closely into which time periods were associated with the greatest number of African arrivals is usually very insightful. As can be seen in the following overviews.
***
Table 1.30 (click to enlarge)
Follow this link for the underlying numbers. Trans-Atlantic Slave Trade Database (2020) (www.slavevoyages.org)
***
Table 1.31 (click to enlarge)

Follow this link for the underlying numbers. Trans-Atlantic Slave Trade Database (2020) (www.slavevoyages.org)
***
See tables 1.30 and 1.31 (do also check the underlying numbers!):
- Dominicans (=Hispaniola), Mexicans & Meso Americans (=Veracruz & New Spain), and Caribbean Colombians (=Cartagena) are likely to trace back a greater part of their African lineage to the earliest period of Trans-Atlantic Slave Trade: 1500’s -1600’s. Although because of additional Intra-American Slave Trade in the 1700’s actually especially for Colombians and also for Dominicans there might be some considerable substructure, correlating with either geography and/or degree of admixture/mestizaje.
- For Venezuelans (=Caracas), Argentinians (=Buenos Aires), Panamanians (=Portobelo), and (by proxy) Andean Latin Americans (Pacific Colombia, Ecuador, Peru and Bolivia) it seems that the middle period 1650-1750 represents the greatest inflow of African captives. Portobelo and Buenos Aires serving as transit centers for further transportation (either overland or overseas) of African captives to final destinations in either Pacific Colombia/Ecuador or the former Vice Royalty of Peru.
- Uruguay (=Montevideo), Puerto Rico and most of all Cuba experienced a greatest arrival of African captives in the 1800’s. Amazingly for Cuba even after the 1850’s (see also this overview)! However one must be careful when interpreting this data. Because again due to substructure related to either geography or levels of mestizaje it might be that substantial population segments in these countries will actually trace back their African ancestry to earlier timeperiods. Notice for example the minor but still striking 25% share of Trans-Atlantic Slave Trade occurring in the 1500’s for Puerto Rico. Self-identified “black” Cubans, Uruguayans and Puerto Ricans probably having the greatest odds of indeed tracing back most of their African ancestry to the 1800’s. Which should, other things being equal, also result in their African DNA matches showing a higher average of shared DNA. See also:
- Substructure in regional African origins according to admixture degree? (scroll down to section 2)
***
Table 1.32 (click to enlarge)

Trans-Atlantic Slave Trade Database (2020) (www.slavevoyages.org)
***
Table 1.33 (click to enlarge)

Trans-Atlantic Slave Trade Database (2020) (www.slavevoyages.org)
***
Table 1.34 (click to enlarge)

Trans-Atlantic Slave Trade Database (2020) (www.slavevoyages.org)
***
Table 1.35 (click to enlarge)

Trans-Atlantic Slave Trade Database (2020) (www.slavevoyages.org)
***
See tables 1.32-1.35 :
- Bight of Benin has a predominant share for Portobelo, which was a major transitport in Panama for re-exporting African captives into the Pacific side of South America. Very striking but Intra-American Slave Trade is also to be taken into account. The total numbers of documented slave trade for Portobelo will very likely be an underestimation either way due to clandestine slave trade. Otherwise it is only Cuba for which a considerable (>10%) share of Bight of Benin is being reported. Unlike Portobelo this slave trade was mostly carried out in the 1800’s though, after the break-up of the Yoruba kingdom of Oyo.
- Bight of Biafra is showing up with its highest share in Puerto Rico. Closely followed by Cuba and Caracas (Venezuela). And also still significant with 18% for the Dominican Republic (Hispaniola). Most likely an indicator of British slave trade. Very useful to compare with the Bight of Benin share to determine which part of Nigeria may hold the greatest ancestral significance (and not just culturally!). Also take note that for the Spanish Circum- Caribbean (mainly Mexico & Colombia) as well as Buenos Aires the shares of Bight of Biafra trade are quite subdued (<5%).
- Gold Coast as direct embarkation region is only really important for Portobelo it seems (21%). In other parts of the Hispanic Americas it is quite minimal. However again do not forget that Intra-American Slave Trade carried out by the British but probably also the Danes and the Dutch would have brought in many Gold Coast captives by way of a stop-over in the Caribbean. Inevitably resulting in a greater degree of regional diversification of African lineage than suggested by these overviews alone. This was also a main outcome of my survey of AncestryDNA results across the Afro-Diaspora in 2016. In which I found the highest degree of regional diversity for Dominicans and Puerto Ricans. See:
- Senegambia is a stand-out region of origin for the Dominican Republic, Puerto Rico, Cartagena and Mexico. A level of around 30-40% being quite exceptional for the entire Americas! This slave trade was mostly occurring in the 1500’s. And therefore at the basis of the Upper Guinean founding effect I have been blogging about since 2014! Due to additional Intra-American Slave Trade this type of lineage will have become diluted for Hispanic Caribbeans and Colombians. But probably this component has been preserved to the greatest degree (within their relatively minor African breakdown) by Mexicans and Meso-Americans. See also:
- Sierra Leone & Windward Coast are practically absent for most parts of the Hispanic Americas. Even when actually so-called “Zape” captives used to be frequently documented in Spanish records from the 1500’s/1600’s (see this page). Otherwise it is only Cuba and Puerto Rico which show a considerable amount of slave trade with this part of West Africa. However this took place mostly in the 1700’s or even 1800’s. The widely documented “Canga” captives hailing from this area.
- Central Africa is a prominent embarkation region for practically all parts of Latin America. Although curiously subdued for Portobelo (given its local “Congo” traditions). The highest level is being attained by Buenos Aires. Followed closely by Mexico and also Caracas with remarkable share of around 70%! However for Venezuela certainly Intra-American Slave Trade will have resulted in greater African diversification than suggested by these numbers which are bound to be an underestimation (see table 1.35). For Mexico an additional factor may be the relative timing of the previous Upper Guinean wave during the 1500’s versus the so-called Angolan wave which peaked in the first half of the 1600’s rather. For Argentina this Central African predominance is actually likely to be reinforced even by Intra-American slave trade with neighbouring Brazil.
- Southeast Africa is featured with an exceptionally high share of 45% for Montevideo/Uruguay! Easily the highest degree reported for anywhere in the Americas. Future genetic research into the Southeast African lineage of Uruguayans should be be very intriguing. Additional Intra-American Slave Trade still to be taken into the equation as well. However this might not tip the balance that much given that Brazilian slave traders would have been involved either way. Otherwise also notable slave trade coming in from Southeast Africa into Buenos Aires, Cuba and to a lesser degree Puerto Rico. Same as for Uruguay mostly occurring in the 1800’s. These Southeast African captives were chiefly being shipped from Mozambique. But at times also from Madagascar and even the Swahili Coast (see this query).
______________________________________________________________
2) Intra-American Slave Trade Database
Intra-American Slave Trade Database
____________________
“The Intra-American Slave Trade Database reveals the overwhelming importance and ubiquity of slave trading in the New World. It also extends the geographic coverage offered by the Transatlantic Slave Trade Database, as it adds nearly 11,000 slave voyages within the Americas stretching from Boston to Buenos Aires, and both the Atlantic and the Pacific littorals. This database offers basic demographic evidence to underlay examinations of when, where, and how African captives, and sometimes captives born in the Americas, continued their forced journeys within and across the European empires of the Americas as well as newly formed nations such as the United States and Brazil.”
____________________
One major shortcoming of the Slave Voyages website used to be that only Trans-Atlantic Slave Voyages were included. While Inter-Colonial Slave Trade between for example the West Indies and North America was not in scope. However in 2019 the website expanded with a new section featuring exactly these Inter-Colonial or rather Intra-American Slave Voyages. A very valuable addition, although naturally still a work in progress! Similar to the first section I will post a few insightful overview tables which I have myself generated from the database (in October 2020). I will not comment that much. As I am hopeful that this database will soon have new updates and greater coverage. As well as preferably a separate Estimates page, similar to the one integrated within the Trans-Atlantic Slave Voyages Database.
To be more precise this Intra-American Slave Voyages database only includes slave voyages which did not depart directly from Africa but rather from a slaveport located within the Americas. The captives would still usually be African-born.3 However they would have been on transit after their first Middle Passage. Often leaving again within a few weeks or months. So no actual “seasoning” took place in most cases. Destinations often being marginalized colonies within the British Empire without any major Trans-Atlantic Slave Trade. Or else the French Caribbean and even more so the Spanish Americas. Because of the 1494 Treaty of Tordesillas Spain was afterall dependent on other European nations for its slave trade. Initially under Asiento but right from the start also a large scale clandestine slave trade developed. Often performed by European slave traders located in the West Indies, but actually also from Brazil.
For more background details it is highly recommended to read this excellent book written by one of the main creators of this database. Also linked below a very insightful essay cowritten by him and the other main creator of this new database.
- Final Passages: The Intercolonial Slave Trade of British America, 1619-1807 (G. E. O’Malley, 2014)
- Patterns in the intercolonial slave trade across the Americas before the nineteenth century (G. E. O’Malley & A. Borucki, 2017)
Disclaimers:
(Not meant to be exhaustive and in addition to what has already been listed in section 1)
- Although of crucial importance and astounding numbers involved Intra-American Slave Trade was still minor compared to overall Trans-Atlantic Slave trade. According to estimates for the USA it could be around 15% of total slave trade (domestic slave trade excl., see this overview). While for the Spanish Americas an estimate of 30% has been made (see this essay). There might be significant variation though when zooming into specific areas, subregions etc..
- Obviously undocumented slave voyages (usually contraband) are NOT included within these overviews. Unless these voyages were intercepted or written about otherwise. This will be particularly relevant for both the French and also Spanish ruled colonies across the Americas.
- Coverage of Intra-American Slave trade carried out by the British and the Dutch is apparently quite good according to the website itself. Although still spotty for the earliest period. Brazilian Intra-American Slave Trade to Rio de la Plata is also impressively included. However “Intra-American traffic to the French Caribbean is vastly underrepresented in this database“. I imagine that also Intra-American Slave Trade carried out by the Spanish themselves is still greatly missing in the database. Especially in between the Hispanic Caribbean and the mainland. And in particular for the earliest period in the 1500’s when Cartagena and Veracruz were not yet designated as official slave ports.
- Domestic overland Slave Trade and Post Slavery migrations have resulted in a great deal of additional intermingling and diversification of African lineage. On top of what was already the result from both Trans-Atlantic and Intra-American Slave Trade combined. This is especially true for the USA and Brazil because of their continental size. But in fact also for most parts of the Caribbean and Latin America.
- Anyone who is truly interested in learning how to correctly interpret this vast amount of data should read the website’s guidance: UNDERSTANDING THE DATABASE.
Search parameters
If you start on this page and then go to “Itinerary” you can reproduce anything shown below if you select the same search parameters as I did for:
- Place of Purchase / Principal place of slave purchase = whichever Embarkation region is showing up in the rows
- Place of Landing / Principal place of slave landing = usually “Mainland North America”, “Spanish Mainland Americas”, “Caribbean” and “Brazil”. I have excluded the following regions for being irrelevant for my research purposes: “Africa”, “Europe”, “Other”
- Rows = Embarkation Regions
- Columns = Broad/Specific Disembarkation Regions
- Cells = Sum/Percent of Disembarked Slaves
______________________________________________________________
All Americas
Table 2.1 (click to enlarge)

Intra-American Slave Trade Database (2020) (www.slavevoyages.org)
***
Table 2.2 (click to enlarge)

Intra-American Slave Trade Database (2020) (www.slavevoyages.org)
***
- Overviews above are indicative of how Jamaica may have been the greatest source of Intra-American Slave Trade. However take note that Barbados, the Dutch Caribbean (mainly Curacao but also St. Eustatius) as well as Brazil were heavily involved as well. The main destinations were located in the Hispanic Americas (both mainland and Hispanic Caribbean).
USA
Table 2.3 (click to enlarge)

Intra-American Slave Trade Database (2020) (www.slavevoyages.org)
***
Table 2.4 (click to enlarge)

Intra-American Slave Trade Database (2020) (www.slavevoyages.org)
***
Just to reiterate according to estimates Intra-American Slave Trade by way of the West Indies covers about 15% of total slave trade (internationally and by sea) for the USA. For Virginia and South Carolina it was even less: around 10%. Therefore Trans Atlantic Slave trade is far more important for the USA, generally speaking. Then again for certain states this Intra-American Slave Trade was more significant than for others. And also the timing of this Intra-American Slave Trade may have resulted in disproportionate founding effects. Domestic Slave Trade however involved a greater number of people (possibly 1.2 million) than Trans-Atlantic and Intra-American Slave Trade combined (around 450,000 disembarked).
Keeping in mind the relative significance of Intra-American Slave trade very useful information can still be obtained. In particular when combined with other leads. In table 2.1 above either Barbados or Jamaica are being shown as most important supplier of enslaved Africans. For Virginia and South Carolina it is Barbados (usually also taking place in earlier time periods). However for New York, Georgia and Louisiana (=Gulf Coast) instead it is Jamaica.
Also interesting to take note of the considerable share of the Dutch Caribbean for New York (15%). Apparently this slave trade continued even after the formerly Dutch colony of New Amsterdam came under British control in 1664. The last documented slave voyage (111935) departing from Curacao arrived in New York as late as 1766! See also:
Also a distinctive share of Martinique (6.4%) and St. Domingue/Haiti (6.3%) being mentioned for Louisiana. Aside from also minor slave trade by way of the Danish West Indies otherwise it is other British ruled Caribbean islands from which Intra-American Slave Trade was coming from.
Hispanic Caribbean & Circum-Caribbean
Table 2.5 (click to enlarge)

Intra-American Slave Trade Database (2020) (www.slavevoyages.org)
***
Table 2.6 (click to enlarge)
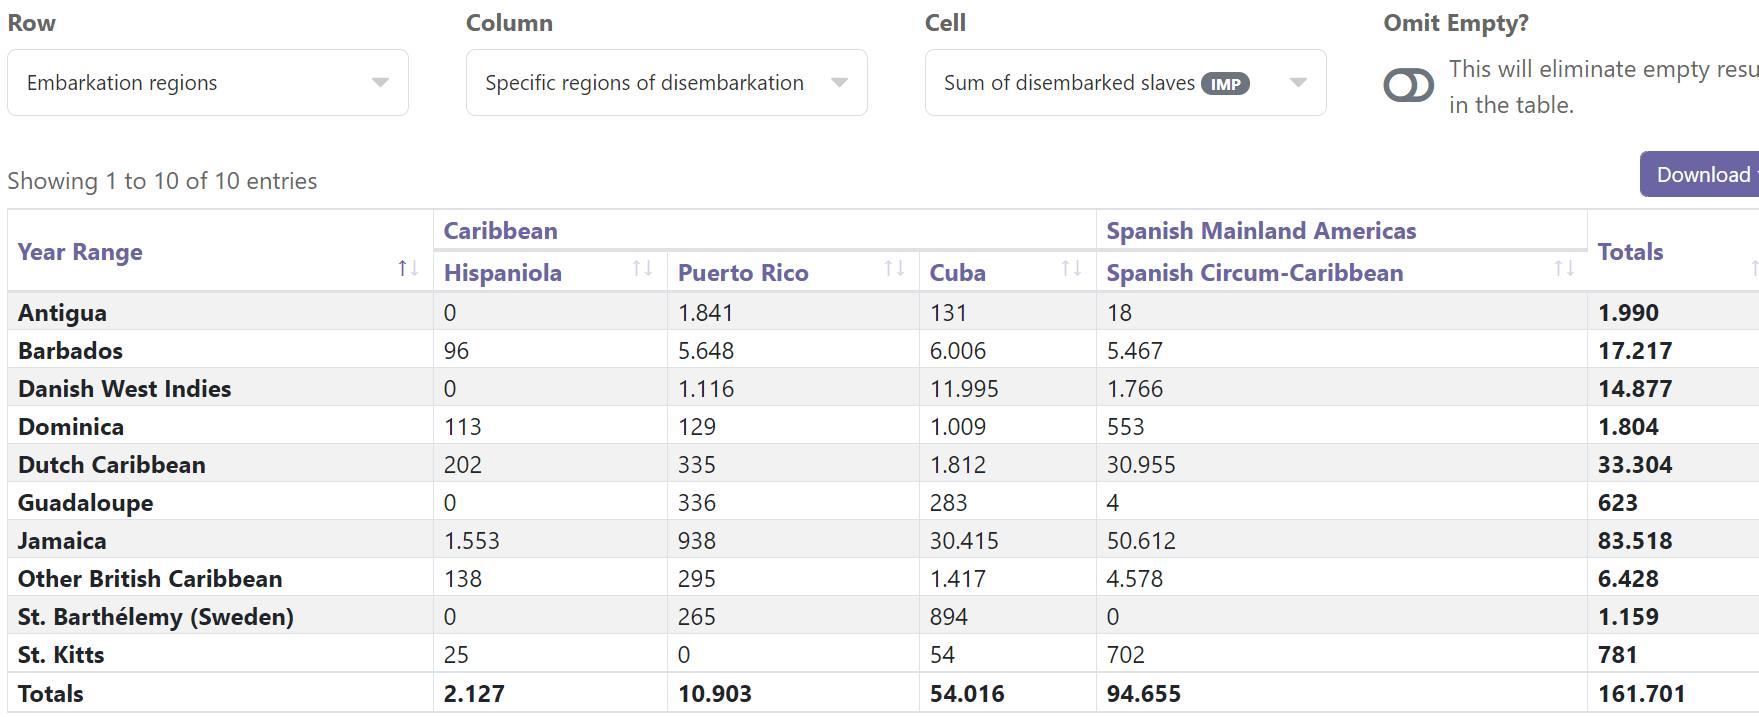
Intra-American Slave Trade Database (2020) (www.slavevoyages.org)
***
- Spanish Circum-Caribbean is mainly covering Mexico, Colombia and Panama. Hispaniola is restricted to currentday Dominican Republic.
- Again Jamaica and Barbados showing up as main sources of Intra-American slave trade. Aside from also the Dutch Caribbean (mostly for the mainland). Interestingly Barbados is most significant only for Puerto Rico. The numbers for especially Hispaniola are bound to be greatly underreported though.
Hispanic South America
Table 2.7 (click to enlarge)

Intra-American Slave Trade Database (2020) (www.slavevoyages.org)
***
Table 2.8 (click to enlarge)

Intra-American Slave Trade Database (2020) (www.slavevoyages.org)
***
- Brazil is showing up as the near exclusive supplier of Intra-American Slave Trade for neighbouring (ex-)Spanish colonies in South America. Mostly by way of Southeast Brazil but intriguingly also from Bahia (therefore also introducing Bight of Benin lineage).
- Most of the enslaved Africans coming through Rio de La Plata (Argentina/Uruguay) were actually headed for final destinations in Peru and Bolivia. Usually by overland transport but at times also first across the Andes and then continued by way of Pacific sea voyages through Chili. These terribly long slave voyages must have been among the most horrendous and convoluted to endure…
French Caribbean
Table 2.9 (click to enlarge)

Intra-American Slave Trade Database (2020) (www.slavevoyages.org)
***
Table 2.10 (click to enlarge)

Intra-American Slave Trade Database (2020) (www.slavevoyages.org)
***
- As pointed out by the researchers themselves this part of the Intra-American Slave Trade database is very much incomplete. And may not even be reasonably representative. Jamaica is shown to be the main supplier for Haiti/St. Domingue. Which is most likely true. However the slave trade carried out by Barbados as well as the Dutch Caribbean into Martinique and Guadeloupe is greatly undercounted. And probably not well refected when compared with the (later) slave trade carried out by Dominica.
- Aside from this incoming flow of Intra-American Slave Trade there was also a significant outflow of Intra-American Slave trade, mainly originating in Martinique. Destined mostly for other French-ruled Caribbean islands/colonies. However regrettably this aspect is also not yet well reflected in the current database.
___________________________________________________________________________
Notes
1) It is even stated on the website that “the data on the Iberian and Brazilian trades after 1750 is now relatively complete“. Although I imagine that contraband slave trading by Brazilians in the 1800’s still requires further research. Hopefully also new records will be uncovered detailing the earliest slave voyages disembarking in Brazil prior to the so-called Angolan wave taking place in the late 1500’s & 1600’s (see this chart for Cartagena/Colombia). Currently it seems only 5 pre-1600 Trans-Atlantic slave voyages to Brazil are included within the database.
2) For Puerto Rico for example the updated database now gives 5,698 Senegambians who disembarked out of a total of 25,557. Therefore a proportion of 22%. Which is plausible also given several studies which have highlighted how Upper Guinean DNA makes for a significant component within the African genetic heritage of Puerto Ricans (see this link for an overview). The estimates for Puerto Rican Trans-Atlantic slave trade seem to have remained unchanged however. The Estimates page still gives an unrealistically low number of Senegambian captives. Something which I remarked upon already in 2014 actually. Out of a total of 26,881 disembarked captives in Puerto Rico only 355 are estimated to be Senegambian. A share of merely 1.3%. These estimates are clearly in contradiction of the documented records which are now available in the database! Hopefully this will soon be corrected by the website.
Comparison of estimated slave trade for Puerto Rico vs databased slave trade
(click to enlarge)
***
3) Aside from African-born captives actually also Native American captives used to be numerous especially during the start of Intra-American Slave Trade. Involving Native Americans being enslaved from all over the Caribbean (both mainland and islands). And usually also put to work somewhere on the Greater Antilles: either Cuba, Hispaniola or Puerto Rico. The enslavement of tens of thousands if not hundreds of thousands of Amerindians from all around the Caribbean Basin (as far north as South Carolina and as far south as the Amazon river in Brazil, but also places like Yucatan, Honduras & Venezuela) has been plentifully documented. In fact also for the French and English Caribbean Native American slave trade has been documented. Reaching all the way north to even Canada actually! See also:
- Surviving Spanish Conquest: Indian Fight, Flight, and Cultural Transformation in Hispaniola and Puerto Rico (K.F. Anderson-Córdova, 2017)
- Indian Harvest: The Rise of the Indigenous Slave Trade and Diaspora from Española to the Circum-Caribbean, 1492-1542 (especially chapter 6)
- Mexican archaeologists identify the first Mayan slave ship to have ever been discovered (CNN, 2020)
I am not sure to what extent such slave voyages have been incorporated already within the database. Of course again this enormous project is very much a work under progress. But it would be very useful if eventually this aspect of Intra-American Slave trade will also be featured more prominently on the website. The team behind the Slave Voyages website has already announced praiseworthy plans to also cover domestic slave trade for the USA and Brazil, despite inherent difficulties:
____________________
“We certainly intend to incorporate maritime slave voyages within the United States and Brazil, whether riverine or coastwise, where such records exist. We also intend to add data on overland migrations where records exist to document “slave coffles” or other overland migrations in a format compatible with the “voyage” structure of the database. For Brazil this seems feasible, because the law required slave traders to register with authorities in Rio de Janeiro before marching inland (creating documents akin to port records), leaders of the caravans were appointed (akin to ship captains), and these forced marches tended to follow repeated routes and pass through checkpoints making them traceable.
For the domestic traffic in the nineteenth-century United States, it is less clear that systematic records will allow for the creation of such an overland voyage-based dataset.Scholars such as Michael Tadman, who have worked to quantify the U.S. domestic slave trade, have relied on different methodologies to estimate the scale of the forced migration—such as tracking changes in census data. That methodology has provided crucial insight on the U.S. traffic, but is not well suited to a database of voyages” (quote taken from “Coverage of the Intra-American Slave Trade“)
____________________
Coverage of slave trade within the Indian Ocean area should also be very beneficial! Especially for mixed Afro-descendants in South Africa and the Indian Ocean islands of Mauritius, Réunion, Seychelles etc.. In fact this is also already under preparation!
____________________
“Using the Slave Voyages model — scholars working together, sharing data — the International Institute of Social History in Amsterdam is now in talks to create a similar database examining slave trade in the Indian Ocean and maritime Asia.”
____________________
Furthermore the website also has an extremely valuable section focused on the actual identities of African captives: African Names Database. And apparently also this section will be extended in the near future! For more details watch the introductional video by Henry Louis Gates Jr. posted on the homepage of the Slave Voyages Database. Or also read this article:
- Documenting Slave Voyages (Emory University, 2019)

Nicely done! These charts do provide a good working baseline. And as you so correctly stated that the database itself doesn’t include other factors that would make it representative of the actual numbers of voyages and enslaved Africans transshipped to the Western hemisphere. Like you indicated, the French and Spanish voyages, for example, that transported their share of enslaved Africans directly to Louisiana (during the French followed by the Spanish periods) are virtually absent and would invariably increase the numbers of enslaved Africans bought to this area from the Bight of Benin. Overall, this is a great website, and I plan to visit it often. Thank you for your HARD work!
LikeLiked by 1 person
Hi my name is Isaiah-Denzel ,
My Ethnicity Estimate
Updates
Benin/Togo
35%
England, Wales & Northwestern Europe
28%Scottish Lowlands, Northern England & Northern Ireland
Cameroon, Congo, and Southern Bantu Peoples
16%
Ivory Coast/Ghana
10%
Nigeria
5%
Mali
3%
Ireland and Scotland
2%
Norway
1%
Additional Communities
Lesser Antilles African Caribbeans
From your regions: England, Wales & Northwestern Europe; Benin/Togo; Cameroon, Congo, and Southern Bantu Peoples
As far as genetic community
I came back Leeward islands African Carribean
Most of the countries that are listed does it mean it’s apart of me aka my ethnicity ?
If your ethnicity is Bajan is that listed in Leeward or No something else ?
LikeLike
Hi Isaiah,
The migration or rather genetic community tool on Ancestry can be very indicative of your background. But it is not flawless. If you carefully read the description you will learn how it is based on a clustering of your DNA matches:
https://support.ancestry.com/s/article/DNA-Genetic-Communities
https://blogs.ancestry.com/ancestry/2017/03/28/genetic-communities-beta-new-innovation-from-ancestrydna/
What do you know about your Caribbean family? From what I’ve heard many people in bigger islands like Barbados and Trinidad have parents or grandparents who actually hail from other neighbouring islands. If you go back even farther in time you will find that Inter-Caribbean migrations have always been quite significant, also during Slavery.
LikeLiked by 1 person
My mother is born in Canada but her mom which is my grandmother just died and she was from the island of Antigua it her mother was born in Antigua but originated in Monserrat. My Mom’s father is from the country of Dominica and most Dominicans come from Saint Lucia, Martinique, & Guadeloupe.
On my father’s side I don’t know much but I know for sure that my father’s father was a Carribean man & he did migrate to the states around the 1960s.
LikeLiked by 1 person
Sorry for your loss. Interesting background, quite mixed already. Given your mother’s Antigua connection you might find this blog post useful. It will give you an idea how complex it might be to entangle various family lines as it is inevitable they have intermixed across the generations. But it will also be informative of the main African lineages to expect.
https://tracingafricanroots.wordpress.com/2015/03/25/antiguas-african-origins-according-to-moravian-church-records/
LikeLike
But can you define my ethnic group please because Benin/Togo for me shows more of North-eastern Benin & West-Central & South west Nigeria then it is Togo. And it shows the areas of the tribes I come from which is Bariba, Yoruba, Nupe, & I think Igala.
But by these results can you tell me what is most likely my ethnic group ???
I did my African ancestry DNA results and it showed my paternal Y-chromosome coming from Gabon & my maternal DNA Chromesome came back Tikar from Cameroon it makes sense cuz I have Cameroon/Congo Region which for me it’s talking about Cameroon/Gabon.
My Ivory coast/Ghana shows more of the Akan regions of Ghana & the whole of the ivory coast then it is Liberia & Sierra Leone.
My 5% Nigeria shows it to be the country Niger ????
Can you explain this to me please
And my 3% Mali is showing me coming from Timbuktu.
LikeLike
I cannot tell you your ethnic group because it will be multiple ethnic groups you descend from and not just one single one. Similar to practically all Afro-descendants it will be various regions to visit when you want to go to your ancestral locations within Africa. It will almost never be just one single ancestral location let alone one single ethnic group you are descended from. As by default Afro-descendants will have multiple origins from across West & Central Africa and at times also to a minor degree Southeastern Africa.
Another thing to keep in mind is that the modernday country name labeling on Ancestry is not to be taken too literally! Rather have a look at how actual Africans are scoring when doing these tests. Also take into account the maps and regional descriptions given by Ancestry to get an idea of what your regional scores might really imply.
Having said all that I do think with correct interpretation and by combining also with your African DNA matches you can get a better indication of where most of your African ancestry may have come from. And also zoom into more specific places/ethnic groups at times.
Actually I am offering a new service which you might be interested in. Whereby I will scan and filter all of your matches on Ancestry.com in order to find your African DNA cousins! As well as giving you my best shot at correlating this info with your ethnicity estimates. For more details see:
https://tracingafricanroots.com/african-dna-matches/
LikeLike
Alright if your planning to find people’s African cousins.
When will you be able to do that ?
If your able to do it now I would really appreciate it 👍
Soooo if I have a African cousin that is Igbo, Yoruba, Akan & other ethnicities does it mean I’m mix with those ethnicities ?
LikeLike
I will start as soon as i can but sometimes things might get inbetween. I always attempt to have it done within a few weeks though. You do need to follow some instructions first which i will send you as soon as you have ordered your African DNA Matches Report.
In the report I will also give you my interpretation of what your matches may tell you about your African lineage. As a matter of principle I will take a cautious stance in order not to jump to misleading conclusions. See also the disclaimers mentioned on that page i referred to earlier. In particular:
Then again if you look at the overview of all your African DNA matches you can often detect certain matching patterns and also combine with your ethnicity results and historical evidence which can make certain types of lineage very plausible indeed!
For example for one of the persons I recently scanned African matches i found that these matches were overwhelmingly of Igbo background (judging by surname) and also the amount of shared DNA with these matches was highest when compared with her other African matches from elsewhere. Combined with her known background as well as ethnicity results a significant Igbo ancestral contribution within this person’s family tree is practically certain then. Although naturally this does not negate that she might have significant African lineage from other countries and other ethnic groups as well.
LikeLike
One last thing, in this page
Are you basically saying that if your roots are from the lesser Antilles or if your from the lesser Antilles you have come from many islands such as island migration & intercolonial slave trade ?
The islands that you mention such as Barbados, Jamaica, & Martinique is that where all the Lesser Antilles African Carribean people come from ?
And when it comes to your genetic community is it what got from your mom & Dad or is it just one parent ?
LikeLiked by 1 person
It will vary from person to person. Like i said this migration tool is meant as an indication. The best way to find out is to build up your family tree to at least the mid 1800’s. From what I’ve seen from other people from the Caribbean this can be done as the records are fairly good. It will take some effort and patience though.
LikeLiked by 1 person
According to the slave records is Antigua the only island that had a lot of Gabonese slaves ?
I’m asking because 4 slaves from Gabon were sent to trinidad.
And out of all the other islands in the Carribean it seems that Antigua is the only island that got Gabonese slaves beside Eastern Nigeria/Calabar & Cameroon.
LikeLike
You are referring to this overview right? That’s taken from the Slave Voyages database which is a more extensive source than the Trinidad slave census from 1813 you are also mentioning. Because the period being covered for Antigua is the entire slave trade period (1600’s-1800’s), while for Trinidad it is at most 50 years or so.
Eventhough the 460 captives taken from the Gabon coastline might seem significant. Relatively speaking it is still quite a minimal share of the total number of people disembarked in Antigua: 460/85,638 = 0.5%
For a proper comparison you would have to consult the Slave Voyages database for voyages which originated in Gabon and disembarked across the Caribbean. I imagine you will find that the relative share will be equally minimal for each island though. As it is known that Gabon did not play a major role in Trans-Atlantic Slave Trade. Even nowadays Gabon is still very much a thinly populated and heavily forested country. Whose inhabitants are genetically speaking very closely related to ethnic groups living across borders in neighbouring countries.
LikeLiked by 1 person
Yeah, The reason why the asked is because my father told me that his father’s lineage came from Gabon.
When I did my paternal Y Chromesome DNA test it proved that 😄👍
LikeLiked by 1 person
How would you father know this? Through oral tradition? It’s rare short of where it is rather obvious (Akans in Jamaica, for instance) the modern-day countries we descend from. It would be amazing for someone to have had a story of coming from modern-day Gabon since this isn’t a place commonly talked about when talking about the trans-Atlantic slave trade.
LikeLike
That’s true. Gabon & other mixes like Akan cuz west Indians most of the time come from Ghana.
LikeLike
All Afro-Diasporans are mixed at the end of the day !!!!
As a Afro-Carribean
I’m pretty much Gabonese, Cameroonian, Beninese, Nigerian, & Ghanaian, & Ivorian. 😄
LikeLike
Hey again !
I have a friend that is half African & half Carribean
And he wants to know how genetic communities work
His father’s father is first generation Carribean but his father is Cameroonian
On my friend’s mother side it’s just Carribean 😁
As far as genetic communities is concern
Will his only genetic community just be Afro Carribeans ?
LikeLike
Hi Dezzy, you can forward these links to your friend
https://www.ancestry.com/cs/dna-help/communities
https://www.ancestry.com/cs/dna-help/communities/whitepaper
I cannot predict his genetic community because this will be established by Ancestry based on how your friend is matching with other people. There are no separate genetic communities yet for Africans. But they do regularly get assigned to Caribbean and also African American ones due to Trans-Atlantic links.
LikeLiked by 1 person
Hey, to be honest
I want the company to put my proper community in
Cuz I researched everything
And it ties to Alabama
My community shouldn’t just point Carribean cuz one parent is Carribean the other is African American from Alabama.
👿👿👿👿👿👿
My father’s line is only 4 generations American
Is my American tie not that strong in the Ancestry database ?
LikeLike
Best to ask Ancestry’s clientservice.
LikeLike
Hey,
Is it true most of the Carribean leeward & Windward islands came from Martinique, Jamaica, & Barbados ?
LikeLike
Those islands certainly were heavily involved in Intra-American Slave Trade. That’s why it’s so great that we can now have a look for ourselves in the Intra-American Slave Trade Database to answer our questions. Although it is still a work in progress of course.
For more background details you should also read this book:
Final Passages: The Intercolonial Slave Trade of British America, 1619-1807 (G. E. O’Malley, 2014)
LikeLiked by 1 person
So basically most of the other Carribean islands came from Barbados, Jamaica, & Martinique.
LikeLike
An interesting way to explore this is by looking into your DNA matches and see how many of them might possibly indicate such Intra-Caribbean connections. Although of course there are always multiple ancestral scenario’s to consider, incl. also voluntary migrations after Slavery.
LikeLike
Fonte as always your posts are spot on and love how far you have taken your blog. Extremely impressed and thank you for sharing your findings. I actually have more results to share with your for Puerto Rico and Dominican Republic.
LikeLiked by 1 person
Hey Anna, thanks so much for this heartwarming comment! Please know that I have also held your own blog, Genealogia Nuestra, in highest regard ever since you started it! I especially love how you also take a broad Afro-Diasporan perspective.
I am actually no longer collecting Ancestry results however I did start a new survey based on 23andme results. So if you have any to share (incl. also Haitian ones) that would be very helpful! I will enter everyone’s African breakdown (which I scale to 100% to make the data inter-comparable) into this online spreadsheet:
https://docs.google.com/spreadsheets/d/1KpSzfMggWiV_9cy5ZKh1hDqSlIRbthfYkz6dvwX-Mts/edit#gid=513574259
You may be interested to know that lately I have been starting to investigate my Hispanic matches on 23andme in greater detail. Also using DNA Painter. My aim is to establish whether the shared DNA segment with my Hispanic matches (I have loads of them :-)) is either South European/Iberian or West African/Senegambian. Due to Cape Verde’s and Latin America’s racially mixed heritage and shared history (especially during the 1500’s & 1600’s) both ancestral scenario’s being valid possibilities. However due to different time frames of migrations (incl. involuntary ones) and ancestral proportions probably the odds of shared Iberian ancestry are usually greater. Still I was very pleasantly surprised today to find out one of my Puerto Rican matches seems to be sharing a DNA segment which is being classified as “Senegambian & Guinean” by 23andme!
LikeLike