
Introduction
On this page I will be posting the AncestryDNA results for people from Central and Southern Africa  with confirmed ethnic background(s). Unlike for Afro-Diasporans in the Americas these results can therefore be verified with known genealogy. This should be helpful to determine how reliable/predictive the various African AncestryDNA regions might be and also how they should be interpreted.
For other African AncestryDNA results see these pages:
- African AncestryDNA results
- Nigerian AncestryDNA results
- North & East African AncestryDNA Results
- West African AncestryDNA results (part 1)
- West African AncestryDNA results (part 2)
UPDATE 01-08-2019: this page was first published on 17 February 2017 when I had only 32 Central & Southern African AncestryDNA results available for my analysis (see this overview). As my survey has been ongoing I have managed to collect a sample group which is now three times greater. Consisting of no less than 96 AncestryDNA results of Central & Southern African persons! Additional screenshots and new group averages have been added therefore. Also a few textual changes have been made (mainly when referring to 23andme former African breakdown, see this link for original version). Furthermore I have also created a separate section for Indian Ocean Islander results (scroll down for it).
For a short recap of my final survey findings follow this link:
Please also keep in mind that AncestryDNA’s ethnicity estimates have been updated several times now! On this page I am dealing exclusively with AncestryDNA version 2 which was current between September 2013 and September 2018. All matters being discussed on this page are therefore not pertaining to updated results (Sept. 2018 up till now). In my opinion this new version 3 regrettably has been a downgrade rather than providing meaningful improvement, overall speaking. Which is why I have discontinued my AncestryDNA survey. For more details see:
- Did Ancestry kill their African breakdown? (part 1)
- Did Ancestry kill their African breakdown? (part 2)
- Did Ancestry kill their African breakdown? (part 3)
***Chart 1a (click to enlarge)

***Chart 1b (click to enlarge)

***Chart 1c (click to enlarge)

***
In my personal estimation AncestryDNA can report valuable information about your ancestral origins as long as you correctly interpret the data and are also aware of the relevant context and inherent limitations. Still these results might appear to be “off” at first look for those not accustomed to how AncestryDNA or DNA testing in general works. Therefore please keep in mind the following disclaimers (for a more detailed discussion see the AncestryDNA and AncestryDNA Regions pages):
- Don’t take the country name labeling of the regions too literally. The regional percentages firstmost signal close genetic similarity to the samples taken from the countries after which the regions have been named. Actual origins from neighbouring countries should not be ruled out.
- Almost all African countries have been colonial creations with borders cutting right through the homelands of ethnic groups. Closely related ethnic groups can often be found on both sides of the border.
- Most DNA is common in many populations, just at different frequencies. Due to either migrations or shared origins dating back from hundreds or even thousands of years. For Central & Southern Africa in particular the Bantu migrations are a factor of paramount significance.
- Sometimes (very) ancient admixture rather than any recent lineage is suggested by these AncestryDNA estimates. And in this way some of these regional scores might perhaps best be seen as genetic echoes from a (very) distant past. Beyond family tales, historical knowledge or even ethnic origin traditions.
- Ethnicity is a construct which evolves across time due to ethnogenesis. Generally speaking therefore ethnic groups do not possess unique DNA markers. Especially in comparison with neighbouring ethnic groups or from within the same wider region. The most common scenario being a genetic gradient which causes ancestral components to gradually fan out. As can be verified from chart 1 & 2.
- However by closely studying the regional combinations being reported for Central and Southern Africans we can still learn a great deal. Inspite of individual variation group averages do tend to provide more solid ground to make meaningful inferences when specifying someone’s ancestral origins. Also finding out where a specific region is most prominent or rather most subdued holds valuable lessons.

***
The above statistical data is based on a limited sample size. Although most countries are being covered now. Which should contribute to a more robust dataset when compared with my initial findings in 2017 (n=32, see this overview). A greater degree of genetic diversity and individual variation might be expected across Central & Southern Africa and also within the listed countries. After all all of these countries themselves already harbour a multitude of ethnic groups. Although many of these ethnic groups are actually closely related, genetically speaking.
Some of this diversity can already be gleaned from the more specified South African data. It can be seen that “Southeastern Bantu” peaks among South African Bantu speakers (such as Zulu, Xhosa and Swazi). With their (sub)group average being 87%. This is not well reflected in the overall South African group average (60%) because of a greater number of samples taken among South African Coloureds. They have a lower average of 52% “Southeastern Bantu”, which drags down the overall group average for South Africans. Their African breakdown has been scaled to 100% in order to enable an evenhanded comparison (same goes for results from Angola, Mozambique, Zimbabwe, Madagascar, Mauritius & Reunion and the Seychelles). The socalled “South-Central Hunter-Gatherer” region (termed “Pygmy/San” in my sheet) is often more significant for the Coloureds. But it is less prominent for Bantu speaking South Africans, even if still very detectable on average, in particular the Xhosa.
Eventhough only preliminary statements should be allowed at this stage I highly suspect that these group averages are otherwise already a reasonably good approximation of the main regional components to be found within the Central and Southern African genepool. Atleast according to AncestryDNA’s reference panel (version 2) . The group averages I have calculated being in line with how the “typical native” scores according to Ancestry’s information: respectively 92% for “Cameroon/Congo (n=115) and 72% for “Southeastern Bantu” (n=18). Especially the former region having a very robust prediction accuracy.
Judging from the screenshots shown below it appears that indeed either socalled “Cameroon/Congo” and/or “Southeastern Bantu” will be prevalent for countries in this area. Both categories will generally speaking be measuring Bantu origins for Central and Southern Africans. Just as reminder these separate categories have been combined by Ancestry after their update in September 2018 into socalled “Cameroon, Congo and Southern Bantu”. This new region also likewise measures Bantu origins and actually works pretty good for especially Central Africans (see this overview). However due to Ancestry’s new algorithm and constellation of reference populations this new region is confusingly also describing Nigerian DNA for Nigerians and Afro-descendants! See also:
It should be kept in mind that the actual amounts being reported for the socalled “Cameroon/Congo” or “Southeastern Bantu” regions are firstmost a measurement of the genetic similarity to AncestryDNA’s (limited) reference samples from either 1) Cameroon & Congo or 2) Namibia, South Africa and Kenya. An attempt is being made to pinpoint your genetic location in between these sample groups. With the regional scores functioning as coordinates if you like. However it will by default only be a rough estimate as more fitting sample groups to compare with may very well be missing. The first map below clearly shows the inevitable genetic overlap. Which is actually even greater than shown here by Ancestry. All of which to be explained by the shared regional history of the widespread Bantu migrations. Learning about the socalled Bantu Expansion is therefore essential to place these results in their proper context.
***Map 1 (click to enlarge)

Source: Ancestry.com
***Map 2 (click to enlarge)

***
In the very last section of this page I will discuss the implications these results might have for Afro-Diasporans. Generally speaking when it comes to tracing back the main strains of regional African lineage for Afro-Diasporans in the Americas undoubtedly results from Congo (DRC & RC) as well as Angola will be most relevant, given historical plausibility and cultural retention. Although also Cameroon, Mozambique, Madagascar and directly surrounding countries, such as Zambia, Gabon, Congo Brazzaville and Malawi are not to be overlooked.
I like to thank all these Central and Southern Africans for having tested on AncestryDNA and sharing their results online so that it may benefit other people as well!
The individual results behind these group averages can be viewed via this link:
______________________________________________________________________________
Central African Results
As shown in chart 2 above and also as will be seen in the screenshots below socalled “Cameroon/Congo” is the most characteristical AncestryDNA region appearing for Central Africans. Generally speaking and usually also convincingly so. However this is almost always combined with other regions showing up with smaller amounts. In particular “Southeastern Bantu” and “Nigeria”. It should be kept in mind that neither of these regions are confined to their AncestryDNA labeling. And due to the Bantu migrations originating in eastern Nigeria/Cameroon there will be genetic overlap for these three regions.
I have ranked these Central African results based on the amount of highest to lowest score for “Cameroon/Congo”. Despite the limited number of samples an insightful pattern seems to arise already:
- As expected “Cameroon/Congo” peaks among Cameroonians & Congolese
- Next in line are the samples from Equatorial Guinea, Zambia and Angola
- Even for Zimbabweans it is overall still predominant. Even when they are geographically speaking Southern Africans and not Central Africans!
This suggests a gradual dilution of the socalled “Cameroon/Congo” region when going in a southern and eastern direction. This is only natural given the current constellation of reference populations used by AncestryDNA. However – unlike mentioned by Ancestry.com itself – this region actually also appears in high amounts (>35%) in countries as far east as Kenya and as far south as Zimbabwe and Madagascar!
***
CAMEROON (Northwest Region: Foumbot)
***

Source: African Royal DNA Project
***
This insightful breakdown as well as several other results within my survey is highly indicative of how AncestryDNA has been using samples from Northwest Cameroon to determine “Cameroon/Congo” scores. Nonetheless greater variation is shown in other results. Even when not all parts of Cameroon were covered by my survey. See also the more detailed text for the results directly below.
The DNA results for this person as well as several others have been enabled by the commendable “African Royal DNA Project”. When it comes to my Cameroonian survey results I am very much indebted to this pioneering and powerful project!
Its mission:
“assist Africans in the Diaspora whose ancestors were forcefully removed from the Continent an opportunity to find their actual biological families. The project also allows the African Royals on the Continent to find out what happened to their families that were taken. “
For more details see their websites:
***
CAMEROON (Babanki a.k.a. Kedjom, Northwest Region)
***

***
These results belong to a person who also made an excellent video sharing her results. It can be seen further below in the video section or by following this link. An astonishingly high amount of “Cameroon/Congo” is being reported, practically 100% if you disregard the miniscule trace regions. A very convincing testimony of how predictive AncestryDNA’s analysis can potentially be. This outcome makes perfect sense given the Northwest Cameroon and more specificly Babanki/Kedjom background of the person behind these results. Eventhough located right next to the Nigerian border it seems people from this area do have a distinct genetic profile when compared with (southern) Nigerians. In fact it appears that the Cameroonian samples being used by Ancestry.com have been selected from among the socalled Grassland Bantu speaking people who live in this same western region of Cameroon. Which also explains the grouping with closely related Bantu speaking samples from the Congo. If you click on the “Cameroon/Congo” region while viewing your Ethnicity Estimates it is stated by Ancestry.com that:
____________________
“Although the Cameroon/Congo region is incredibly diverse, with more than 200 different ethnic groups, our genetic profile for the region is primarily represented by samples from the Cameroon Grasslands, where the largest populations are subgroups of the Bamileke and Bamum peoples”
____________________
An impression may be conveyed that this woman is a perfectly homogeneous “unicorn”. As this outcome does indeed imply that her DNA is a very near exact match to the Cameroonian samples used by Ancestry. Nevertheless this doesn’t take away from the fact that further down the line and when compared with other sets of sample groups she might actually be reported as having mixed origins (within Africa). As already suggested by her various GedMatch and DNALand results which seem to delve more into her ancient ancestral components. It must be pointed out though that these thirdparty tools have inherent flaws and without proper understanding their results can be very confusing or even misleading!
***
CAMEROON (Northwest Region: Foumbot)
***

Source: African Royal DNA Project
***
CAMEROON (Ngwo, Northwest region)
***

Source: http://www.rootstoglory.com
***
CAMEROON (Northwest Region: Foumbot)
***

Source: African Royal DNA Project
***
CAMEROON (Bamoun)
***

Source: African Royal DNA Project
***
CAMEROON (Tikar)
***

Source: African Royal DNA Project
***
CAMEROON (Bamoun & Ewondo)
***

Source: African Royal DNA Project
***
CAMEROON (Balundu/Oroko)
***

***
CAMEROON (Bamoun)
***

Source: African Royal DNA Project
***
CAMEROON (Bamoun)
***

Source: African Royal DNA Project
***
CAMEROON (Tikar)
***

Source: African Royal DNA Project
***
CAMEROON (southern/coastal + 1/4 Igbo)
***

***
This mostly Cameroonian person (she does have 1 Igbo grandparent from Nigeria) shows a higher “Nigeria” score than many actual Nigerians themselves receive when tested on AncestryDNA. The “Cameroon/Congo” % is still significant as well but less than half as big as the Nigerian amount. Also noteworthy that the Trace Regions are quite minimal, it’s basically a breakdown of only “Nigeria” and “Cameroon/Congo”. Compared with actual Nigerians who often score 3 or 4 regions above trace level. Especially the near absence of any “Benin/Togo” score seems telling. For reference see also this page:
Aside from the partial (yet overall minor) Igbo origins of this person it seems that an explanation for this remarkable outcome can be found in the Cameroonian samples being used by Ancestry.com hailing from the western part of the country while this person’s Cameroonian family is from the coastal & southern area (Buea, Akonolinga).
And apparently her DNA shows more similarity to the Nigerian samples being used by Ancestry.com rather than their Cameroonian ones, which were taken from a distinct part of the country and therefore can only represent a subset of the Cameroonian genepool. It provides a good illustration of how major genetic overlap does often occur between neighbouring countries. Also it teaches a good lesson that the ethnic diversity within any given African country cannot always be fully captured by just one single DNA category.
***
EQUATORIAL GUINEA (Fang?)
***

***
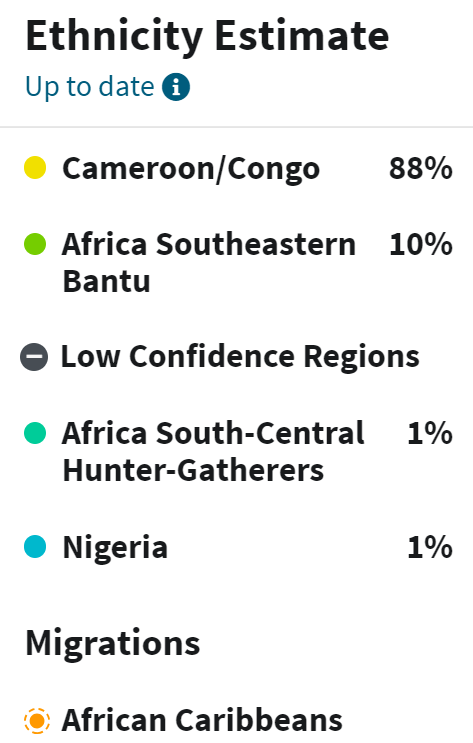
Very interesting breakdown from one of the smallest countries of Africa. Equatorial Guinea is geographically situated between Cameroon and both Congo’s (DRC & RC). The “82% “Cameroon/Congo” score is therefore appropriate and as expected. The 5% socalled “Hunter-Gatherers” amount is also in line with minor yet very detectable Pygmy admixture in the Central African rainforest zone.
I have no absolute certainty about the ethnic background but given that the Fang people are about 85% of the total population of Equatorial Guinea and this person is not from Bioko (Fernando Pó) island it is highly likely. Interestingly the Fang also live in Cameroon and are said to have migrated southwards relatively late in history (19th century). Their early history is somewhat contested but the 5% socalled “Mali” amount seems to be in support of Sahelian or northern Nigerian connections.
The appearance of 8% socalled “Southeastern Bantu” in second place is also intriguing. It goes to show that this region is in fact also being reported for West-Central Africans. For a second result from Equatorial Guinea (confirmed Fang, but alas no screenshot available) the amount for this region was even higher: 13%!
***
CONGO (DRC) (Bakongo?)
***

***
A very convincing breakdown proving that the socalled “Cameroon/Congo” region is able to accurately pinpoint both Cameroonian and Congolese origins. Among both my Cameroonian and Congolese survey-groups 98% “Cameroon/Congo” was the maximum score obtained. Obviously there has to be a close genetic similarity to the specific samples being used by AncestryDNA. Otherwise greater variation will be the outcome.
As described on the AncestryDNA Regions page, it seems likely that in addition to Cameroonian reference populations also Bakongo samples from Congo Brazzaville are being utilized by Ancestry.com for this region. The Bakongo (who also live in DRC and northern Angola) are often described as having been among the most numerous Central African captives caught up in the Trans Atlantic Slave Trade. Besides their genetic inheritance the Bakongo also left many valuable cultural legacies in various parts of the Americas. For more details on their former Kongo kingdom, see also these insightful websites.
- KONGOKING : an interdisciplinary approach to the origins of the Kongo kingdom
- Kongo Kingdom Chronological Outlining
- Kingdom of Kongo North, South America and Caribbean Diaspora (FB group)
I actually have no certainty about the ethnic background behind these test results. But based on the very high similarity to Ancestry’s samples (98%!) I suspect a Bakongo or atleast western Congolese background is very likely. Actually one grandparent might be Angolan, but again also Bakongo.
***
CONGO (DRC) (Kinshasa?)
***

***
CONGO (DRC) (Bakongo)
***

***
CONGO (DRC) (Songye/Kambelembele)
***

***
These results above are from a Congolese person whose family is from the provinces of Kasai-Oriental and Maniema. Geographically situated in the central part of the country, but actual family origins located more to the southeast (see also this map). Ethnic background can be described as Songye and Kambelembele. It is good to keep in mind that the Democractic Republic of Congo (DRC) is an incredibly diverse and HUGE country. Going by territory it is the second largest country of the continent while it also has the fourth largest population within Africa. It is estimated that the DRC is home to over 250 distinct ethnic groups (see wikipedia for more details). Despite shared commonalities it is wise therefore not to generalize
Even so, this AncestryDNA breakdown shows an impressive predominance of the socalled Cameroon/Congo region. It is admittedly only an individual result yet it still convincingly corroborates the predictiveness of the socalled “Cameroon/Congo” region. Looking at the remaining Trace Regions any minor recent Nigerian or Ghanaian ancestry would be very unlikely. These scores rather seem to reflect the difficulty of accurately delineating regional origins for a few tiny DNA segments. Remember that Trace Regions include estimates of zero %! Otherwise i suppose they might be seen as a very ancient signal of Bantu speaking migrations originating in eastern Nigeria/Cameroon. Given this person’s southeastern Congolese origins it is interesting that the “Southeastern Bantu” score seems quite subdued. Eventhough it is still present in second place. Also you might have expected a higher “South-Central Hunter Gatherer’s” percentage, as afterall the DRC is home to several Pygmy populations. As always individual variation might have played its part though in this particular outcome. Other Congolese results might very well look differently.
***
CONGO (?) (Lumbu?)
***

***
I have no certainty about the exact nationality and ethnic background of the person whose results are shown above. However given his name I highly suspect western Congolese (either DRC or Brazzaville) or perhaps Gabonese origins. Still Zambian origins might also be a possibility. Especially given the higher amount of “Southeastern Bantu” when compared with the Congolese breakdown above. The above trace level score of socalled Hunter-Gatherers (=Pygmy) also seems distinctive. However other Congolese results are needed to establish firmer patterns.
***
CONGO (RC) (Bakongo)
***

***
The Republic of Congo (RC) with capital Brazzaville tends to be lesser known among the general public than its bigger and much more populous neighbour across the Congo river: the Democratic Republic of Congo (DRC). This latter country having as capital Kinshasa (which is practically a twin city of Brazzaville!) and was formerly known as Zaire. Eventhough the DRC is much more diverse both countries share a common Bakongo heritage which is not exclusive to any of both countries and in fact also includes northern Angola. The Loango kingdom arguably being more so centered in RC’s modernday territory. Interestingly this person’s results also show a migration for “South Carolina African Americans”. Indicating he has many meaningful matches with people with deep origins from South Carolina. This aligns well with the very significant Central African ancestry of this state. See also:
***
CONGO (DRC) (Kasai: Ndundu, Bangala and Tetela)
***

***
ZAMBIA (Lozi)
***

***
Very helpful to see this fascinating breakdown from Zambia, as well as the following ones below! It demonstrates that the “Cameroon/Congo” region is also found in predominant proportions to the south of Congo (DRC). At the expense of a secondary “Southeastern Bantu” score. If you were to go by the info provided by Ancestry.com you might have expected it to be the other way around. However given the known ancestral ties between Congo and Zambia this outcome seems appropriate. Intriguingly this person is of Lozi background. With the Lozi language being said to have been brought over quite recently by Sotho people who were forced to migrate northwards due to the unrest caused by the Mfecane in South Africa in the 1800’s. However it seems this impact was mostly linguistic and not genetic, atleast when judging by this particular breakdown.
At this stage – with AncestryDNA’s pioneering analysis still being limited in its scope – it is probably too early to reach for any further conclusions. Still it might be worthwhile to speculate about any possible confirmation of connections with the locally well known Luba-Lunda empires. These were located mainly across southern Congo but historically they were also connected with and reaching into both Angola and Zambia (see this map). Especially also through the Kazembe kingdom which was more firmly situated within Zambia. Many oral traditions from Zambian ethnic groups actually specificly refer to origins from these originally southern Congolese empires! This particular breakdown might therefore be seen as being in support of these traditions or at least not contradicting them. For more references see these insightful links:
- Zambia: Migrations and state formation (1480-1890) (short but very useful overview, incl. clickable references)
- Copper, borders and nation–building” : the Katangese factor in Zambian political and economic history. (see Ch.1 (pp.16-42) for a detailed overview of precolonial history and migrations)
- Luba (Baluba) People (great source of info and many photo’s as well)
- Kingdoms of the Savanna: The Luba and Lunda Empires (introductionary essays as well as splendid pieces of art from the Metropolitan Museum NYC)
***
ZAMBIA (?)
***

***
ZAMBIA (?)
***

***
ZAMBIA (?)
***

***
ZAMBIA (?)
***

***
ZAMBIA (Nsenga)
***

***
ZAMBIA (or Angola or Congo?)
***

***
I have no certainty about the nationality of the person whose results are shown above. Based on the name I am making an assumption it might be for a Zambian person. However any of Zambia’s neighbouring countries or even beyond could also be a possibility. Comparing with the previous Zambian results the proportions of the two main regions seem quite similar. The Trace regions are however much more diverse showing a plurality of West African regions. Without any further context it would be unwise to make any more assumptions. However the 3% socalled “Hunter-Gatherer’s” amount is quite likely an indication that this person’s origins are connected to the more forested parts of Central Africa rather than its savannah zone.
***
ANGOLA (Bakongo)
***
***
Angola is probably the biggest source of African origins for Afro-descendants across the Americas (based on the Slave Voyages Database). Therefore the following results from Angola hold great relevance for Afro-Diasporans wanting to make more sense out of their own results. Most likely ethnic background and location within Angola will determine the regional proportions for each individual result. In this case it seems obvious that the predominant “Cameroon/Congo” score for the person above is correlated with her Bakongo background.
One has to keep in mind that Angola is mentioned by Ancestry.com in the regional descriptions for both “Cameroon/Congo” and “Southeastern Bantu” (see this map). Therefore genetic similarity will be detected for both Ancestry’s Congolese Bakongo samples as well as Ancestry’s Namibian samples. The Bakongo are after all also an important ethnic group located in northern Angola (see maps on this page). While Namibia is located right across the Angolan border to the south.
***
ANGOLA (?)
***

***
ANGOLA (?)
***

***
Mostly in line with the previous two results. “Cameroon/Congo” clearly predominant. But aside from “Southeastern Bantu” also “Nigeria” turns up above trace level. Most likely this is just a misreading on Ancestry’s part. The samples which form the basis of the “Cameroon/Congo” and “Southeastern Bantu” regions are apparently not always fully adequate for covering the entire genetics of Angolans (perhaps in particular non-Bakongo ones). Which is why “Nigeria” or other West African regional scores may show up as second best proxy, usually as a trace region. Also indicative of course of the ancient ancestral ties between West & Central Africa due to Bantu migrations.
***
ANGOLA (Northeast: Malanje, Lunda)
***

***
This person’s family is mostly from the northeastern part of Angola. Unfortunately I have no confirmation about her ethnic background. But it is quite interesting that the 23% “Southeastern Bantu” score is quite elevated, even when still secondary. In fact is is the highest score I have observed during my survey. It took me a while to obtain Angolan samples as they are not very common Ancestry customers. Previously I assumed that the “Southeastern Bantu” scores among Angolans would attain even higher levels. Going by the group averages (~21%) for my Angolan survey group (n=9) it is somewhat less than I had anticipated. Although actually it does get higher for mixed-race Angolans (a.k.a. mestiços), whose results can be seen below. However otherwise I have not seen an Angolan breakdown (pre-update) with “Southeastern Bantu” in first place. I suspect this may have to do with the minimal sample size as well as the particular backgrounds of my survey participants. Regrettably I have also not seen any pre-update Namibian results.
***
ANGOLA (Mestiço)
***

***
This person as well as the following ones are socalled Mestiços (people of racially mixed background). In spite of sometimes recent Portuguese lineage, this mixture usually tends to date back from several generations ago though. And many Angolan Mestiço families have a very longstanding presence in Angola. At times dating already from the 1500’s! They might be a small minority within the total Angolan population (about 2%) however their African breakdown should be in line with their fellow Angolans generally speaking. For more details see also:
It seems telling that for the results directly above and below “Southeastern Bantu” is being reported in first place. I did not come across this for other non-Mestiço Angolans. But as mentioned above this may have to do with my minimal sample size. Another (speculative!) possibility being that Ancestry’s algorithm is for some reason more inclined to pick up on “Southeastern Bantu” for people with a more complex (mixed-race) background such as Angolan Mestiço’s but also Afro-Diasporans and in particular Hispanics.
Either way it seems self-evident that a genetic similarity is being detected for both Ancestry’s Congolese Bakongo samples as well as Ancestry’s Namibian samples. The socalled “Southeastern Bantu” region is clearly being mislabeled in this case, as both Namibia and Angola are in fact Southwestern Bantu! Continued discussion in section below: “Implications for Afro-Diasporans”.
***
ANGOLA (Mestiço)
***

***
ANGOLA (Mestiço)
***

***
“Cameroon/Congo” and “Southeastern Bantu” regions are being reported in almost equal proportions for this person. Interestingly also two other regions showing up above trace level in the African breakdown. It seems not far-fetched to assume that many Angolan Mestiços may have been rather mobile across the generations. Given their longstanding history of mainly living in trading cities. Quite possibly this may have resulted in a fair degree of cosmopolitan origins as well. Including ancestral connections with Brazil, São Tomé & Principe or Cape Verde. In fact many Cape Verdean migrants to Angola have intermarried with Angolan Mestiços in the last 100 years or so. I have several DNA cousins with such a background myself. Intriguingly they always showed “Senegal” as a tell-tale marker in their African breakdown (pre-update). See also this video featuring the Ancestry results of an Angolan with 1 Cape Verdean grandparent.
Such ancestral ties beyond Angola may possibly even stretch back to Yorubaland/Benin even. After all up till the mid 1800’s the socalled Mina Coast (a.k.a. Bight of Benin) was a very significant trading post for the Portuguese. Which could perhaps offer an explanation for the relatively high “Nigeria” score of 6% for this person. On the other hand one of the previous Angolan results also showed an above trace level “Nigeria” amount. For both this may quite likely just be signalling a generic patch of ancient migrating Bantu DNA which cannot be properly identified by AncestryDNA right now due to a lacking sample database. The 4% North African score is undoubtedly related to this person’s Portuguese side. In the survey (n=25) I performed among Portuguese AncestryDNA testers it turned out that they tend to receive a socalled “Africa North” score of in between 5-10%. See also:
______________________________________________________________________________
Southern African Results
As shown in chart 2 above and also as will be seen in the screenshots below “Southeastern Bantu” is the most characteristic AncestryDNA region appearing for Southern Africans generally speaking and usually also convincingly so. However this is almost always combined with other main regions showing up and sometimes even with (nearly) equal amounts. In particular “Cameroon/Congo” and “South-Central Hunter-Gatherers”. It should be kept in mind that neither of these regions are confined to their AncestryDNA labeling. There will be genetic overlap for these three regions due to limited sampling, the Bantu migrations, as well as widespread absorption of Pygmy and Khoi-San DNA in Bantu speaking populations and actually also the other way around!
However my Zimbabwean survey group is an exception to the main patterns I found for Southern Africans! For them it is rather “Cameroon/Congo” which shows up as primary and predominant region rather than “Southeastern Bantu”. Although this latter region does reach a high level of nearly 40% on average. Perhaps this is to do with ethnic background. Most of my Zimbabwean survey participants presumably being Shona. It might also be that there is only a very slight genetic difference causing the balance to tilt in favour of “Cameroon/Congo”. Seemingly implying that Zimbabweans are genetically more related to Zambians than to South Africans. But either way an intriguing finding.
I have ranked these Southern African results based on the amount of highest to lowest score for “Southeastern Bantu”. And despite the obviously limited number of samples an insightful pattern seems to arise already:
- As expected sofar “Southeastern Bantu” peaks among South Africans, in particular Bantu speaking ones. South African Coloureds showing a higher tendency for “South-Central Hunter-Gatherers”.
- Next in line are my Mozambican and Malawi survey participants
- Zimbabweans showing the lowest level of “Southeastern Bantu” which is usually not even primary for them.
It should be kept in mind that the socalled “Southeastern Bantu” region is based on a very small number (18) of samples from no less than three countries! Not only from South Africa but also from Namibia and Kenya. Nevertheless a reasonably accurate assignment within the restricted range of 9 African AncestryDNA regions is still being obtained. But due to its very widespread coverage it does mean that actually also Northeast Africans receive high amounts of this region. For them it will undoubtedly almost always be due to genetic similarity with the Kenyan sample subset. But obviously for Southern Africans it will in almost all cases be mostly the result of genetic similarity with the South African and Namibian samples in AncestryDNA’s database.
***
SOUTH AFRICA (Zulu?)
***

***
These results belong to a woman of most likely Zulu descent (judging from the family name). Her testresults are also shown in a very insightful video. It can be seen further below in the video section or by following this link. The almost perfect score of 94% for the socalled “Southeastern Bantu” region is striking but not surprising given that Ancestry.com uses South African Bantu samples to determine their estimates. The socalled “South-Central Hunter-Gatherer’s” amount is also substantial and as expected given the absorption of Khoi-San DNA among Bantu populations across Southern Africa. Most likely this ancestral element will be more prominent for the Xhosa and especially the Coloureds from the Cape provinces. The less than 1% “Ivory Coast/Ghana” is almost certainly just noise.
***
SOUTH AFRICA (?)
***

***
SOUTH AFRICA (Swazi?)
***

***
SOUTH AFRICA (Xhosa)
***

***
These results belong to a Xhosa woman. Her testresults are also shown in an amazing video. It can be seen further below in the video section or by following this link. Based on her relatively light skin complexion she mentions that growing up she was often assumed to be mixed or Coloured. In fact even also by black South Africans! In the USA again people would question her background guessing her to be Hispanic, West Indian or even Asian mixed. However despite her “ambiguous” appearance her testresults convincingly show her to be 100% African! Which goes to demonstrate how phenotypical diversity among native Africans is often underestimated.
Given her Xhosa background it is actually not surprising that appearance-wise she shows much similarity to the Khoi-San people, not only in skintone but also in the characteristical eyeshape (often mistaken for being “Asian”). Given their close proximity in the Eastern Cape and generations of intermarriage it is known there is a considerable genetic link between the Xhosa and Khoi-San people. For example the late president Nelson Mandela, also Xhosa, was DNA tested for his parental lineages and his mt-DNA turned out to be L0, a Khoi-San marker (see this link for references). Mandela’s facial features by the way can also be said to have been markedly influenced by his partial Khoi-San origins. This connection is furthermore expressed in the typical Khoi-San click sounds which have been incorporated in the Xhosa language. In a recent DNA study (Petersen et al, 2013) this genetic contribution from the Khoi-San was estimated to have been in between 26-40% for 15 Xhosa individuals.
- Pictures of Khoi-San women
- Pictures of Nelson Mandela
- Xhosa clicks (Youtube video)
- Genetic Khoi-San contribution for 15 Xhosa (chart)
- Complex Patterns of Genomic Admixture within Southern Africa (Petersen et al., 2013) (link to paper)
The reported amount of socalled “South-Central Hunter-Gatherer’s” (13%) was perhaps a bit lower than you might expect. This region afterall serves as a standin for Khoi-San origins (atleast for South Africans). This is most likely because the socalled “Southeastern Bantu” region is incorporating some of the more ancient Khoi-San affiliations. Interestingly the same woman also uploaded her raw data into Ged-Match and received a more substantial estimation of her Khoi-San origins: 25% (on the EthioHelix calculator). This was to be expected as generally speaking the admixture analysis on Ged-Match delves more into ancient ancestral components. It must be pointed out though that this thirdparty tool has inherent flaws of its own and without proper understanding Ged-Match results can be very confusing or even misleading! For example unlike her AncestryDNA breakdown which correctly stated 100% Southern Africa this Xhosa woman is all of a sudden given a “West African” score of 30%! Eventhough on Ged-Match her Oracle estimate for 1 single population was very accurate (Xhosa), still the 2 population estimate (mixed mode) was very off with ~90% Xhosa being combined with ~10% various very unlikely West African ethnic groups (such as Mandenka and Dogon)!
***
SOUTH AFRICA (Swazi?)
***

***
SOUTH AFRICA (? + 1/8 or 1/16 Portuguese?)
***

***
A very illustrative breakdown for how many South Africans will be described by AncestryDNA, atleast on their African side. A predominant socalled “Southeastern Bantu” score combined with a secondary but still very much present socalled “South-Central Hunter-Gathers” amount. I have no certainty about the ethnic background of this person. But judging from his name a Bantu speaking background is to be expected despite the minor and surprising “Iberian Peninsula” score. Which could very well represent a single distant Portuguese familyline from either Madeira or neighbouring Mozambique or Angola.
***
SOUTH AFRICA (Coloured)
Overall the following breakdowns directly below are very diverse and practically spanning almost the entire globe safe the Americas. This is not too surprising as these results belong to South African Coloured persons. Because of their history and geographical location the Afrikaans speaking Coloureds or also Kleurlinge are probably among the most uniquely mixed peoples of the world, both racially and ethnically. See also these articles for more detail:
- Genome-wide analysis of the structure of the South African Coloured Population in the Western Cape (2010)
-
Complex Patterns of Genomic Admixture within Southern Africa (2013)
However as expected the predominant region being featured in their African breakdown is socalled “Southeastern Bantu”. Albeit combined with a notably higher average share of “South Central Hunter-Gatherers” than other South Africans. As already mentioned “Southeastern Bantu” is a very wideranging category. It could entail many different types of ethnic ancestry across a great part of Africa. It is important to always seek a proper context therefore (whenever possible). For South African Coloureds we can be pretty much sure that in this case the “Southeastern Bantu” scores will be referring to genuinely Southern African ancestry but not per se from the country of South Africa! AncestryDNA does in fact use samples from the following South African ethnic groups: Pedi, Sotho, Tswana and Zulu (see also this overview).
Still it’s most likely that in general Coloureds will not have significant South African Bantu (Xhosa, Zulu etc.) origins but rather ancestry from Mozambique and Madagascar. As these last two countries were the main sources of African slave labour for the Dutch of the Cape Colony. Interestingly for some persons also minor yet noticeable amounts of West African regions are reported. And in fact even when less common, the Dutch also brought over captives from West Africa to their Cape Colony. For more details read these insightful websites:
***

***
SOUTH AFRICA (Coloured)
***

***
SOUTH AFRICA (Coloured)
***

***
SOUTH AFRICA (Coloured)
***

***
SOUTH AFRICA (Coloured)
***

***
SOUTH AFRICA (Coloured)
***
***
SOUTH AFRICA (Coloured)
***

***
Very basic yet illustrative African breakdown featuring only the expected components in near equal proportions. The 10% socalled “Central Asia” seems a bit out of place. But it is most likely associated with the South Asian heritage for this Coloured person as well as others posted below.
***
SOUTH AFRICA (Coloured)
***

***
The “Southeastern Bantu” score shown above is still significant. However this time it is clearly the socalled “South-Central Hunter-Gatherer” region which appears as primary African region. This will also be the case for the following screenshots. For the previous persons it was usually also very much present but only as a secondary region. This is a very interesting outcome because aside from genuine Khoi-San and Pygmys no other population will probably get such high “Hunter Gatherer” %’s as the South African Coloureds. This region is actually one of the most straightforward ancestral clusters in the reference panel of AncestryDNA, strictly based on Khoi-San and Pygmy samples.1 Quotes below are taken from the Ancestry.com website:
____________________
“The Africa South-Central Hunter-Gatherers region is made up of ancient hunter-gatherer and pastoral groups who, though small in number and physical height, are considered the wellspring of human populations around the world. Increasingly, southern African Khoe-San groups and Central Africa’s Mbuti and Baka (Pygmy) groups are drawing the attention of scholars and researchers for their genetic diversity, ancient origins and unique cultural traditions.”
____________________
Most Afro-descendants in the Americas will score only very small %’s for this region. Typically below 5% and not through any documented connection with South African Coloureds. Rather one might assume it will be an ancestral component mainly inherited from Bantu speakers brought over to the Americas who already carried these markers in their own genome. More specifically it will often be an indication of Congolese/Angolan ancestry I suppose. Although intriguingly also an inheritance by way of West African ancestors may be possible! In my survey I found that many Liberians and Sierra Leoneans also score small but still detectable amounts of “Hunter-Gatherers”. In their case it may very well be suggestive of ancient ancestral connections with now extinct populations who were once distantly related to the Central African Pygmies. Which goes to show that interpreting DNA testresults can be tricky at times. But not so for South African Coloureds, for them it seems very clearcut as they are known to have very significant Khoi-San ancestry  . See also:
***
SOUTH AFRICA (Coloured)
***

***
SOUTH AFRICA (Coloured)
***

***
SOUTH AFRICA (Coloured)
***

***
SOUTH AFRICA (Coloured & St. Helena)
***

***
SOUTH AFRICA (Coloured)
***

***
MOZAMBIQUE (Mestiço)
***

***
Very useful breakdown of a Mozambican Mestiço (a.k.a. mixed-race person)! At first sight perhaps similar to the previous South African Coloured breakdowns. But at closer look you will notice distinctive differences: no “Hunter Gatherer” score; convincingly South European instead of Northwest European breakdown (“Italy/Greece”); no indication of Southeast Asian lineage (“Polynesia” and/or “Asia East”).
Mozambican Ancestry customers are rather rare which is why it was quite difficult for me to obtain any Mozambican samples for my survey. But I was able to finally include two such results. We can see a clear predominant “Southeastern Bantu” score. Scaled to 100% it is 72% (34/47). However for the other Mozambican result (from Maputo which is in the south, regrettably no screenshot) it was more balanced: 55% “Southeastern Bantu” and 45% “Cameroon/Congo”. Obviously this is a very limited number of samples to go by and more individual variation is to be expected. Probably along the lines of the Malawi results shown below.
It might also be the case that similar to Angolan Mestiços the “Southeastern Bantu” score was inflated due to this person’s racially mixed and therefore more complex background. Mozambican Mestiços are an even smaller minority than in Angola. Apparently less than 0.5% of the population. Although before independence in 1975 they might have been more numerous. Interestingly also a minor but still considerable amount of South Asian admixture is showing up. Highly indicative of Indian Ocean trading connections by way of Goan or also Gujarati merchants who settled in Mozambique. I suppose such a feature, when also widespread among other Mozambican Mestiços, might serve to differentiate them from Angolan Mestiços who will usually lack this extra ancestral component. See also:
- Ethnic groups of Mozambique (Wikipedia)
- Indians in Mozambique (Wikipedia)
- DNA matches reported by MyHeritage for a Mozambican (upcoming blog post)
***
MALAWI (Neno & Lusangazi)
***

***
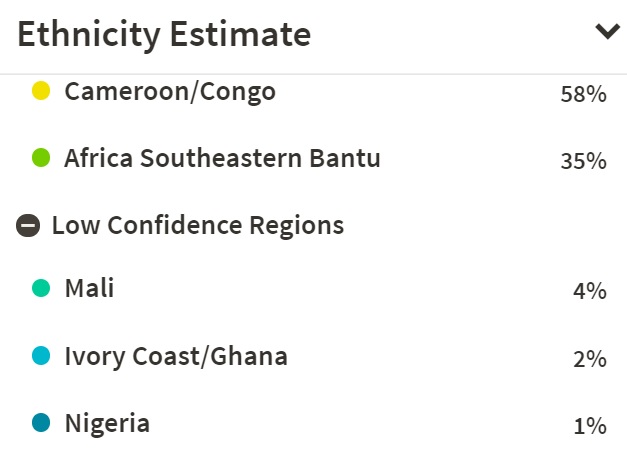
Intriguing results from Malawi. A country which is bordering northern Mozambique. The number of results (n=3) is minimal of course but still noteworthy that their group average shows a higher “Southeastern Bantu” level than my Zimbabwean survey group. The migration history of the various groups into Malawi seems to be reflected by the relative balance of “Cameroon/Congo” versus “Southeastern Bantu”. With the rather pronounced “Nigeria” score in the screenshot above most likely a misreading on Ancestry’s part due to genetic similarity caused by Bantu migrations originating in the Nigeria/Cameroon borderland.
Many people may not be aware of the relatively recent (within last 500 years) movement of people from either the north (modernday DRC Congo due to the Maravi kingdom) and also the south (modernday South Africa due to the Mfecane set in motion by Zulu king Shaka). The involvement of Malawi in Indian Ocean Slave Trade is also not always known among the general public. Hence why these results will also be relevant for Afro-Diasporans. See this page for more details:
***
MALAWI (1/2 Ngoni, 1/4 Yao & 1/4 Ngonde)
***
***
Very educational to compare these results with the ones directly below. As the difference in primary scores for either “Southeastern Bantu” or “Cameroon/Congo” seems to be strongly correlated with their actual ethnic background. For a highly insightful discussion with the person who provided these results follow the link below:
MALAWI (1/2 Chewa & 1/2 Yao)
***

***
ZIMBABWE (Shona?)
***

***
Somewhat counter intuitive but still useful results from Zimbabwe. Demonstrating that “Cameroon/Congo” is reported in high amounts (even primary) also for Southern Africans. Out of 9 Zimbabwean survey participants in fact 8 showed “Cameroon/Congo” as biggest region and “Southeastern Bantu” only as secondary region. Against what you might expect based on the labeling of these regions. Once again illustrating my oft repeated note of caution that the labeling of ancestral categories should not be taken as gospel. Of course given that both these main regions are associated with Bantu origins the breakdowns still ultimately make sense.
Even more so when you also take into account more recent migrations (last 500 years or so) coming from either the north (modernday DRC Congo) or the south (modernday South Africa). More or less same dynamics might be at work as already described above for the Malawi results. Whereby the migration history of the various groups into Zimbabwe seems to be reflected by the relative balance of “Cameroon/Congo” versus “Southeastern Bantu”.
Regrettably it seems my survey participants were practically all of Shona background. It would have been very illuminating to have included more Ndbele results (in particular from the Abezansi clan). As the latter group have more recent ancestral ties with South Africa due to the Mfecane. While the Shona might be more shifted to the north due to their ancestral connections with the famous Mutapa kingdom. Then again language adaption and cultural assimilation instead of genetic inheritance does complicate things. For a very enlightening discussion on this theme:
***
ZIMBABWE (Shona?)
***

***
ZIMBABWE (Shona?)
***
***
ZIMBABWE (Shona?)
***

***
ZIMBABWE (Shona?)
***

***
ZIMBABWE (Shona? & 1 English g. grandparent?)
***

***
The only Zimbabwean breakdown showing “Southeastern Bantu” in first place in my survey. Another fascinating aspect is the European score of 10% which goes very well with one quite likely great grandparent from England for this person. An expected DNA contribution would be around 12,5% (due to recombination it will however not be exact). Eventhough 3 European regions are being shown most likely this part of his DNA was inherited solely from one recent ancestor.
***
1/2 ZIMBABWE & 1/2 SOUTH AFRICA
***

***
Again “Southeastern Bantu” in first place, but quite telling that this person actually has one South African parent! In this way, comparing with my other fully Zimbabwean survey participants, the breakdown does make sense.
***
1/2 ZIMBABWE & 1/2 SOUTH AFRICA (1/4 Shona? & SA Coloured)
***

***
Yet again the predominant “Southeastern Bantu” score is to be explained by the partial South African background of this person. In fact also his pronounced “Hunter-Gatherer” and Asian scores are already highly indicative of his SA Coloured background. A small minority of them having migrated to Zimbabwe in previous generations.
______________________________________________________________________________
Indian Ocean Islander Results
I have decided to group these results together as the Indian Ocean Islanders form a distinctive cluster when compared with mainland Central & Southern Africans. Despite shared Bantu lineage with Central & Southern Africans their overall ancestral make-up is more complex. Due to additional Asian, Middle Eastern and even European admixture among Malagasy, Comorians and Creoles from Mauritius, Reunion and the Seychelles. Although arguably showing great similarity with likewise mixed-race South African Coloureds, Mestiços from Mozambique and Swahili. Their ancestral history has been greatly impacted by Indian Ocean Slave Trade which I intend to discuss in upcoming blog posts.
As shown in chart 2 above and also as will be seen in the screenshots below “Southeastern Bantu” is the most characteristic AncestryDNA region appearing for Indian Ocean Islanders. Generally speaking, but not always! Other regions are showing up with significant (above trace level) amounts as well. At times in balanced proportions or even as primary region. In particular “Cameroon/Congo” and to a lesser degree “Nigeria”. It should be kept in mind that neither of these regions are confined to their AncestryDNA labeling. And due to the Bantu migrations originating in eastern Nigeria/Cameroon there will be genetic overlap for these three regions.
I have ranked these Indian Ocean Islander results based on the amount of highest to lowest score for “Southeastern Bantu”. Despite the limited number of samples an insightful pattern seems to arise already:
- As expected “Southeastern Bantu” peaks among Malagasy & Comorians (although “Cameroon/Congo” is also significant for them)
- The African breakdown for Indian Ocean Islander Creoles shows more variation (also including West African regions), but still is mainly a combination of expected “Southeastern Bantu” as well as “Cameroon/Congo”
***
MADAGASCAR (Merina?)
***

***
Madagascar is increasingly being discovered as a potential place of origin by African Americans who have taken a DNA test (most recently for 2 guests on this Finding Your Roots episode). Even if in almost all cases it will be a much diluted family lineage, Madagascar ancestry still seems to be surprisingly widely dispersed within the African American genepool. A crucial factor facilitating the identification of any possible Madagascar connection is the unique genetic blend of Southeast Asian and Southeast African origins, found throughout this island’s population. Something which can also be verified from the breakdown seen above. Because of a lack of a separate Southeast Asian region (23andme does have one!) it is actually a combination of “Asia East” and “Polynesia” which serves as a proxy on AncestryDNA (version 2) to capture this ancestral component. See also:
The inheritance of any Southeast Asian markers (either autosomal or haplogroups) among Madagascar descendants in the Americas is an invaluable help for establishing any ancestral link. The inhabitants of Madagascar, also known as the Malagasy, are however not a homogeneously mixed group but rather consisting of many diverse ethnic (sub)groups. Undoubtedly they will therefore show much individual variation themselves in their admixture compositions.
The person above is most likely a Merina, the biggest ethnic (sub)group on Madagascar. They live in the highland interior and are known to have higher than average Southeast Asian ancestry when compared with coastal Malagasy (see this recent paper). Although my sample size is minimal it is noteworthy that sofar it has been mostly Merina individuals who show “Southeastern Bantu” as primary African region. As can be seen in the following screenshots Malagasy with higher total amounts of African DNA might more often score “Cameroon/Congo” as primary region. Although again these are in the first place only a few individual results. More research needs to be done but *possibly* it might correlate with different waves of incoming African migrants (both voluntary and involuntary). The Merina presumably being the descendants of Austronesian settlers who intermixed with some of the earlier waves of mainland African migrants.
Follow these links if you want to learn more about any possible Madagascar connection:
- Mapping Memories of Madagascar
- Malagasy Roots DNA Project
- How Did My Enslaved Kin Get to Va. From Madagascar?
- Part I: The DNA Trail from Madagascar to Manhattan (Radiant Roots & Boricua Branches)
- Part II: The DNA Trail from Madagascar to Manhattan & Our Family’s Malagasy Roots (Radiant Roots & Boricua Branches)
- Part III: The DNA Trail from Madagascar to Virginia (Radiant Roots & Boricua Branches)
- Got Roots in Madagascar? (Roots Revealed)
- Southeast African Maps (additional links and some background info as well)
***
MADAGASCAR (Northeast: Antankarana, 1/4 Antaimoro, 1/4 Makoa)
***

***
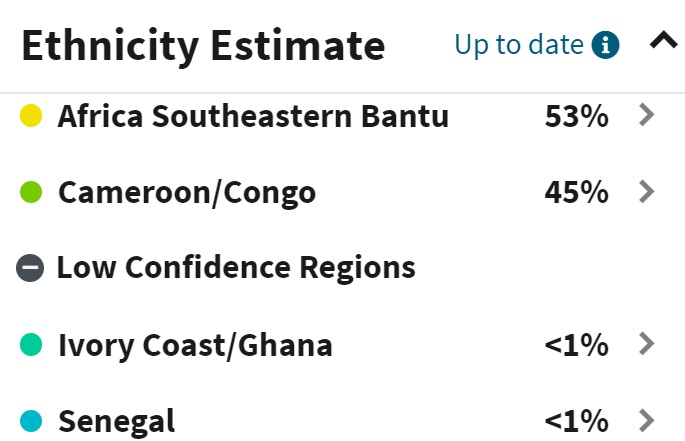
A striking breakdown is shown above which highlights the diversity among various Malagasy subgroups. Contrasting with the previous screenshot, presumably belonging to a Merina individual. As can been seen in the higher total African amount but also in particular the reversed ranking of “Cameroon/Congo” and “Southeastern Bantu”. The former region clearly being predominant now!
For this person I have actually received detailed confirmation about his background. His family being from the northeastern coastal area of Madagascar. And very interestingly also including one Makoa, a.k.a Masombika grandparent. Both terms referring to Mozambican Makuas who arrived in great numbers as enslaved captives in the late 1800’s in Madagascar. Not always actually being ethnically Makua individuals, as it was more used as an umbrella term. But obviously related to the inflow of Mozambican captives also in neighbouring Indian Ocean islands of Mauritius, Réunion and Seychelles. This internal Indian Ocean slave trade circuit is often not known about among the general public in the West. While it can still be a sensitive topic for Malagasy themselves. Quite likely this particular background may account for the more pronounced “Cameroon/Congo” score as well as overall higher total African score for this person. See also:
***
MADAGASCAR (Southwest: Toliara)
***

***
The person above is from the Toliara province which is located on the southwestern coast of the island. Again a more pronounced total African score than the first presumably Merina screenshot, shown above. Aside from the negligible Trace regions basically this breakdown is showing a combination of “Southeastern Bantu” and “Cameroon/Congo”. Rather than just “Southeastern Bantu” as might have been expected! “Cameroon/Congo” even shows the higher amount of the two. Similar to the previous result. It suggests that Bantu speaking origins are not always going to fit in neatly in just one single category.
Unfortunately this rather complicates how the socalled “Southeastern Bantu” scores across the Afro-Diaspora should be interpreted as well. As this individual example demonstrates you cannot assume “Southeastern Bantu” will refer exclusively to Malagasy’s African side. According to Ancestry’s website this socalled “Southeastern Bantu” region can be referring to origins from a VERY large area, stretching all the way north up to the Horn of Africa and southwards into South Africa. To the east it indeed includes Madagascar but again according to Ancestry’s own info it might also capture ancestral connections with Angola to the west. Despite the labeling (which should always be assessed critically on any DNA test) I actually think for most Afro-Diasporans it’s also likely to describe South*western* Bantu origins😉, in particular from Angola. Afterall the captives taken from that country far outnumber the ones taken from Madagascar, for practically all the Americas, incl. the USA. For more discussion see also the “Implications” section further below.
***
COMOROS
***

***
Very interesting breakdown for this Comorian Islander. Unlike Mauritius, Réunion and the Seychelles the Comoros islands were already inhabited before the arrival of European traders/settlers from the 1500’s onwards. Their population consisting principally of Swahili speaking but also a minority of Malagasy speaking people. The latter apparently being concentrated especially on Mayotte island. I have no certainty which island this person is from but a minor but very clearly detectable Southeast Asian as well as South Asian component is also visible for her. Aside from some minor West Asian, but tellingly no European admixture. Otherwise this breakdown is quite affirmative of Southeast & Central African lineage, as expected. See also:
- The Comoros Show the Earliest Austronesian Gene Flow into the Swahili Corridor (2018)
- Genetic diversity on the Comoros Islands shows early seafaring as major determinant of human biocultural evolution in the Western Indian Ocean (2011)
***
SEYCHELLES (Creole)
***
***
Heavily mixed overall speaking but still an unmistakable Southern & Central African imprint on the African breakdown. The Seychelles having a quite similar history as the socalled Mascarene islands: Mauritius and Réunion, due to initial French colonization.
- Slavery In the Seychelles (Wikipedia)
***
SEYCHELLES (Creole)
***

***
SEYCHELLES & SOUTH AFRICA (Zulu)
***

***
This person has one Zulu parent from South Africa and one Seychelles parent. Quite uncommon mix I imagine! But still compatible with the breakdown shown above. The results seem to suggest that the Seychelles parent of this person might also have been 100% African. Which in turn might imply rather recent mainland African origins, aside from the Zulu side obviously. Also interesting to see the minor but still quite noticeable “Benin/Togo” score. It being known that West African enslaved persons would at times also be imported during the 1700’s into the then French ruled Indian Ocean islands of the Seychelles, Mauritus and Réunion, even when being a minority overall speaking. See also:
- Ending the history of silence: reconstructing European Slave trading in the Indian Ocean (2017)
- The Seychelles in the Mascarene Slave Trade, 1770-1830. (2018)
***
RÉUNION (Creole)
***

***
Interestingly both of my Réunion samples show “Cameroon/Congo” as primary region instead of “Southeastern Bantu”. But this might be just due to minimal sample size. Either way a predominant Central & Southern African ancestral heritage is reflected, in line with historical documentation and geographical location. Given the implied Southeast Asian scores (“Asia East” and “Polynesia”) also Malagasy lineage is very likely included. Réunion having pretty much the same African origins as Mauritius. Even when French colonial rule was continued on Réunion but not so on Mauritius after the Napoleonic wars of the early 1800’s. See also:
***
RÉUNION (Creole)
***

***
This person’s test results are also shown in a great Youtube video. It can be seen further below in the video section or by following these links (in French).
***
MAURITIUS (Creole)
***

***
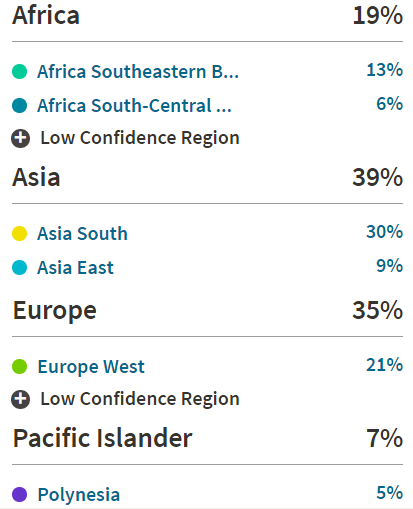
Mauritius is an island which lies rather remotely in the Indian Ocean but not that far away from Madagascar. It was uninhabited before the arrival of Europeans. Nowadays it is one of the most ethno-racially diverse countries in the world. A reflection of this globally encompassing heritage can be seen in the results above which show a fusion of African, Asian and European origins. The socalled Pacific Islander regions very likely to be associated rather with both South Asian and Southeast Asian ancestry (by way of Madagascar). I will just comment on the African breakdown which shows a remarkable concentration of “Southeastern Bantu”.
The African origins of the Creole population of Mauritius are fairly well documented and very fascinating. As you may expect from its geographical position most African captives brought over to work on the sugar plantations of Mauritius were from Southeastern Africa, and more specifically Mozambique and Madagascar. Even though this person had a minor amount of African it is clearly the “Southeastern Bantu” fraction which is predominant (21/33=63%). Seemingly confirming the predictive accuracy of this region, at least in this particular case.
Another remarkable aspect of the African composition is however the 9% “Ivory Coast/Ghana”, which is above trace level. Even with Mauritius being all across the other side of the continent it is still known and documented that also many West African captives were brought to Mauritius by the French, from Ghana and Benin but even from Senegal. This outcome is therefore a corroboration of how even the African side of Mauritians can be quite diverse already within itself!
***
MAURITIUS/RODRIGUES (Creole) (father)
***

***
Highly educational results for one person from Rodrigues island (which forms an autonomous part of Mauritius) and both of his parents (shown first). I am guessing that the African origins of Rodrigues island would, generally speaking, be in line with those of Mauritius and Réunion. However due to founding effects and genetic drift I suppose some differentiation might also have taken place. Accounting for the rather eccentric primary reporting of “Nigeria” in the African breakdown for two of these Rodrigues results. Even when some of the seemingly West African scores might indeed be genuine it might still be true also that some misassignment has taken place on Ancestry’s part. Random recombination among close family members often being exaggerated in AncestryDNA’s version 2. Will be very interesting to see the arising patterns with greater sample size.
***
MAURITIUS/RODRIGUES (Creole) (mother)
***
***
MAURITIUS/RODRIGUES (Creole) (child)
***

______________________________________________________________________________
Youtube Videos
***
CAMEROON (Babanki a.k.a. Kedjom, Northwest Region)
***
***
CONGO (RC)
***
***
1/2 CONGO (DRC) & 1/2 Canadian
***
***
CONGO (DRC)
***
***
ANGOLA (1/4 Cape Verdean)
***
***
SOUTH AFRICA (Xhosa)
***
***
SOUTH AFRICA (Zulu)
***
***
SOUTH AFRICA (Afrikaner, 2% “Benin/Togo”)
***
***
MADAGASCAR (Merina?)
***
***
RÉUNION (Créole)
***
***
______________________________________________________________________________
Implications for Afro-Diasporans:
1) Congolese & Angolan ancestry more likely than Cameroonian ancestry?
***(click to enlarge)

***
A very insightful selection of Central & Southern African AncestryDNA results has been shown on this page. Even if still quite limited in number and scope. In particular analyzing results from the Congo as well as Angola will be most relevant when it comes to tracing back the regional African lineage of Afro-Diasporans in the Americas. Followed with some distance by Mozambique. Given that an overwhelming majority of enslaved Central & Southeastern Africans was shipped through and also hailing from these 3 countries. Furthermore the cultural retention from these countries among the Afro-Diaspora is pivotal and undeniable.
There is a high likelihood that generally speaking Angola & Congo will be the chief source for any socalled “Cameroon/Congo” reported for Afro-Diasporans (at least Trans Atlantic ones). While quite likely Angola and Mozambique will be the chief source for any socalled “Southeastern Bantu”. On the other hand of course also their directly neighbouring countries are bound to have ancestral significance for the Atlantic Afro-Diaspora, even if to a (much) lesser degree. Afterall only a few centuries ago their territories would just have been a continuous part of a borderless hinterland for slave trading routes to the coast. These countries being Equatorial Guinea, Gabon, Congo Brazzaville, Zambia, Zimbabwe, Malawi and Madagascar. For more background information on these countries see:
- Central Africa (maps & ethnohistorical info)
- Southeast Africa (maps & ethnohistorical info)
- From beyond the Kwango – Tracing the Linguistic Origins of Slaves Leaving Angola, 1811-1848 (very insightful and recent research. See especially the chart at the end of the article).
Slave trade estimates, combined for all destinations in the Americas
***Map 3 (click to enlarge)

Trans-Atlantic Slave Trade Database (2010) (http://www.slavevoyages.org/)
***
Slave trade from 4 Bight of Biafra slave ports located in or near Cameroon compared with 4 slave ports located near the Congo river (a subselection)
***Chart 3 (click to enlarge)

Trans-Atlantic Slave Trade Database (2016) (http://www.slavevoyages.org/)
***
Slave trade from Cameroon compared with other Bight of Biafra slave ports
***Chart 4 (click to enlarge)

Source: “Rejoinder – The Significance of Igbo in the Bight of Biafra Slave-Trade- A Rejoinder to Northrup’s Myth Igbo ” (D.B. Chambers, 2002)
***
____________________
“It now appears that from 1751 to 1840, about 62,000 captives left from the Cameroons River and Bimbia for the Americas, with possibly a few hundred more taken to the islands in the Bight. This was between 5 and 6 per cent of the total carried off from the Bight of Biafra in this period and, of course, a much smaller share again of the total traffic.” (Characteristics of captives leaving the Cameroons for the Americas, 1822-37, 2002, p.194)
____________________
It is well advised to remain cautious when exploring any genuine ancestral ties with Cameroon despite the country name labeling being applied by AncestryDNA. Historically speaking it is known that the participation of ethnic groups from Cameroon in the Trans Atlantic Slave Trade was relatively quite minimal. According to estimates only about 5% of all the people being carried off from the Bight of Biafra (= eastern Nigeria + Cameroon). Although the true share might be somewhat obscured due to the fact that mainly slave ports nowadays located in eastern Nigeria were being used (such as Calabar). Rather than slave ports located on the Cameroonian coast (such as Bimbia) which was the least frequented part of the Bight of Biafra together with Gabon. Still even for (old) Calabar which is closest to the Cameroon border it is assumed that Igbo captives made up a clear majority and not people of modernday Cameroonian origin. As can be verified from charts 3 & 4 shown above. Furthermore (West-)Central African slave ports all combined are known to have exported even greater numbers than the most frequented ports (incl. Bonny) of Bight of Biafra (chart 3 only showing a subselection) as can be seen in map 3.
On the other hand it also seems quite conceivable that the genetic importance of Cameroon in DNA testing for Diasporans has been overstated because of a relative abundance of Cameroonian samples to be matched with (both uniparentally and in autosomal testing such as AncestryDNA). While other samples from especially non-Igbo groups within southeastern Nigeria but also from the Congo and Angola are relatively lacking. I will eventually do a follow-up blogpost on this topic.
We have to keep in mind that samples from two very diverse countries, Cameroon & Congo, have been joined together in one single region named “Cameroon/Congo” on AncestryDNA. By the manner it has been designed this socalled “Cameroon/Congo” region is most unfortunately describing ancestral connections to both Central Africa and the Bight of Biafra hinterland. As we can verify from actual Cameroonian and Congolese results shown on this page, this socalled “Cameroon/Congo” region does indeed have a high prediction accuracy for both countries. However in addition it also describes (Bantu) origins from other countries such as Angola, Zambia and even Madagascar! In theory therefore any of these places and also a combination of them might qualify as being the ancestral source for a socalled “Cameroon/Congo” score being reported for an Afro-Diasporan.
To complicate things even further also southeastern Nigerians tend to score substantial amounts for this region. Although on average the “Nigeria” region will still be primary for them. For 11 Igbo results in my survey (see this sheet for an overview) i have found a group average of almost 15% “Cameroon/Congo” and a maximum score of 34%. While for 1 single person from Cross River State (possibly Efik) “Cameroon/Congo” was as high as 35%, impressive but again still secondary. This might imply that a substantial degree of Igbo or related southeastern Nigerian ancestry would not only result in “Nigeria” amounts being inherited. But in addition could also have resulted in inherited DNA markers nowadays being described as “Cameroon/Congo” by AncestryDNA. Although given that sofar this region is only secondary for eastern Nigerians i would personally refrain from making such an assumption when the test results of an Afro-Diasporan show “Cameroon/Congo” in first place or with an amount >15%. A Central African explanation than seems to be most plausible. Even when a Cameroonian ancestral option might still also be taken into consideration when other supporting evidence exist (in particular DNA matches). For further reference see also:
- Nigerian AncestryDNA results
- Another Transatlantic Slave Port Uncovered. Dr Lisa Aubrey on Bimbia
- The Transatlantic Slave Trade and the Cameroon Historic Diaspora
- Map of Bight of Biafra Slave Ports
- Ethnic Origins of Recaptives from Bight of Biafra, c. 1850
Slave trade from Bight of Biafra versus Slave trade from Central Africa (numbers)
***Chart 5 (click to enlarge)

Trans-Atlantic Slave Trade Database (2016) (http://www.slavevoyages.org/) (Hispaniola=Dominican Republic; Saint Domingue=Haiti; Spanish Circum-Carribean is Colombia, Venezuela, Central America & Mexico).
***
Slave trade from Bight of Biafra versus Slave trade from Central Africa (%)
***Chart 6 (click to enlarge)

Trans-Atlantic Slave Trade Database (2016) (http://www.slavevoyages.org/) (Hispaniola=Dominican Republic; Saint Domingue=Haiti; Spanish Circum-Carribean is Colombia, Venezuela, Central America & Mexico).
***
Seeking a proper context is always essential when trying to interpret your own personal “Cameroon/Congo” test results. Not only your unique family history will matter in this regard but also your nationality or even your provincial/regional origins within your home country. In order to provide more solid ground to determine the plausibility of various ancestral scenarios i have performed a search in the invaluable Slave Voyages Database. It should be pointed out though that only Trans Atlantic data is being included and not Inter-Colonial data so these charts are not intended to reflect the full picture. Especially English contraband slave trading was very significant for Latin America and to a lesser degree also Haiti. While for the USA especially Domestic Slave Trade from the Upper South looms large. For all countries obviously also Post-Slavery migrations should be taken into consideration (for more disclaimers see this page).
As can be seen in the above screenshots the relative importance of either Bight of Biafra (incl. Cameroon but only to a minor degree) or West Central Africa (mainly Congo & Angola) varies a lot for each particular destination within the Americas. And just to reiterate a credible Cameroon proportion of the total Bight of Biafra numbers has been estimated to be no more than 5%. Taking a less conservative stance this estimate might perhaps be increased to 10-15% but either way it will only be a minor share. As most historians believe that the Igbo’s formed a majority or atleast a plurality among Bight of Biafra captives. Hence it seems reasonable to assume that a Bight of Biafra connection will be described by AncestryDNA, primarily by reporting a hefty “Nigeria” score and quite likely also some minor “Benin/Togo” in addition to secondary “Cameroon/Congo” amounts.
Reviewing the charts above it seems generally speaking that only for Virginia and Jamaica a good case might be made to suspect an increased probability of genuine origins from Cameroon or southeastern Nigeria based on a socalled “Cameroon/Congo” score. In this light the socalled Moco or Moko people from the Anglo-Carribean Slave registers seem especially research worthy. This was a commonly used ethnic label to refer to captives from the borderlands of Nigeria/Cameroon. Often thought to refer to either the Efik or Ibibio but quite likely also including other ethnic groups. Also Puerto Rico and Cuba show quite balanced Biafra versus Central Africa proportions. And in fact there is also plentiful evidence of southeastern Nigerian (“Carabali”) and even Cameroonian presence in the Hispanic Caribbean.
In sharp contrast with the Virginia data it seems that generally speaking for South Carolina primarily Central African origins will be implied by “Cameroon/Congo”. And this goes even more so for Brazil and other parts of mainland Latin America. Interestingly Bahia does show a slight inclination to Bight of Biafra though compared with Southeast Brazil (Rio & Minas Gerais). The numbers for Haiti might be a bit skewed because a substantial Igbo/Biafran presence has been historically attested in slave registers as well as cultural retention. Still again a Central African interpretation for the socalled “Cameroon/Congo” region also seems unquestionable for Haitians in most cases. The Dominican case perhaps being most undecided because of the large degree of undocumented slave trade. To be sure the Central African documented presence is overwhelming and ubiquitous for practically all parts of the Americas, and in fact also for Jamaica and Virginia. For more details see:
- West Indian Slave Registers mentioning slave ethnicity such as Moco but also Eboe and Congo
- The Igbo Connection for Virginia & Virginia-Descendants
- Ethnic Origins of South Carolina Runaway Slaves
- Ethnic Origins of Liberated Africans in Cuba (incl. “Carabali Camaron”)
- The Abakuá institution: a Carabalí foundation in Cuban society
- Central Africans and Cultural Transformations in the American Diaspora
- My Slave Ancestors: From Angola? (by Henry Louis Gates Jr)
Relative contribution of “Cameroon/Congo” across the Diaspora (sorted)
***Chart 7 (click to enlarge)

***
The above chart 7 is displaying the current findings of my ongoing cross-Diaspora survey of AncestryDNA results (as of Feb. 2017, see this page for a summary of my findings in 2018). We can verify that sofar the socalled “Cameroon/Congo” region is most prevalent among Brazilians and Haitians. Which is in line with expectations as Brazil and Haiti had a greater share of slave trade with Central Africa than the other countries being mentioned in the overview (see this page). The other “Cameroon/Congo” proportions are usually also closely related to the documented share of Central Africa in Slave Trade for each nationality. Even more so when combined with the “Southeastern Bantu” scores. For example for the USA, “Cameroon/Congo” and “Southeastern Bantu” combined would be 26,5% (20% + 6,5%). Which corresponds very nicely with an estimated share of Central Africa in the slave trade to the US of about 25% (see this chart). Eventhough due to limited samplesize this data is preliminary it is still also cross-sectional because it was collected from various parts of the Diaspora and also at random. Overall contributing to the robustness of the data. Therefore based on these findings i am inclined to say that indeed on average “Cameroon/Congo” will be more likely to signal Central African (incl. Congo & Angola) origins rather than Biafran (southeast Nigeria & Cameroon) ones. Although again context is everything and combined with additional supporting evidence a Biafran or even a strictly Cameroonian connection could still be feasible in many cases.
***
2) Southwestern Bantu ancestry much more likely than Southeastern Bantu ancestry
***Map 4 (click to enlarge)

Source: http://www.ancestry.com
***Chart 8 (click to enlarge)
HGDP database incl. Namibian samples (“Bantu S.W.”= Southwestern Bantu)

***
I will eventually provide a follow up to this section. I will then focus in greater detail on the implications for Afro-Diasporans looking into possible interpretations for their socalled “Southeastern Bantu” scores. Right now I will however already point out the following. Unless guided by wishful thinking or delusional ideology it is advisable to be very mindful of “false positives”. That is DNA results which on first sight seem to suggest East African origins to some degree. But on closer and more critical inspection they actually are referring to much widerranging origins, including Central & Southern Africa. Usually this occurs because of ambigious phrasing or inadequate sampling by DNA companies but it is also caused by incorrect interpretation and having insufficient knowledge about the relevant context as well as inherent limitations of DNA testing. Furthermore the widespread Bantu migrations across this greater part of Africa also tend to complicate things genetically speaking.
Various and at times mutually exclusive ancestral scenarios will be implied by AncestryDNA results. All depending on your own family history and especially the population history of the ethnic group you belong to. The socalled “Southeastern Bantu” regional score being reported for a Kenyan or a South African will trace back to an entirely different set of ancestors than for let’s say a Jamaican. Afterall also Southwestern Bantu origins, especially from Angola, might be referred to by this socalled “Southeastern Bantu” region. As can be seen in the map above and also the fact that this region is most likely based on Bantu speaking samples from not only Kenya and South Africa but also Namibia, which is a neighbouring country for Angola! This can be verified from the overview of the HGDP database (chart 8) which according to Ancestry’s own information was utilized for their reference panel (see AncestryDNA Regions for sources).
In order to improve the interpretation of the socalled “Southeastern Bantu” region it is indeed crucial to be aware that this region is based on HGDP samples from Kenya (unspecified Bantu), South Africa (Pedi, Sotho, Tswana and Zulu) and Namibia (Herero, Ovambo). Obviously for South Africans a genetic similarity to the South African samples will apply just as for East Africans a genetic similarity to the Kenyan samples will apply. However for Afro-Diasporans in the Americas any socalled “Southeastern Bantu” score will in most cases be the result of genetic similarity to the Namibian samples used by AncestryDNA. Namibia being a neighbouring country to Angola, which together with the Congo has been a significant region of provenance for practically all Afro-Diasporans in the Americas. See charts 9-11 below.
While Southeast Africa, in particular Mozambique, did indeed function as a source for Trans-Atlantic Slave trade as well, the numbers involved are much more reduced. And for East African countries further up north (the socalled “Swahili Coast”) barely any documented evidence seems to exist2. Proportionally speaking Southeast Africa represents less than 5% of the total slave trade for practically all of the Americas, safe for Brazil (still less than 10%). While for the USA it was even less than 2%. The proportional share of Central Africa in Trans Atlantic Slave Trade is estimated to have been 8 up to 15 times greater than for Southeast Africa! As can be seen in the following charts taken from the Slavevoyages Database.
***Chart 9 (click to enlarge)

Source: Trans-Atlantic Slave Trade Database 2016 (http://www.slavevoyages.org)
***Chart 10 (click to enlarge)

Source: Trans-Atlantic Slave Trade Database 2016 (http://www.slavevoyages.org)
***Chart 11 (click to enlarge)

Source: Trans-Atlantic Slave Trade Database 2016 (http://www.slavevoyages.org)
***
Another strong indication of southwestern rather than southeastern Bantu origins being prevalent for Diasporans (in the Americas) has been established during my ongoing survey of AncestryDNA results among Afro-descended nationalities (see this page for a full overview). In which sofar socalled “Southeastern Bantu” reaches its highest group average among Brazilians followed by the Mexicans. Both countries having an undeniably well attested historical connection with Angola! Also for other Latin Americans rather elevated group averages are arising. For American Americans the “Southeast Bantu” region is showing up more pronounced than for Jamaicans on average. Which is in line with general slave trade statistics. And again it’s very likely referring to more than just strictly Southeast African origins. Mozambican and Madagascar ancestry remain theoretical possibilities but more remotely so based on slave trade statistics (see charts above). When combined with additional evidence the Madagascar options may be made more plausible though.
As Angola doesn’t have its own separate region yet on AncestryDNA (despite probably being the greatest souce of African slaves to the Americas as a whole) it is very likely that most of Angolan ancestry will be described by socalled “Southeastern Bantu” in combination with “Cameroon/Congo”. Undoubtedly given that only 18 samples were used by AncestryDNA there is much room for improving the socalled “Southeastern Bantu” category. Obviously adding samples from Mozambique and Angola will provide a much better picture.
Relative contribution of “Southeastern Bantu” across the Diaspora (sorted)
***Chart 12 (click to enlarge)

***
It is good to keep all of the above in mind as the DNA testing science is still in full development and personal DNA-test results will be imperfect and preliminary. Any outcomes seemingly suggestive of non-conventional African ancestry among Afro-Diasporans should therefore be evaluated critically in order to rule out any false positives. See below claims of Kenyan ancestry by an African American politician and how they were received by Kenyans. Rather similarly to the claims of Zulu ancestry by Oprah Winfrey:
***
- Another US president from Kenya? Ben Carson claims Kenyan roots
- My ancestor was a Turkana, says US presidential candidate Ben Carson
- Dr. BEN CARSON caught red-handed lying about his Kenyan roots
- Go away, you are a political CONMAN” TURKANA elders disown Ben Carson
***
- Is Oprah Zulu? Sampling and Seeming Certainty in DNA Ancestry Testing
- Oprah’s baffling claim of Zulu blood
***.
___________________________________________________________________________
Notes
1) Central & Southern Africa is overwhelmingly populated by Bantu-speaking people. While the original inhabitants, the Pygmy and Khoi-San populations, have been heavily marginalized. Only to be found in remote locations and with very low numbers, probably less than 1% of the total population of this entire area. Despite this they are still very well represented in DNA testing because many important studies have been published on the genetics of these socalled “Hunter-Gatherers” (to be frank I personally do not agree with the choice of this labeling, but soit..). The links below are just meant as a very limited selection:
- Sociocultural Behavior, Sex-Biased Admixture, and Effective Population Sizes in Central African Pygmies and Non-Pygmies
- Whole genome sequence analyses of Western Central African Pygmy hunter-gatherers reveal a complex demographic history and identify candidate genes under positive natural selection
- The genetic prehistory of southern Africa
- Complete Khoi-San and Bantu genomes from southern Africa
2) Based on the records available in the standard reference database of the Slave Voyages website this East African share in Trans-Atlantic Slave Trade might be less than 0.1% (=6324/6709327). Comparing the total number (6,324) of disembarked captives for Kilwa, Zanzibar and Mombasa, all Swahili ports to the north of Mozambique, with the total number of disembarked captives from Southeast Africa (308,775, overwhelmingly from Mozambican ports with main destination being Brazil) and all of Africa (6,709,327). Naturally all of this is according to what has been documented and excluding voyages with unknown itineraries.
***(click to enlarge)

***
