
Contents
- Introduction
- Summary of survey findings
-
- Continental breakdown
- Madagascar Connection
- African breakdown
- Comparing with other parts of the Afro-Diaspora
- Substructure among African Americans
- Recent Ancestor Locations
- Continental breakdown
-
- Screenshots of 23andme results for African Americans
1) Intro
This page features screenshots of African American 23andme results.1 When reviewing these results it is essential to be aware that 23andme has implemented several updates in the last two years. Often beneficial for Tracing African Roots! Starting with the introduction of a new African regional framework in 2018. In 2019 new reference samples were added for especially North Africa. While also the potentially very useful Recent Ancestor Locations feature has been greatly expanded. In 2020 an upgraded algorithm was introduced. I will indicate for each screenshot which version it represents. In fact the differences between the 2018 & 2019 versions tend to be very slight for most people, when looking only at the %’s. But the 2020 update did cause a greater impact. For greater understanding of how 23andme is able to come up with these results and how to correctly interpret the African breakdown read these links:
- Ancestry Composition (2018-2020)
- 23andme’s new African breakdown put to the test (2019)
- Update of 23andme’s African breakdown (2020)
2) African American group averages
In order to attain greater insight for these African American results I have performed a survey (based almost exclusively on the 2018 version).2 The main focus being on the African breakdown. Given the robust sample size of my survey (n=200) it will be useful to look into their group averages and compare with other parts of the Afro-Diaspora as well. Also in your personal quest as it might serve as a helpful baseline so to speak. Which makes it easier to see how your own results fit in the greater picture. Do keep in mind that in my surveys I always scale the African breakdown to 100%! So in order to compare you will first have to calculate your own scaled results. Which is very simple. Basically: % for a given African region divided by % of total African amount. Naturally individual variation is a given and is not to be denied! Any meaningful deviations from the group averages hopefully serving as useful clues.3 See links below for my online spreadsheet which features all of the individual results:
- African American 23andme results (2018 version) (online spreadsheet, sorted on state origins)
- African American 23andme results (2018 version) (online spreadsheet, sorted on African admixture)
Aside from a strictly personalized perspective of course also on a more broader population level the relevant historical context will remain essential to really get the most out of your own admixture results. As most of the time your results will actually conform more or less with the results of other people with similar backgrounds. And therefore in the greater scheme of things your own personal African roots will be pretty much the same as for other people with your particular background. Afterall most of our more distant African lineage will be shared with fellow countrymen with whom we share more recent ancestral ties. Reinforced by relative endogamy at times. Probably especially in the foundational period of the 1700’s when African Americans emerged as a distinctive ethnic group within its own right. See also:
- From African to Creole (Tracing African Roots)
- 4,000 Years of African American History in One Post (Black Demographics)
However Domestic Slave Trade and Post Slavery migrations have resulted in great deal of additional intermingling and diversification of African lineage. On top of what was already the result from both Trans-Atlantic and Intra-American Slave Trade combined. This is especially true for the USA because of its continental size. The resulting mix actually being quite distinctive for African Americans as a whole. Even when of course individual variation will remain a given. On the other hand localized genepools for the main entrypoints of Africans within the USA may still exist as well. In fact genetic substructure according to earliest known state origins does seem to occur among certain subsets of African Americans. At least based on my survey findings. Further reading:
- Documented Ethnic & Regional origins of African Americans (Tracing African Roots)
- Trans-Atlantic & Intra-American Slave Trade Patterns (Slave Voyages Database)
- African-American Migrations (In Motion: The African-American Migration Experience)
Continental breakdown
Table 1 (click to enlarge)

Generally speaking most African Americans are clearly of predominant African descent, combined with minor other ancestral components. I did not include “West Asian & North Africa” nor “South Asian” scores in this overview because these were practically absent. See this screenshot for an overview of my previous Ancestry survey findings (n=350). And also this one featuring the complete continental breakdown (n=200). The overall group averages being nearly identical!
***
Table 2 (click to enlarge)

The state origins of my survey participants are not based on a 4 grandparents criterium per se. But often this was indeed confirmed by their profile details on 23andme. Either way insightful variation according to state origins. Take notice especially of the highest subgroup averages which have been highlighted in red. The African admixture ranges (min. – max.) were as follows: Louisiana (51%-94%); South Carolina (75%-99%) ; Virginia (56%-94%). Compare also with my previous survey findings on Ancestry.
***
Of course my 23andme survey may have several limitations. The group averages I have calculated for my survey-(sub)groups are neither absolute or conclusive but rather to be seen as indicative. One main aspect to take to heart is that there will always be individual variation around the mean! Still the sample size of n=200 should be sufficiently robust to pick up on the main tendencies. I have made an extra effort to do justice to the entire African American spectrum across the country. Of course all done on a best-effort basis.
While at the same time I have also focused on gathering atleast a minimum number of 20 survey participants each for Louisiana, South Carolina and Virginia. These are 3 key states when considering African American genetics & origins. I do think my survey group is fairly representative. Only the Northeast is somewhat underrepresented. Mostly due to my cautious selection of survey participants (see footnote 1). Even when African Americans with longstanding roots from the Northeast do have a distinctive history of their own as well. See also this useful website:
My findings with relation to the continental breakdown are in line with published studies on African American genetics. But my inclusion of Southeast Asian admixture statistics might be a first, as far as I know.4 Furthermore this continental breakdown on 23andme is also greatly similar or even practically identical to my previous Ancestry survey findings from 2015 & 2018. The main outcome being that my African American survey participants are predominantly African descended combined with additional admixture. Almost all of this additional ancestry will usually be European in fact. Often to a minor but still substantial degree. Aside from much more diluted but still distinctive amounts of especially Native American and perhaps more surprisingly also Southeast Asian admixture!
Compare also with my previous Ancestry survey findings:
- Blog posts
- 350 African American AncestryDNA results (2015)
- Update: Afro-Diasporan AncestryDNA Survey (2018; incl. discussion of European, Native American and Asian scores)
- Charts
- African admixture for African Americans on AncestryDNA (2015; n=350)
- African admixture for African Americans on AncestryDNA (specified according to state origins) (2015; n=350)
- Continental breakdown for African Americans on AncestryDNA (2018; n=200)
Due to lack of space and the overall focus of this blog I will not discuss the non-African admixture scores of my African American survey group in great detail on this page.5 But of course these ancestral components can be interesting in their own right as well! In line with expectations as well as my previous Ancestry survey findings the European component of African Americans is mainly described as “British and Irish”. Or more generically by the macro-region of: “Northwestern European”. As you will notice in the screenshots below this category is consistently showing up as the predominant part of the European breakdown of my African American survey participants.
After the upgrade of 23andme’s algorithm in 2020 this is even more true. Possibly over-homogenized in some cases. But overall still corresponding with common knowledge about the European origins of African Americans overwhelmingly being British and Irish. Even when of course also additional lineage from other European countries might exist in selected cases. But as always to be corroborated by follow-up research and not just based on regional admixture estimates. In particular historically plausible French and/or Spanish admixture among Louisiana Creoles will often be clearly distinguished by 23andme. Going beyond minimal amounts of “Southern European” which are likely to be mere misreadings! Again often no longer visible after the 2020 update.
In line with my previous Ancestry survey the highest degree of European ancestry was to be found among my survey participants from Louisiana (20%) and Virginia (23%). Partially caused by a few outliers with European admixture higher than 40%. Including a couple of Louisiana Creoles but actually also among my Virginia survey participants. Virginia having a long history of so-called free people of color communities (see this paper). Of course the sample size of n=20 for these states is rather limited. However I suspect that more generally speaking especially for Virginia it might be true that their most frequent African admixture bracket will tend towards 70%-80% African. While for South Carolina it might actually be 90%-100%. Louisiana being somewhat inbetween and more so conforming with my overall nation-wide survey group (n=200). Which has 80%-90% as their most frequent African admixture interval.
My findings of usually minimal Native American admixture among African Americans (0.8%) are again in support of published studies. As well as very similar to my previous survey findings based on Ancestry results (0.6%). Around 20% (42/200) of all results did not show any Native American admixture at all. Or only at an absolute minimum of 0.1%. For a greater majority (140/200) it was smaller than 1%.
This outcome seems to be caused by inevitable dilution of such bloodlines across the generations. Something many Americans may have underestimated due to inexact family lore. Even though less than anticipated even minuscule trace amounts of <1% could still be valid. Suggesting Native American ancestry from the 1700’s or earlier rather than from the 1800’s/1900’s. An important aspect to keep in mind is that due to recombination and dilution over the generations a genetic inheritance from 1 single ancestor only will eventually be “washed” out. This might occur already after 7-10 generations (see this useful graph).
But of course in individual cases other scenarios might apply. In fact the maximum score of Native American admixture in this survey was 7.8%. Which could very well be due to more recent Native American ancestry. About 10% (18/200) of my survey group received Native American scores greater than 2%. Many of them from either Louisiana or Virginia which explains their slightly higher group average when compared with my surveygroup from South Carolina (see table 2). For more discussion:
- High Cheekbones and Straight Black Hair? (The Root)
- Native American DNA Is Just Not That Into You (Roots & Recombinant DNA)
***
Madagascar Connection
***

2018 version. These are the 23andme results of a person from Madagascar (possibly Merina). Malagasy are a typical blend of Southeast Asian and Southeastern Bantu DNA. Therefore any DNA test result for them or their mixed descendants should also reflect this. The Southeast Asian component consisting of two separate but ultimately overlapping categories. Do also notice the correct assignment of “Madagascar” as recent ancestral location. For more Malagasy 23andme results see this page. It also features insightful results for South African Coloureds and Indian Ocean Creoles who have a Madagascar connection as well.
____________________
“Malagasy ancestry might be surprisingly widely dispersed within the African American genepool, even if strongly diluted in almost all cases. This would be judging from personal observation and based on these indicators:
-
minor Southeast Asian percentages (usually inbetween 0,5%-2%) being reported for a multitude of African Americans tested on 23andme.
-
minor but still noticeable frequency of haplogroups associated with Malagasy ancestry among African Americans tested on 23andme.
-
frequent occurence of shared DNA segments between DNA tested Malagasy and African Americans.” (Fonte Felipe, 2016)
____________________
Another usually minimal ancestral component within the continental breakdown of my African American survey group are their Southeast Asian admixture scores.6 Indicated on 23andme by both “Filipino & Austronesian” and “Indonesian, Thai, Khmer and Myanma”. Both falling under the macro-region of “Chinese & Southeast Asian“. The specific country labeling not to be taken too literally. It is more important to grasp that a distinction is being made for generic Southeast Asian DNA. Which also happens to be reported for people from Madagascar! This country being a very plausible place of origin when Tracing African Roots for African Americans. Such a Malagasy connection might still come as a surprise to many. However other people have been aware of this remarkable Madagascar connection for several years already. I myself have also blogged about it a couple of times as shown in the quotation above.
Because these Southeast Asian scores are often within noise range (<1%) naturally they are to be critically assessed. Also given the imperfections of regional admixture. On the other hand such scores have been tellingly consistent. Even with subsequent updates before and after 2018. While 23andme arguably is most finetuned and best equipped to pick up on distinctive amounts of trace admixture. Actually also on Ancestry such minor Southeast Asian scores are now frequently appearing for African Americans after its recent updates in 2019 & 2020. And as mentioned in the quote above plentiful corroborating evidence did already exist earlier for making a solid case of a diluted but still highly distinctive Madagascar connection. For more details follow these links (which contain further references):
- Got Roots in Madagascar? (2014, Roots Revealed)
- Malagasy Roots DNA Project (featuring a useful overview of haplogroups associated with Malagasy ancestry)
- Part I: The DNA Trail from Madagascar to Manhattan (2015, Radiant Roots & Boricua Branches) (see also Part II and Part III)
- Southeast African Slave Trade Statistics (2016, Tracing African Roots)
My current survey findings (n=200) allow me to expand on the 3 indicators listed above. All of which combined should validate a significant Madagascar connection for African Americans in an even more robust manner. In particular:
- Southeast Asian admixture of atleast 1% was obtained for almost 20% (38/200) of my survey group. Which should be beyond trace level already. The maximum score of 6.4% beyond a doubt being genuine.
- The consistency of minor yet distinctive Southeast Asian scores can be measured by the median result of 0.5%. Implying 50% of my survey group obtained atleast 0.5% Southeast Asian admixture. While only for 17 persons out of 200 (=8.5%) such admixture was not detectable at all. Indicative of how widespread this particular lineage has become among African Americans. Presumably due to founding effects from the early 1700’s! As well as reflecting Domestic Slave Trade originating mostly from Virginia.
- Southeast Asian admixture findings for African Americans clearly stand out when compared with other parts of the Afro-Diaspora (except for Mexico and possibly also Suriname). This is most apparent when comparing with Anglo-Caribbeans and Haitians who are otherwise quite similar to African Americans. Because I have performed several surveys of 23andme results for other Afro-descended populations I was able to verify this systematically. With similar Southeast Asian scores being either absent or atypical elsewhere one might already rule out the theoretical possibility of an algorithm error on 23andme’s part. See this overview for links to my other surveys.
- I found a greater incidence of Southeast Asian admixture among my survey participants from Virginia (0.8%, see Table 2). While the lowest group average was found for my survey group from South Carolina (0.2%). Eventhough the difference might seem trivial actually it is being bolstered by several higher outliers which were often occurring for people with (partial) Virginia backgrounds as well as from New Jersey. This outcome can be seen as a consolidation of the historical plausibility argument. It being known that Malagasy captives entered the USA chiefly through Virginia and New York. While Domestic Slave Trade subsequently lead to a wider dispersal across the Deep South.
- 23andme’s ability to detect Southeast Asian admixture has been steadily improving. As can be seen from results being reported for actual persons from Madagascar (see this page and this one). Furthermore from my observations 23andme also has a rather impressive trackrecord when distinguishing the mixed origins of persons with known lineage from multiple places. For example see these results of a person with confirmed 1/4 Filipino ancestry.
As far as I know this summary of my survey findings (n=200) could be the first time Southeast Asian admixture for African Americans is being analyzed on a group level. I aim to blog about these findings in greater detail eventually.7 Also combining with African DNA matching patterns. Actually based on the so-called Countries of Ancestry results on 23andme for two Malagasy persons I already established in 2015 that increased odds might exist for African Americans to receive Malagasy DNA matches. See also:
- DNA matches reported by 23andme for 75 Africans
- African DNA Matches reported by Ancestry for 50 African Americans (under preparation)
***
Chart 1 (click to enlarge)

This chart is showing the full extent of African ancestry among my African American survey participants. The most frequent African admixture interval is 80-90%. Which is the same as it was during my previous Ancestry survey (n=350, see this chart).
***
____________________
“I calculated these data also in order to compare with the recently published statistics for “5,269 self-described African Americans” who tested on 23andme. For these 23andme customers an average proportion of African ancestry of 73,2% was calculated. Which is lower […] than several other averages from published DNA studies. For example Baharian et al. (2015), has 82,1% for a nationwide sample group (HRS, n=1501) and 84,1% for a sample group drawn exclusively from southern states (SCCS, n=2128). […] However on 23andme the most frequently observed African proportion range again seems to be 80-90%, as it was also for my sample group.” (Fonte Felipe 2015)
____________________
In line with my previous survey based on Ancestry results (n=350, see this chart) as well as various DNA studies my African American survey participants are predominantly African descended. To be combined with varying proportions of non-African admixture. Chart 1 is demonstrating that 75% of my survey group has African DNA falling within the 60%-90% bracket (12+25+38). While the most frequent African admixture interval was 80-90%. Also as can be seen in Table 1 the group average for African admixture was 80% while the median (50% cut-off) was 83%. Indicative of a somewhat skewed distribution tending towards the higher end of the spectrum.
Then again on both sides of this wider spectrum actually still a considerable share of people are mentioned as well. With 5% of my survey group having African ancestry lower than 60%. While 20% of my survey group obtained African scores higher than 90%. As shown in Table 2 state origins are somewhat correlating with this spectrum. South Carolina showing the highest degree of African admixture: 88%. Obviously my sample size is rather minimal. But still the outcomes are in agreement with prior expectations and previous studies (e.g. Baharian et al. (2015)). In particular Gullah people from the Lowcountry in South Carolina are often said to have retained their African heritage the best. Both culturally and genetically (Zimmerman et al., 2020). But actually my survey participants hailed from other parts of South Carolina as well.
On the other hand of course within each state there will also be internal variation. And in fact several 90%+ African results were obtained from not only Virginia and Louisiana but many other states as well. So certainly such profiles are not exclusive to South Carolina as it sometimes assumed to be! Also I have observed African results lower than 70% for several other states and not just Louisiana or Virginia. In fact one survey participant from most likely South Carolina also showed African admixture as low as 63.5%! But as I did not have full confirmation he was not included in my survey findings for South Carolina (n=20). The African admixture ranges (min. – max.) were as follows: Louisiana (51%-94%); South Carolina (75%-99%); Virginia (56%-94%).
Compare also with my previous survey results from 2015, based on 350 AncestryDNA results. Which are greatly similar. For example the most frequent African admixture interval in 2015 was also 80%-90%. And even for an almost identical share of people: 39.7% (138/350) versus 38% (76/200) in this current survey. However with my 23andme survey a more narrow distribution is appearing. With less extremes on either side. Most likely because this time I included fewer Louisiana Creoles in my survey. Possibly 15 on Ancestry and atmost 5 persons (incl. one from Texas) within this current survey. Which accounts for a relatively smaller number of persons with African admixture lower than 60%.
Also not a single African American scoring 100% African in this 23andme survey. Although in fact one person (from South Carolina) did come close enough with 99.4% and the remaining part being only Native American! In 2015 however I managed to include no less than 4 persons with 100% African admixture. This outcome is most likely caused by 23andme’s algorithm being more finetuned when dealing with trace amounts. Contrary to oft repeated assumptions African American results without any European admixture do exist! On Ancestry I have seen atleast 10 multi-generational African Americans receiving 100% African scores. A proportion of about 2% of all my observations within the 2013-2018 period (10/515). Also on 23andme I have seen a few results already with practically 100% African. Especially after the 2020 update.
- African admixture range for African Americans on AncestryDNA (2015; n=350)
- African admixture range for African Americans on 23andme (2015; n=5269)
To be kept in mind is that African Americans will have their own perspective on ethnic identity and how it may overlap with racial classification. While certain subgroups within my survey such as Louisiana Creoles or also South Carolina Gullah, have their own distinctive culture/history and may also choose to identify accordingly. Naturally I fully respect this! And obviously beyond the scope of my research no further implications are intended.
Just as a general disclaimer I should also point out the following. I am aware that admixture test results can be a sensitive topic. My research is purely scholarly. But it also stems from my deep fascination with the entire Afro-Diaspora. I highly admire the many achievements of African Americans in not only the cultural field but also in the social and political domain. But I do not condone the misuse of my research for identity politics! And I will also not allow my blog to be used as a platform for any divisive speech or extremists. DNA testing can be very educational and may have many positive effects. However in some cases it may also be abused by narrow-minded people with bad intentions.
- Can DNA Ancestry Testing Make You More Racist/Tribalistic? (Scientific American)
African breakdown
***
Table 3 (click to enlarge)

African Americans are shown to be mainly West African (~80%). While their Northeast African ancestry is at noise level. And even when genuine most likely suggestive of a very faint DNA signal inherited by way of Sahelian West African ancestors. The Central African component is most likely underestimated in 23andme 2018/2019 version. But even so at around 15% it is already quite distinctive and in the expected ranking order when compared with other parts of the Afro-Diaspora.
***
In the above chart I am using a 3-way macro-regional framework. More basic than the actual African breakdown on 23andme (featuring atleast 12 categories). But I find such an approach to be potentially quite insightful as it enables an intermediate perspective which is often easier to make sense of. However due to fewer West African regions available on 23andme it is not completely the same as what I have used for my previous Ancestry surveys (Upper Guinea, Lower Guinea, Central & Southeast Africa, see this chart). Similar regions to “Mali” and “Benin/Togo” are lacking on 23andme at this moment. Another big difference is caused by 23andme’s more conservative approach than on Ancestry. Whereby African DNA which cannot be classified reliably (given 23andme’s limited set-up) is put under either “Broadly West African”, ‘Broadly Congolese & Southern East African”, or “Broadly African”.
This inevitably results in some shifts within 23andme’s African breakdown. Nonetheless still useful to see that my African American survey group is showing up as largely West African (~80%). While their Northeast African proportion is practically inexistent (0.1%). In line with other parts of the Trans-Atlantic Afro-Diaspora as well as of course conforming with historical expectations and published DNA studies. Whenever so-called Northeast African scores do appear it is usually appearing as “Sudanese” and around noise level (atmost 0.5%, unscaled). If truly genuine this is most likely representing a very faint DNA signal inherited from Sahelian West African ancestors (such as the Fula, Hausa-Fulani or Tuareg).
Central & Southeast African DNA combined is at a considerable level of almost 15%. Which is already quite distinctive and in the expected ranking order when compared with other parts of the Afro-Diaspora (see further below). However this mainly Central African component is most likely underestimated in 23andme 2018/2019 version. In my previous Ancestry survey (n=350) it was around 28% of the African breakdown (scaled to 100%). Despite subsequent updates this Central African share has actually been quite consistent on Ancestry. Which corresponds very well with documented Trans-Atlantic Slave trade originating from Central Africa also being nearly 28% for the USA (see this overview, taken from the Slave Voyages Database). Fortunately it seems that after the 2020 update 23andme has improved its detection of Central African DNA. Not shown in this table but also the additional 3.8% “Broadly African” is to be taken into account and probably to be added mostly to the Central African proportion.
Compare with my previous Ancestry survey findings:
- Blog posts
- “Much more consistency when applying a macro-regional framework” (scroll down to section 3)
- Charts
Table 4 (click to enlarge)

“Nigerian” was clearly the most significant region for the greater part of my survey group. However for a substantial part of my survey group also “Ghanaian, Liberian & Sierra Leonean” appeared in first place. And more atypically even one time “Senegambian & Guinean” (see ranked #1). Aside from the group averages do take notice also of the complete range (min-max) for greater insight! Also don’t take the country labeling too literally. Because for example “Nigerian” will also cover DNA from Benin, Togo and (eastern) Ghana. And also from Cameroon. Even when the main ancestral implication will usually indeed be Nigerian lineage. See this map.
***
____________________
“Which would imply that the grand total of “genuine” Nigerian ancestry for my African American sample group could be as high as 30% instead of 20%, on average. Of course this is mere speculation at this stage ” (Fonte Felipe 2015)
____________________
Looking at the the regional group statistics shown above it is clearly “Nigerian” which is most significant for the greater part of my survey group. However other regional scores are also showing up with substantial amounts. In particular “Ghanaian, Liberian & Sierra Leonean”. Also taking into account the “Broadly” scores this makes for an overall quite balanced and varied breakdown. Categories indicating Upper Guinean lineage (“Senegambian & Guinean”) as well as Central African lineage (“Angolan & Congolese”) still at a level of around 10%. But otherwise the bulk (24.1% + 35.4%) of this African breakdown is suggestive of principal origins from Lower Guinea (area in between Liberia-Nigeria). Which is in line with my previous Ancestry survey from 2015, which had a 55% share of Lower Guinean regions.
Although 23andme’s West African breakdown is less detailed than on Ancestry it should be useful to compare again with my previous survey findings in 2015 (n=350). Keep in mind that even with similar labeling the regions will not be exact equivalents. Basically this is due to differences in reference samples as well as in algorithm applied by each separate DNA test. I greatly suspect that many of the prominent “Benin/Togo” and also some of the “Cameroon/Congo” scores on Ancestry will now be read as mostly “Nigerian” instead on 23andme. Above average “Mali” scores on Ancestry are likely to be included in prominent “Ghanaian, Liberian and Sierra Leonean” scores. Aside from also possibly to be included in either the “Broadly African” or “Broadly West African” categories on 23andme. Similar to my findings in 2015 primary “Senegambian & Guinean” scores will be very rare among African Americans. And this goes even more so for primary “Southern East African” scores, which should be practically impossible to attain. Unless there is some recent lineage from elsewhere to account for it. Because this was also already the case on Ancestry for “Senegal” and “Southeastern Bantu” (see this chart).
As mentioned in the quotation above in 2015 I already established that “Nigeria” will be primary for many if not most African Americans. Based on my survey of 350 African American AncestryDNA results. Already apparent when focusing only on their “Nigeria” scores. But actually during that survey Ancestry’s 2013-2018 version tended to underestimate Nigerian ancestry. Additional Nigerian DNA being covered by first of all “Benin/Togo” and to a lesser degree also “Cameroon/Congo”. Therefore already in 2015 I speculated that the true proportion of Nigerian ancestry for African Americans might be around 30% of their scaled African breakdown, on average. With subsequent updates on Ancestry the “Nigeria” scores for African Americans have indeed been on the increase. After the latest update in 2020 it seems to represent around 36% of their African breakdown, on average (see this overview). Which is practically identical to my current 23andme findings of 35.4% “Nigerian”!
It is essential to be aware though that so-called “Nigerian” on 23andme is also including genetic connections with Gbe speakers (incl. the Fon from Benin but also the Ewe from Ghana/Togo). And probably to a lesser degree also genetic ties with (western) Cameroon could be implied. See also this map. So “Nigerian” is probably a bit inflated at this current level of around 35%. Because afterall 23andme does not have a category similar to “Benin/Togo”. But otherwise this outcome is quite indicative already of how genuine Nigerian ancestry will indeed be significant for many African Americans. Actually also reinforced by African DNA matching patterns for African Americans.
Based on my surveyfindings on both Ancestry (n=350) and 23andme (n=200) it seems that a credible level of Nigerian DNA within the African American genepool will be somewhere in between the range of 20%-35% (on average and with the African breakdown scaled to 100%). Future research will be needed to narrow down to a more solid estimate. But quite likely the overall level of genuine Nigerian DNA among African Americans might indeed be around 30% (on average). Something which might come as a surprise to some people. However it is actually a plausible outcome when looking at the relevant historical context and the relevant statistics! Something which I will discuss further below.
“Ghanaian, Liberian & Sierra Leonean” is the second-most important region for my African American survey group. With a similar range as “Nigerian” and nearly always being reported with double-digit amounts. In fact “Ghanaian, Liberian & Sierra Leonean” was the biggest region for a considerable number of people (37/200) within their African breakdown! Eventhough not measuring the exact same type of DNA it is still noteworthy that an average level of around 24% is pretty close to my finding of almost 20% “Ivory Coast/Ghana” for African Americans on AncestryDNA (2013-2018 version). The circumstance that 23andme is currently missing a category similar to “Mali” on Ancestry is most likely resulting in additional DNA from Mali and surrounding countries such as Burkina Faso being covered by “Ghanaian, Liberian & Sierra Leonean” as well (see this map and also this screenshot of the 23andme results for a Malian/Guinean person). Even when most likely it is indeed all those three countries mentioned in the labeling which are the main ancestral implications being made by this category.
As already mentioned 23andme has most likely been underreporting Central African DNA with its 2018/2019 version. In my previous Ancestry survey “Cameroon/Congo” was probably a better indicator of true Central African lineage among African Americans. The group average then was nearly 20% which is practically twice as much as the current group average of 10.7% “Angolan & Congolese”! Then again this region on 23andme (previously named “Congolese” but unchanged otherwise) does show up with quite substantial amounts as well. So at the very least “Angolan & Congolese” does seem to provide a credible minimum of Central African lineage. With hardly any overlap with the Bight of Biafra as was the case for “Cameroon/Congo” (2013-2018 version!). See also this blog post.
Compared with Ancestry’s 2013-2018 version 23andme does a rather good job at distinguishing Southeast African DNA from Central African DNA. Something which can be tricky due to shared Bantu origins across the wider area. So-called “Southeastern Bantu” on Ancestry used to be a quite misleading region therefore. Because in many cases it was actually suggestive of Angolan or southwestern Bantu DNA. Which is why it was also showing up with a clearly inflated level among African Americans (6.5% on average). However on 23andme the minimal but stilll distinctive group average of 1% “South Eastern African” goes very well with documented Trans-Atlantic slave trade from Southeast Africa also being around 1-2% (see this page). Along with the equally subdued but distinctive Southeast Asian admixture scores reported for African Americans this makes for a further corroboration of the Madagascar connection I already discussed above.
The “Senegambian & Guinean” scores for my survey group are quite similar to the “Senegal” scores on Ancestry. At least in Ancestry’s 2013-2018 version. Quite comparable also in scope although this proxy for Upper Guinean DNA is also covering Guinea Conakry on 23andme (see this map). Which might explain a slightly higher group average of 9.2% in my current 23andme survey versus 8% in my Ancestry survey (n=350). But obviously this is in the same order of magnitude. In my discussion of my Ancestry findings in 2015 I already mentioned why such scores might be lower than anticipated. In particular caused by a possibly greater dilution of Senegambian bloodlines. Even when actually one person (most likely Creole) in my current 23andme survey did have this region showing up as biggest African region!
Compare with my previous Ancestry survey findings:
- Blog posts
- Additional Nigerian origins beyond reported by “Nigeria”? (scroll down to section 4)
- Less Upper Guinean ancestry than expected? (scroll down to section 3)
- Charts
- African regional scores on Ancestry (2015; n=350)
- Frequency of primary ranking of African regions (2015; n=350)
Comparing with other parts of the Afro-Diaspora
____________________
“Establishing where each African region is relatively more pronounced or instead more subdued might provide insightful clues for the unique ethnogenesis of each nationality being shown as well as for African Americans.” (Fonte Felipe 2015)
____________________
Table 5 (click to enlarge)

This table is taken from my Afro-Diasporan survey of 23andme results. The data has been sorted on highest to lowest score for “Nigerian”. The highest group average for each region has been encircled in red. Obviously several limitations might apply, however the ranking order is mostly in agreement with historical plausibility. Compare also with my previous findings on Ancestry from 2016. For actual Nigerian 23andme results see this page.
***
____________________
” […] great degree of shared regional roots between African Americans and Jamaicans. […] African Americans will usually show higher “Senegal” scores (even if not consistently so) and a more balanced range of their African regions.” (Fonte Felipe 2016)
“African Americans have a greater share of Senegambian ancestry only when compared to the English speaking West Indies and Haiti but not so when compared with the Hispanic Caribbean and Mexico/Central America. “ (Fonte Felipe 2016)
____________________
This section is just meant as a short preview of my more extensive surveyfindings for several Afro-descended survey groups from various parts of the Americas as well as Africa.
- 23andme results for people across the Afro-Diaspora
- Afro-Diasporan 23andme results (2018 version) (online spreadsheet)
As mentioned in the quotes above comparing results across the Afro-Diaspora will be quite insightful for revealing the various tendencies in African regional admixture for my various survey groups. The relevant historical context needs to be applied of course to independently check if the data makes sense already *more or less*. And actually from my findings sofar I do think most of the outcomes are roughly corresponding with the documented African roots for my sample groups. Even if obviously not exactly so. Other outcomes might seem more unexpected but with additional reasoning these findings also make sense historically speaking or might prove to be valuable for an improved interpretation of the African breakdown on 23andme. Naturally keeping in mind all relevant caveats and inherent restrictions.
For African Americans it might be helpful first of all to compare with Jamaicans. A great degree of overlap exists for the “Nigerian” region as shown in Table 5 above. Showing up in first place for both groups mainly due to shared Bight of Biafra connections. Something which also surfaced in my previous Ancestry survey (see this chart). In Table 5 we can also see a similar group average of around 24-25% for “Ghanaian, Liberian & Sierra Leonean”. Even when actually the underlying ethnic origins may not always be exactly the same. Jamaicans more likely to have additional Ewe/Gbe lineage hiding under “Nigerian”. And probably their additional Cameroonian DNA is also greater than for African Americans. Which would explain why “Nigerian” is extra pronounced for them (49.7% vs. 35.4%).
While African Americans will tend to have greater odds of having actual Sierra Leonean/Liberian lineage. Even when actual Ghanaian DNA will still be a realistic possibility as well of course. However for Jamaicans the chances of genuine Ghanaian lineage should be increased (see this blogpost). Also useful to know that Trans-Atlantic slave trade originating from both Upper Guinea and Central Africa was more significant for the USA than for Jamaica. And this is also reflected in relatively elevated scores for “Senegambian & Guinean” (2.8% vs. 9.2%). As well as “Angolan & Congolese” (5.5% vs. 10.7%). Interestingly during my Ancestry survey African Americans and Jamaicans had a practically identical group average for “Cameroon/Congo” (19.8% vs 20%). The difference showing up right now on 23andme is probably to be explained by a greater pull towards Cameroon for Jamaicans and more so towards Angola/Congo for African Americans.
When comparing with other West Indians Table 5 is showing that a greater and meaningful variation among different parts of the Afro-Diaspora does indeed exist. Unlike what is sometimes assumed 23andme is not just randomly dishing out results for Afro-descendants!8 In particular it is very telling to see a prominent level of “Ghanaian, Liberian & Sierra Leonean” being reported for my Guyanese and Bahamian survey groups. Notice that it is greater than their “Nigerian” share. Which is in line with expectations. Intriguing also to see a rather pronounced level of “Angolan & Congolese” (19.8%) for my Bahamian survey participants. This distinctive Central African component can be explained by relatively singular Trans-Atlantic slave trade patterns for the Bahamas (see this chart). Very interesting also to observe a relatively high “Senegambian & Guinean” score (9%) for my Guyanese survey group. Because actually several of my Guyanese survey participants had distant Cape Verdean ancestry due to contract labourers from the late 1800’s!
“Senegambian & Guinean” is clearly a signature region for Cape Verdeans. Their group average being 73.1%. Confirming their overwhelmingly Upper Guinean origins.9 But otherwise it is among Dominicans that “Senegambian & Guinean” is peaking in Table 5. And actually also for my other Hispanic American survey groups this region is usually more prominent than among African Americans. This so-called Upper Guinean Founding Effect for many Hispanics has already been uncovered by my previous Ancestry survey findings from 2015 (see this page). Reinforcing the consistency and coherency of my main research outcomes on both Ancestry and 23andme.
Finally it will be very useful to contrast with Brazilian results as well. Because from all of my Afro-Diasporan survey groups Brazilians show the highest scores for Central & Southeast African DNA. Something which is of course completely conform expectations given Brazil’s well documented ancestral ties with Angola, Congo and Mozambique. Even when for certain regions within Brazil (such as Bahia) actually also other types of regional African lineage might be very significant. Especially origins from Bight of Benin, reflected in firstmost “Nigerian” scores and probably also “Ghanaian, Liberian & Sierra Leonean”.
Compare also with my previous Ancestry survey findings:
- Blog posts
- Afro-Diaspora AncestryDNA results: A Comparison (2016)
- Update: Afro-Diasporan AncestryDNA Survey (2018, also includes Brazilians)
- Charts
Substructure according to state origins
Table 6 (click to enlarge)

This overview is exploring regional substructure among African Americans according to state origins. Actually hardly any differentiation on display for my subgroup from Louisiana. Most of the contrast is to be seen for my survey participants from South Carolina. In particular their relatively elevated group averages for Upper Guinean and Central African DNA. But also the pronounced “Nigerian” score for my Virginia subgroup is quite distinctive. Arguably to be explained by known differences in Trans-Atlantic slave trade patterns between Virginia and South Carolina.
____________________
“From the outset it has been one of my research goals to explore any possible correlation between the USA state origins of African Americans and the main African regions mentioned in their AncestryDNA results. In particular for people with “deep roots” (going back at least 2 generations on all lines) from the states: Virginia/Maryland, South Carolina/Georgia and Louisiana. As these states are known to have been the main points of entry for Africans being brought over to the USA.” (Fonte Felipe 2015)
“And generally the outcomes seem to reflect localized genepools which on average can show distinct proportions for certain regions. The most noticeable discrepancies seem explainable by way of the documented African origins of each state. ” (Fonte Felipe 2015)
____________________
Table 6 is indicative of regional substructure within the African American population, according to state origins. Even when obviously the sample size is minimal and also other shortcomings might apply. Such as incomplete details concerning the exact family origins of my survey participants. Although actually often I did obtain confirmation of atleast 4 grandparents being born in the same state. Generally speaking it seems however that not many African Americans can trace their origins exclusively to only one USA state when longer time periods are considered. Going back not just 2 or 3 generations but rather 2 or 3 centuries. Around the time when their first African-born ancestors would have been brought over to the United States. Often arriving in the currentday states of either Virginia, South Carolina or Louisiana. Which is why I have focused my research efforts on these three key states when considering the African origins of African Americans.
Genetic substructure is basically referring to subgroups within greater populations. Despite commonalities various localized factors may still have caused differentiation between various subgroups within a given population. In particular pointing towards a distinctive mix of African regional origins. Localized substructure might exist whenever slave trade patterns are known to have been markedly different for various entry points within one country. Showing overlap to be sure but still recognizable due to deviating proportions. With proper interpretation this can be very helpful in your quest to Trace African Roots!
This is a theme I have been researching for African Americans already since 2013 when I first started my previous Ancestry survey (n=350). Because of greater samplesize as well as greater detail in Ancestry’s West African breakdown the underlying trends were more visible and robust then. In upcoming blog posts I will discuss these preliminary outcomes in more detail. However I can already say that roughly speaking my data-set indeed conforms with known differences in Trans-Atlantic slave trade patterns between South Carolina and Virginia in particular.
This can be verified from Table 6 by contrasting the South Carolina and Virginia group averages for “Senegambian & Guinean” (12% vs. 7.4%) as well as “Ghanaian, Liberian & Siera Leonean” (26.6% vs. 21.1%) on the one hand. Suggestive of a greater pull towards Upper Guinea (also incl. Sierra Leone and Liberia!) for South Carolina. On the other hand the clear difference in “Nigerian” scores (29.4% vs. 41.8%) seems to be even more so corroborating a greater Bight of Biafra connection for Virginia. Also noteworthy is that the frequency of primary “Nigerian” scores was 20/20 for Virginia; 15/20 for Louisiana and “only” 13/20 for South Carolina.
The differences for Central African & Southeast African DNA might not yet be as pronounced. Probably because of the sub-optimal ability of 23andme to detect such DNA in its 2018/2019 version. Still the 12.9% “Angolan & Congolese” group average for South Carolina does stand out somewhat already. And this outcome is most likely to be associated with Central Africa being the greatest documented source of Trans-Atlantic Slave trade for this state. The differences in group averages for “Southern East African” are of course minimal and appear to be trivial (1% vs. 1.3%). But possibly especially higher outliers among my Virginia survey participants may already be associated with an expected greater Madagascar connection for this state. As was also indicated by Virginia’s slightly more noticeable “Southeast Asian” admixture (see Table 2).
***
Table 7 (click to enlarge)

Trans-Atlantic Slave Trade Database (2020) (www.slavevoyages.org). For more discussion and similar overviews see this page.
***
For Louisiana the additional importance of Intra-American and Domestic Slave trade seems to have carried more weight than Trans-Atlantic Slave trade (see this blog post). Which is causing their group averages to be quite similar to my overall findings for African Americans. Something which I already observed during my previous Ancestry survey. But still quite striking to see that yet again Louisiana’s group average for “Senegambian & Guinean” is conforming with nationwide averages (9.7% vs 9.2%, see Table 6). Especially given that Louisiana’s Upper Guinean origins are always well celebrated. Possibly such Senegambian lineage is more concentrated in people with roots to be traced back mostly to the French/Spanish colonial period. Dating from prior to the demographically very impactful Louisiana purchase in 1803. Which would concern Louisiana Creoles especially I imagine. In fact the only result in my survey featuring “Senegambian & Guinean” as biggest African region probably belongs to a quite likely Creole person from Texas.
Outside from these three key states generally speaking there seems to be a great deal of similarity in the African breakdown (scaled) across the USA. Regionally blended and with some variation naturally. But still quite consistent in its main components. Which seems plausible given the relatively high mobility and intermingling of African Americans across the generations. Continuing into the present day. But more fundamentally this outcome also seems to highlight the additional significance of Domestic Slave Trade and early occurrence of cumulative population growth among African Americans, especially in and around Virginia.
Ever since my survey on Ancestry I have been intrigued by the question of establishing which regional slave trade patterns have been more influential when taking African Americans as whole: those from South Carolina (varied but more so tending towards Upper Guinea & Central Africa) or those from Virginia (varied but more so tending towards Bight of Biafra). I am hopeful that improved admixture testing as well as African DNA matching patterns will eventually provide us with clearer answers. But the outcomes on Ancestry (2013-2018 version) as well as from this current 23andme survey (based on the 2018 version) already seem to suggest that Virginia’s impact has been greater than perhaps often imagined. Domestic Slave Trade and early founding effects are likely to have played a crucial role indeed!
I have insufficient data at this moment to make any conclusive statements but I aim to further investigate this topic of which regional African slave trade patterns have been most impactful on the overall African American genepool: those from Virginia or those from South Carolina. Of course I do realize things might be more complex and other factors may play a role as well. But this could very well offer a (partial) explanation for the high frequency of primary “Nigeria” scores among most African Americans. As established within my current survey this frequency was 81% for my overall group (162/200). And even 100% for my Virginia subgroup (20/20). However quite tellingly it was only 65% (13/20) for my South Carolina subgroup!
Learning more about the approximate genetic contribution of either Virginia or South Carolina in other USA states might very well be crucial in obtaining a greater understanding of African Americans as an ethnic group in their own right. Not only in regards to their African origins. But also I imagine in regards to the formation of mainstream African American culture and how it evolved later on. And possibly even how some minor non-African admixture may have originally occurred in the Virginia/Maryland area and later on (due to either forced or voluntary migrations) was dispersed among African Americans nowadays living in other states. This could be relevant not only for European admixture (possibly also involving early contacts with indentured servants?). But also heavily diluted Native American DNA may often be traced back to the 1700’s I suppose. And perhaps most intriguingly also the Madagascar connection for many African Americans may often have been initiated in or around Virginia. For more info:
- African-American Migrations (In Motion: The African-American Migration Experience)
- Slave Voyages: not only Trans-Atlantic but also Intra-American!
- The Igbo Connection for Virginia & Virginia-Descendants
Compare also with my previous Ancestry survey findings. Do keep in mind that my sample size for Louisiana and South Carolina was greater on Ancestry. In 2018 I had managed to collect 68 results from South Carolina (a few also from Georgia), 14 results belonging to self-identified Gullah persons. For my Louisiana surveygroup on Ancestry I included a greater share of Louisiana Creoles. Possibly 26 out of 43 persons in 2018 when I finished my Ancestry survey. While on 23andme it is possibly 4 out of 20.
- Blog posts
- Regional variation according to USA state origins? (scroll down to section 5)
- South Carolina 23andme results (2020 version)
- Charts
- Spreadsheets
- African American 23andme results (2018 version) (online spreadsheet, sorted on state origins)
- Louisiana AncestryDNA results (2013-2018 version) (online spreadsheet)
- South Carolina AncestryDNA results (2013-2018 version) (online spreadsheet)
- Virginia AncestryDNA results (2013-2018 version) (online spreadsheet)
Recent Ancestor Locations
Table 8 (click to enlarge)

This overview is showing how many times a particular Recent Ancestor Location (RAL) was reported by 23andme for my 200 African American survey participants. In fact I did not always have access to this data. So I was only able to verify for 135 persons in my survey. Out of that subgroup many people received RAL’s confirming their partial British/Irish admixture. Also often Caribbean RAL’s showed up suggestive of various ancestral scenario’s actually. Most evocative perhaps that 4 persons received Nigerian RAL’s as a more solid confirmation of their Nigerian lineage.
***
____________________
“These regions will provide you with information about your more recent ancestry, giving you insight into where your ancestors likely lived during the last 200 years“ (Source: 23andme)
____________________
I have also kept score of the Recent Ancestor Locations (RAL) being reported for my survey participants (see columns AA-AC in my online spreadsheet). At least for those people I was able to verify. As actually for 65 people I did not have access to this data. Also within the screenshots shown below these recent ancestral locations have been highlighted by myself. Potentially a very useful feature (based on DNA matching strength) but only to be taken as indicative. Due to a skewed reference database based on the self-reported origins of 23andme’s customers its predictions will sometimes not be perfectly in line with known family origins. For greater understanding it is advised to read this article on 23andme’s website:
- Recent Ancestor Locations (23andme Customer Care)
Unlike for other parts of the world 23andme currently does not assign RAL’s within the USA. Even when this could be very helpful! Especially for determining your earliest known state origins within the USA. Not always known to people who have not done any extensive family tree research yet. But such info can be very beneficial to correlate with associated slave trade patterns. On Ancestry a similar feature of so-called genetic communities or migrations is already in place also for African Americans. And they are quite detailed! Currently 94 African American and Afro-Caribbean groups being distinguished (see this link). Ancestry usually gets it right from what I have seen. But at times you may not always get assigned to the migration you expected.
The same thing might very well also happen on 23andme when they introduce RAL’s for the USA eventually. Perhaps even more frequently so because 23andme’s predictions on sub-national level tend to be over-ambitious. Often reflecting rather the self-reported origins of 23andme customers who tend to hail from certain overrepresented areas within a given country. So for example the British RAL’s reported for African American often tend to specify London. Although interestingly also a few times RAL’s in Scotland were mentioned.
Keeping this minor flaw in mind I still find the RAL feature to be very informational. As can be seen in Table 8 British & Irish RAL’s have been most frequently reported for African Americans in my survey. In line with prior expectations. As reflected also in actual regional admixture scores for “British & Irish” being predominant within the European breakdown. I have not observed any reporting of other European countries as RAL. Except the Netherlands however this was for a person not included in this survey. Of course this does not rule out any additional European family line existing in individual cases. Remarkably the genetic community tool on Ancestry does not tend to report any European migrations for African Americans, as far as I am aware. For more discussion:
Correct interpretation of these RAL’s is essential, as always. Because sometimes the implied origins might actually be the other way around due to unexpected ancestral migrations or shared ancestry from other places. Dating back to colonial times even. This will be especially relevant for the Jamaican and other Caribbean RAL’s reported for (multigenerational) African Americans on 23andme. I verified to the best of my capabilities that my African American survey participants did not have any recent Caribbean ancestry. Atleast not within the last 2 generations (see footnote 1). Still especially Jamaican RAL’s were quite common in my survey (25/135).
To repeat myself this RAL feature is not meant to be conclusive! The prediction being based on DNA matching strength. This is of course indicative of shared ancestry. However it does not per se say anything about who those shared ancestors were. Or where they came from! Due to all sorts of migrations (incl. involuntary ones) there are always multiple scenario’s to keep in mind. Generally speaking when looking into Caribbean RAL’s/DNA matches for African Americans I think one of the following options may apply. To be verified by your own follow-up research:
1) Shared African lineage, whereby one ancestor ended up in the Caribbean and his or her relative ended up in North America
2) Shared European lineage, whereby one European ancestor left offspring in both the Caribbean and in North America
3) Shared Caribbean ancestry to be traced back to inter-colonial slave trade (see this blogpost)
4) Shared Caribbean ancestry to be traced back to voluntary migrations from the late 1800’s/ early 1900’s onwards
5) Shared African American ancestry due to African Americans migrating to or passing through the Caribbean (both during Slavery and afterwards) and leaving offspring there.
***
19 Recent Ancestral Locations to pinpoint African lineage!

Currently 23andme provides RAL’s for 19 different African countries. Not shown in this overview but also incl. Madagascar under the Asian breakdown. Often also offering further specification on a sub-national level! Within this survey only Nigerian RAL’s were reported. But potentially they can be from other countries as well! Because only relatively few Africans are included within 23andme’s reference database the odds of being assigned to an African RAL are currently quite low though. Source: 23andme’s Ancestry Composition page (scientific details tab).
***
A very special outcome of my survey (n=200) was to see actual Nigerian lineage being confirmed by Nigerian RAL’s for 4 African Americans. Of course the previous disclaimers I discussed still apply. To be kept in mind especially that these RAL’s are based on DNA matching strength with customer samples from within 23andme’s inherently limited database. Because only relatively few Africans are included within 23andme’s reference database the odds of being assigned to an African RAL are currently quite low though. Such African RALs were also quite uncommon for my other Afro-descended survey groups. But this did still happen with some frequency. For example 6 times for 43 Jamaican results. And among 30 Haitians I observed an African recent ancestral location for two people.
Each time confirming and sometimes even specifying Nigerian lineage on a state level. Very valuable results therefore. Even when the actual state level may not be 100% accurate. To be kept in mind that Nigerians themselves of course also have been migrating and intermingling across the generations! Still it could be very indicative already to know if the RAL will be pinpointing a state somewhere in southwestern Nigeria or rather in southeastern Nigeria. As such information might greatly correlate with the odds of having either Yoruba or Igbo lineage! For my African American survey group it seems that 1 time (Ogun state) Yoruba lineage is being suggested, while twice (Imo & Enugu state) it was rather Igbo lineage which seems plausible. See also:
Regrettably I have not yet seen RAL’s mentioning other African countries besides Nigeria. But as shown in the overview above potentially this can happen for 19 African countries! Despite a few shortcomings I therefore believe this RAL feature holds great potential for further specification of African lineage in future updates. Although the implied timeframe has to be expanded from the current 200 years to atleast the 1700’s. Which is afterall the most relevant time period when wanting to Trace African Roots for African Americans (see this chart).
______________________________________________________________________________
3) African American Results
As far as I know and was able to verify all of these screenshots below are from African Americans with 4 USA-born grandparents. Unless mentioned otherwise. Meant to illustrate the individual variation among Americans in the first place. But given that my sample size (n=200) is quite robust these results will usually also be quite representative. Even more so because they are from people with family origins all over the United States.
I will not post all 200 results as that might be too much to scroll through 😉 Instead I have picked a selection which I believe is most illustrative of the main patterns as well as showcasing some of the outliers. Consult my spreadsheet for a complete overview. The results have been arranged from highest degree of African admixture to lowest. But I am starting first with a small grouping based on state origins within the USA. I mention such state origins whenever such details were available to me. But naturally I did not have perfect information about everyone’s complete family tree. So the headings on top of the screenshots are only meant as an approximation of recent family origins! Even when actually for many people I was able to find confirmation from their 23andme profile page about the state origins for all 4 grandparents.
I like to thank again all the persons who kindly agreed to share their results with me. In particular I want to give a shout-out to Teresa and X! Their great help has been essential for my efforts to collect a representative sample group of 200 African Americans 23andme results! I am truly grateful for it! Follow the links below to get in tune with all sorts of highly valuable online resources made available by African American genealogy bloggers:
-
- African-American/African Descent Genealogy Blogs (Radiant Roots, Boricua Branches)
- BlackProGen (YouTube, Web series for and about people of color genealogy and family history research)
***
AFRICAN AMERICAN (Virginia)
***

2018 version. Quite typical results. Especially for my Virginia subgroup. The prominent “Nigerian” scores are a common theme for many African Americans. For Virginians in my survey the frequency of primary “Nigerian” scores was even 100% (20/20). However for other African Americans also “Ghanaian, Liberian & Sierra Leonean” is at times showing up in first place within the African breakdown. Most likely correlating with (ultimate) state origins. Do also notice that secondary regions such as “Angolan & Congolese” can still be substantial (>10%) as well. Such scores indicative of Central African DNA are likely to increase for many people after the 2020 update.
***
AFRICAN AMERICAN (South Carolina)
***

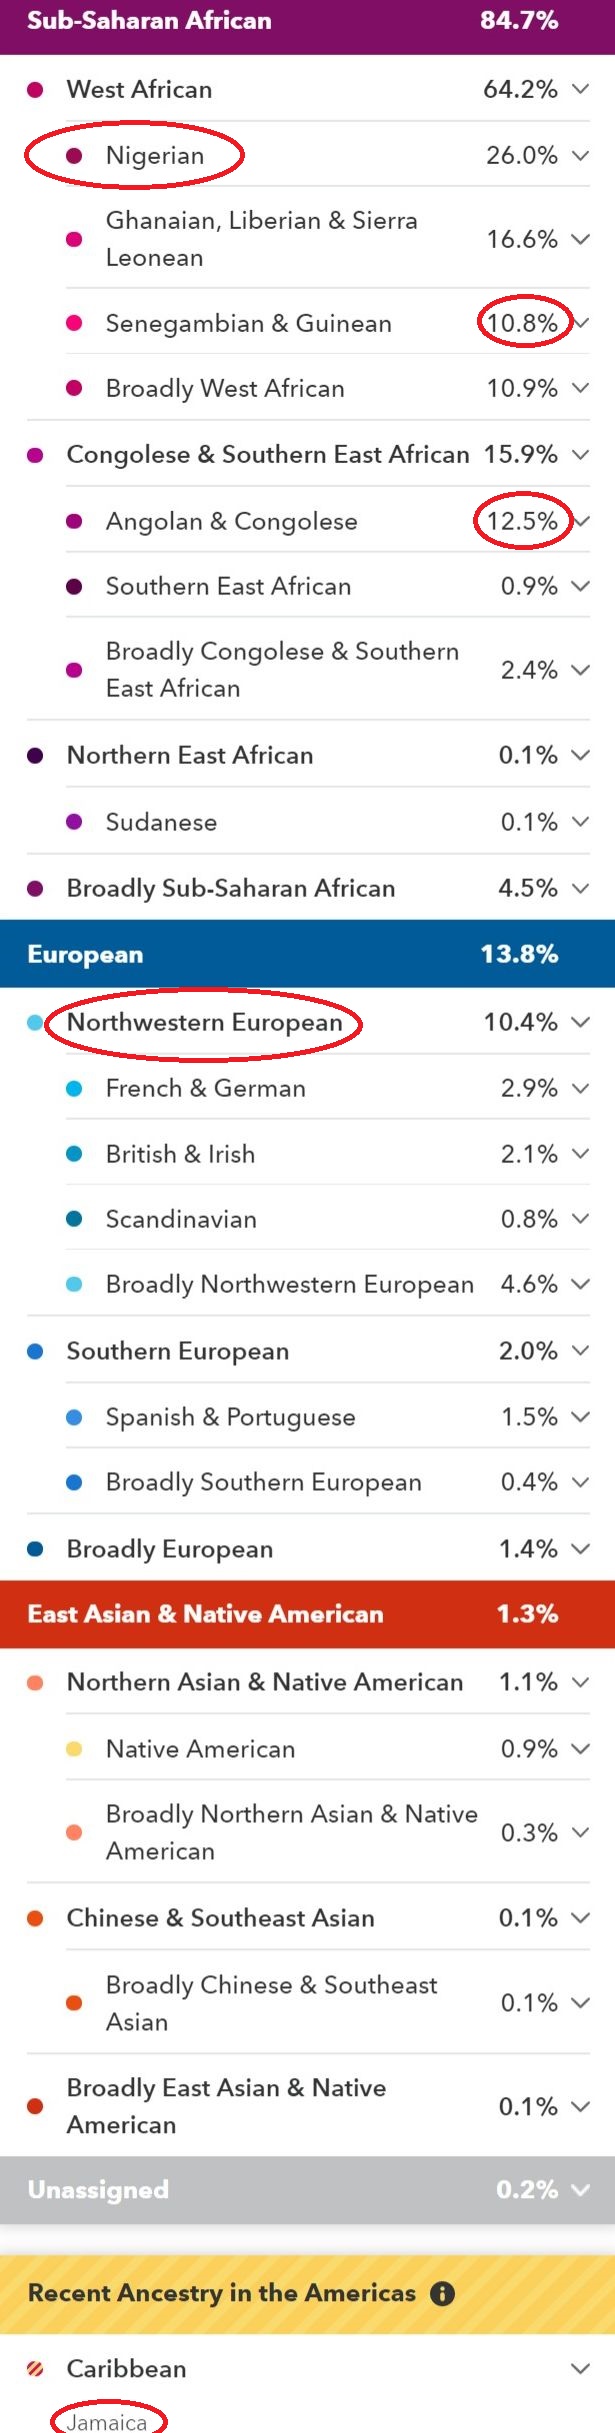
2018 version. For 7 persons out of 20 (35%) in my South Carolina subgroup “Ghanaian, Liberian & Sierra Leonean” is showing up as primary region. This frequency is possibly more pronounced in South Carolina due to known slave trade from both Sierra Leone and Liberia being relatively more important than elsewhere in the USA. Interestingly Haiti is mentioned as RAL. However this could reflect several ancestral scenarios. Due to migrations going in both directions across the generations (see this page and this one). In fact it might also indicate shared African lineage, possibly Central African?
***
AFRICAN AMERICAN (Texas: Louisiana Creole?)
***

2018 version. This could possibly be representing a Louisiana Creole profile by proxy. As this person is from Texas, Liberty County (4gp) which intriguingly was settled by Creole migrants in the mid-1800’s! Either way these results are truly singular within my survey for several reasons. It is the only time “Senegambian & Guinean” is showing up as biggest region within my survey. Historically plausible, although actually for my other Louisiana Creole survey participants this region was more subdued. Second stand-out aspect is the European breakdown which is greatly suggestive of French/Spanish lineage. And finally the amount of Native American admixture is also the highest in my survey.
***
AFRICAN AMERICAN (South Carolina)
***
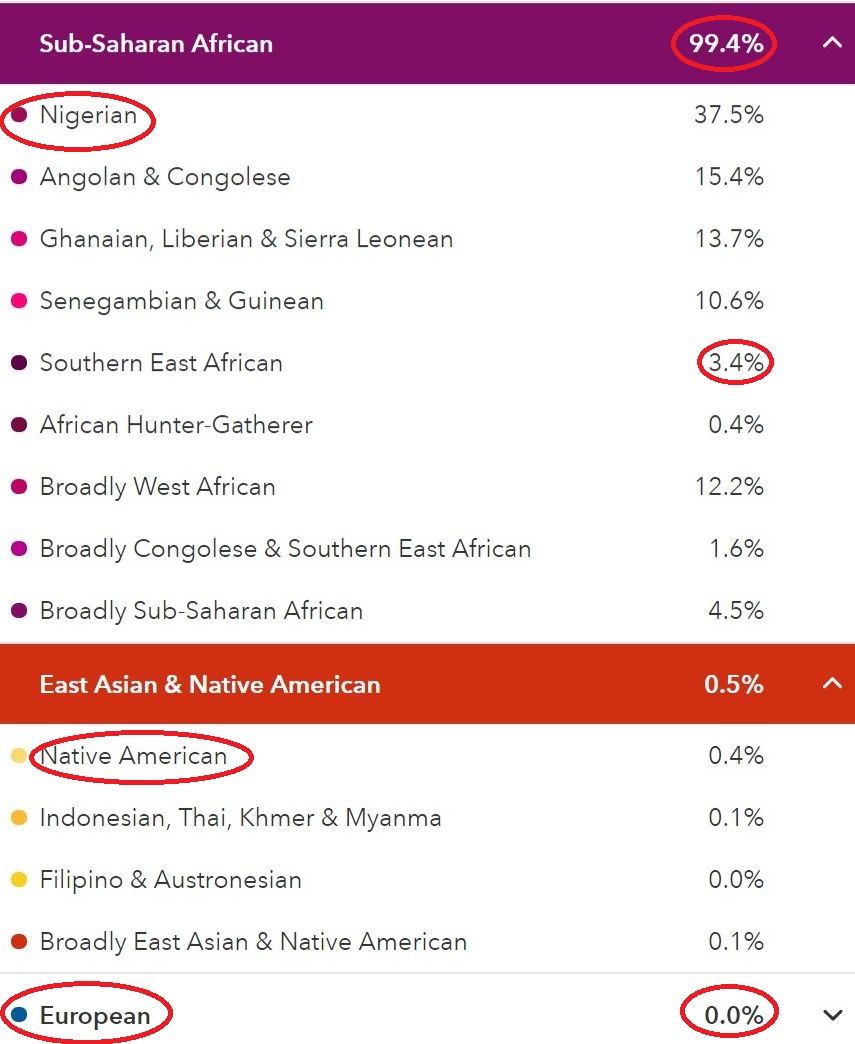
2018 version. This profile shows the highest amount of African admixture in my survey. Notice that additionaly only a tiny amount of Native American is appearing and even 0.1% Southeast Asian admixture but no European admixture at all! Underlining that such profiles do exist, unlike persistent reports to the contrary. Also interesting that this person is from a place located more inland within South Carolina state. The particular settlement history of Sumter county may possibly account for this person’s relatively elevated level of “Nigerian”. It might very well be that within South Carolina further substructure exists. Especially when contrasting with the possibly more distinctive patterns from the Lowcountry. Btw the “Southern East African” score for this person was also the highest in my survey.
***
AFRICAN AMERICAN (South Carolina)
***

2019 version. Not included in my 2018 survey. Although actually this 2019 update hardly caused any noteworthy changes for most African Americans. Another nearly 100% African profile without any European admixture! Also yet again from South Carolina (4gp). Even when in my previous survey based on AncestryDNA results I did also observe 100% African profiles from other states, such as Georgia and Florida. Unlike the previous profile this person is showing a more pronounced Upper Guinean as well as Central African imprint. In fact with the 2020 update this person’s “Angolan & Congolese” score has even become primary with 28.2%!
***
AFRICAN AMERICAN (Texas)
***

2018 version. This person does show some minimal European admixture but otherwise of course a strikingly high degree of African ancestry for this confirmed multi-generational African American from Texas. Illustrating that such profiles are not exclusive to South Carolina! The impressive level of nearly 51% “Nigerian” might actually be somewhat atypical for South Carolina and more so in line with Virginia’s African breakdown. It is easily the highest “Nigerian” score in my survey, scaled and unscaled. “Coastal West African” is the former name of “Ghanaian, Liberian & Sierra Leonean”, which was merely a superficial name change.
***
AFRICAN AMERICAN (North Carolina, South Carolina, Virginia)
***

2019 version. Amazing specification of Nigerian lineage for this person (4gp USA-born) by way of a recent ancestral location zooming into Nigerian state level! Imo state being located in southeastern Nigeria. Very likely that a Igbo connection is being suggested therefore. One does need to fully understand the methodology used by 23andme to arrive at this impressively detailed prediction. Also to be kept in mind that naturally it will not be in contradiction of any other additional origins being from other parts of Nigeria. Still a wonderful outcome! With further refinement this tool looks very promising for zooming into specific African lineage in future updates!
***
AFRICAN AMERICAN
***

2018 version. Another person (4 confirmed USA-born grandparents) with a Nigerian RAL specification on statelevel! Enugu state also being suggestive of an Igbo connection. But not conclusively! Interestingly “Nigerian” is not the biggest African region for this person. Of course it would have been even more awesome if also “Ghanaian, Liberian & Sierra Leonean” had been specified by a RAL. Hopefuly in future updates! The RAL for Trinidad & Tobago is also noteworthy. However the ancestral implications are much more ambivalent as it could actually also be the other way around. Because Trinidad has a very intriguing community of originally African American migrants from the 1800’s, socalled Merikins. Either way after the 2020 update this Caribbean RAL is no longer showing up as it was most likely based on shaky grounds.
***
AFRICAN AMERICAN (North Carolina & South Carolina)
***

2018 version.
***
AFRICAN AMERICAN (Georgia & South Carolina)
***

2018 version. Highest “Ghanaian, Liberian & Sierra Leonean” score within my survey. Probably no coincidence that it should be for a person with SC/GA state roots (atleast 4gp). As this area has a well known Sierra Leone connection! However in fact also other types of lineage could be indicated aside from what is already being mentioned in the labeling. Given that 23andme currently lacks any category for interior West African DNA. See for example this screenshot of the 23andme results for a Malian/Guinean person.
***
AFRICAN AMERICAN (North Carolina & Virginia)
***

2018 version. Above average score for “Nigerian”. This person being of mixed VA/NC state origins (atleast 4gp). I have not yet looked into it systematically however it should be very interesting to investigate if North Carolina’s African roots are more similar to either Virginia or South Carolina. Given that this state is located right in between and depended mostly on domestic (overland) slave trade naturally things might be intermediate in many cases. However I have a hunch that for most parts of NC it will be Virginia’s slave trade patterns which have been most impactful.
***
AFRICAN AMERICAN (Georgia, Kentucky, Texas)
***

2018 version. Quite typical but still distinctive Central African as well as Southeast Asian scores. Minor but still clearly detectable scores greater than 1% for Southeast Asian admixture appeared for almost 20% (38/200) of my survey group. Not limited to any particular state per se, as shown by this example. But dispersal of this most likely Malagassy derived component probably occurred because of Domestic Slave Trade.
***
AFRICAN AMERICAN (Louisiana)
***

2018 version. Overall speaking (leaving Creoles aside) it might turn out that many African Americans from Louisiana will be quite comparable to African Americans elsewhere. Possibly a somewhat higher incidence of “Ghanaian, Liberian and Sierra Leonean” as I also observed during my Ancestry survey. But otherwise because of Domestic Slave Trade they will often have much in common afterall. On the other hand this person for example does know atleast part of his family lived in Louisiana already prior to the Louisiana purchase in 1803. And his breakdown appears quite distinctive indeed, featuring a relatively subdued “Nigerian” score. After the 2020 update his “Angolan & Congolese” practically doubled btw, from 12.1% to 21.1%!
***
AFRICAN AMERICAN (Mississippi & Georgia)
***

2018 version.
***
AFRICAN AMERICAN (Washington?)
***

2018 version. Minor but still distinctive “Southern East African” score. One of the highest in my survey, only 9 persons showing more than 2%. When combined with the equally minor Southeast Asian admixture quite likely pinpointing a Madagascar connection. Preferably to be validated by finding any associated Madagascar DNA matches.
***
AFRICAN AMERICAN (Tennessee)
***

2018 version. Pretty straightforward results. Greatly in line with my overall group averages. Although minimal still interesting to also see a distinctive “South Asian” score. Such admixture was less frequently appearing than Southeast Asian admixture and also not beyond trace level. This particular result featuring the maximum score within my survey. Still by looking into associated DNA matches you might be able to corroborate strongly diluted South Asian/Gypsy lineage.
***
AFRICAN AMERICAN (North Carolina)
***

2018 version. African Americans will often show great overlap in their main African regions when compared with Jamaicans. In particular primary “Nigerian” scores. However one standout feature for many African Americans will be their usually more elevated “Senegambian & Guinean” scores. In this case reaching double digit level. Something which I have yet to observe among Jamaicans. The (scaled) group average for this region being only 2.8% among 43 Jamaicans I surveyed (see this page).
***
AFRICAN AMERICAN (South Carolina & Texas)
***

2018 version.
***
AFRICAN AMERICAN (Minnesota)
***

2018 version. Although Jamaicans and African Americans will often show similar results it is apparent that African Americans show greater variety and more balanced results. For understandable reasons of course. Aside from more elevated “Senegambian & Guinean” scores also often featuring more elevated “”Angolan & Congolese” scores. The Jamaican RAL is interesting within itself. But it is also quite ambivalent as it might signal various ancestral scenario’s based on DNA matching strength!
***
AFRICAN AMERICAN (Illinois, Ohio, Pennsylvania)
***

2018 version.
***
AFRICAN AMERICAN (Tennessee)
***

2018 version.
***
AFRICAN AMERICAN (North Carolina & South Carolina)
***

2020 version. Recently updated results, not included in my 2018 survey. Easily spotted by looking into the European breakdown which has been completely homogenized now. “Unassigned” and “Broadly..” scores have been greatly diminished for the most part. Otherwise what is most striking is of course the astonishingly high “Angolan & Congolese” score of practically 35%. The 2020 version of 23andme probably has improved detection of Central African DNA. In the 2018/2019 version this person already had an above average score for “Angolan & Congolese” though: 18.3%, see also this screenshot.
***
AFRICAN AMERICAN (Michigan)
***

2018 version.
***
AFRICAN AMERICAN (Florida)
***
2018 version. Despite the ambivalent Jamaica RAL (follow-up research always required!) the breakdown looks distinctly African American for this person with 4 Florida-born grandparents. Interesting that “French & German” is higher than “British & Irish” but again family tree research will be most helpful when wanting to make sense of this inconclusive outcome. With the 2020 update it could very well be that this person’s European breakdown has been homogenized to reflect only “British & Irish”.
***
AFRICAN AMERICAN (Illinois & Mississippi)
***

2018 version.
***
AFRICAN AMERICAN (Arkansas)
***

2018 version. Amazing specification of Nigerian lineage for this person (4gp Arkansas-born) by way of a RAL zooming into Nigerian state level! Ogun state being located in southwestern Nigeria. Very likely that a Yoruba connection is being suggested therefore. Given that this RAL feature is suggestive of ancestry from within the last 200 years possibly also to be associated with illegal slave trade carried out after 1808? Bight of Benin slave voyages being more frequent then (e.g. Clothilde!). Naturally such a specific RAL will not be in contradiction of any other additional origins being from other parts of Nigeria. Especially Igbo roots from the 1700’s still being very much possible as well. Preferably to be confirmed by finding associated DNA matches (see this page). Which should also be very beneficial for this person’s Madagascar connection which is quite apparent already actually.
***
AFRICAN AMERICAN (North Carolina)
***
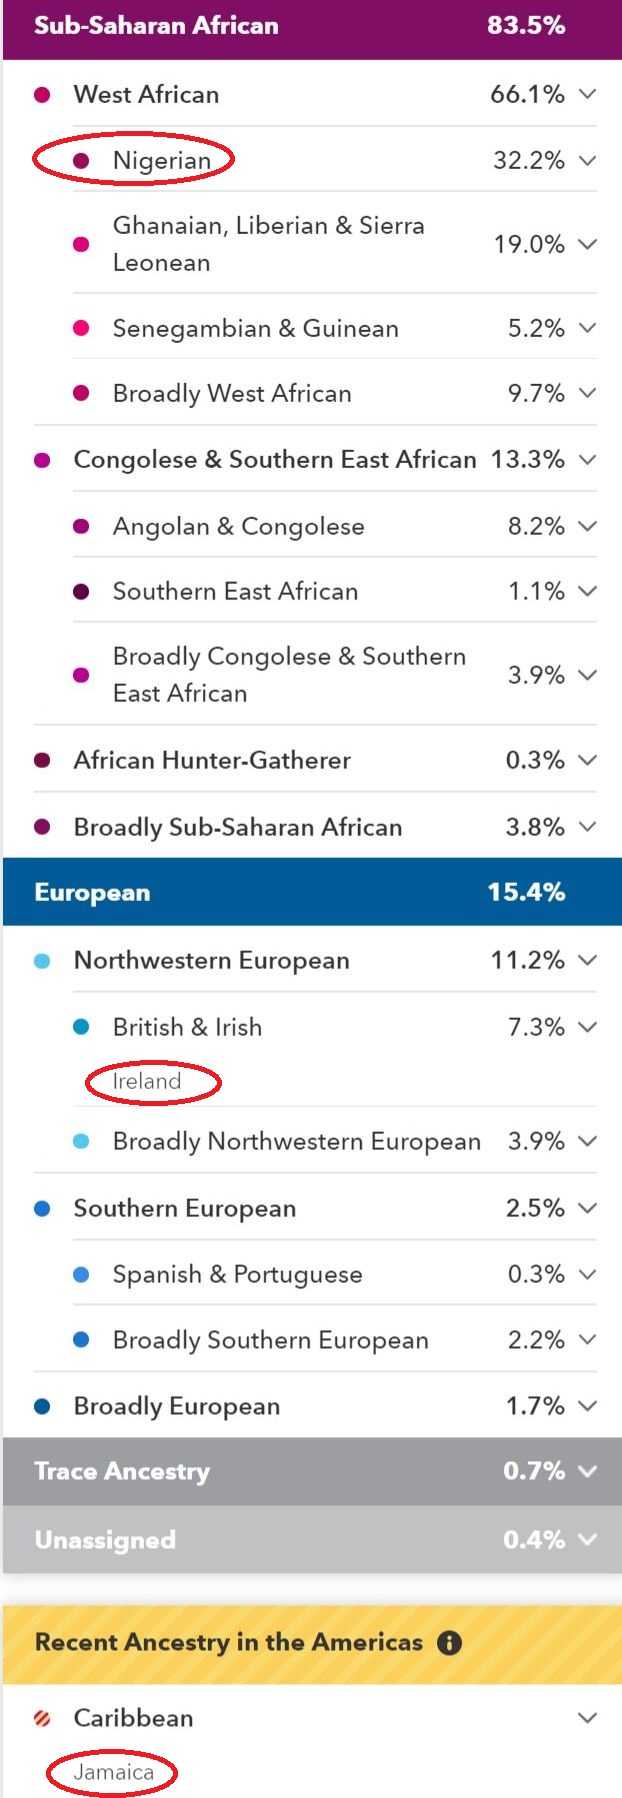
2018 version. Aside from the Jamaican RAL notice also that Ireland is being mentioned as RAL. This happened quite frequently in my survey, usually along with United Kingdom. Also when actual European admixture was not that high.
***
AFRICAN AMERICAN (Maryland)
***

2018 version. One of the highest “Senegambian & Guinean” scores within my survey. The highest score was 20.4%. Quite uncommon to see it appear as second biggest African region. Also remarkable that otherwise this person’s African breakdown is quite evenly balanced. Another noteworthy aspect that this person has a quite likely Malagasy haplogroup: M7c3c. A Madagascar connection already being suggested by both Southeast Asian and Southeast African admixture.
***
AFRICAN AMERICAN (Ohio)
***

2018 version. Aside from usually minimal Native American and Southeast Asian scores 23andme also at times reported trace admixture of “South Asian” and “Western Asian & North African” for my African American survey group. However with much less frequency and also not exceeding a minimum level of 1% , except for one time! The maximum score of “North African” only being 0.5% while for “South Asian” it was 1.4%. Which is why I have not provided more detailed statistics for these categories. At such a low level there will always be chances it might be a misreading. However by systematically scanning for associated DNA matches strongly diluted North African lineage (inherited by way of Fula ancestors) and South Asian (Gypsy!) lineage can be made plausible in fact!
***
AFRICAN AMERICAN (Mississippi)
***

2018 version.
***
AFRICAN AMERICAN (California)
***

2018 version.
***
AFRICAN AMERICAN (Georgia)
***

2018 version. Distinctive “Senegambian & Guinean” score representing nearly 20% of this person’s African breakdown (15.4/79.7). Georgia’s African regional roots most likely quite similar to those for neighbouring South Carolina.
***
AFRICAN AMERICAN (Alabama)
***

2018 version.
***
AFRICAN AMERICAN (Virginia)
***

2018 version. One of the highest Southeast Asian scores in my survey. Probably not by coincidence that it should be for a person from Virginia. As argued on this page I greatly suspect that even Southeast Asian scores smaller than 1% might already be suggestive of a widespread Madagascar connection among African Americans. But at this more robust level of almost 3% and also given a fitting local historical context it is practically certain that this person has Malagassy lineage. To be corroborated by finding associated DNA matches and possibly also dedicated family tree research going beyond the 1800’s might prove valuable! See also this very inspriring article.
***
AFRICAN AMERICAN (Kentucky)
***

2018 version.
***
AFRICAN AMERICAN (Pennsylvania)
***

2018 version. One of the highest scaled “Nigerian” scores in my survey. It represents a relative share of about 50% (=37.3/74.5) of the African breakdown. Also remarkable and atypical amount of “Eastern European”. Even when the country labeling is not always to be taken too literally 23andme’s predictions on a macro-regional level will often be quite accurate! With some dedicated familytree research and/or searching for associated DNA matches this person could very well trace back this part of his European DNA. Possibly pinpointing a greatgreat grandparent (1/16) from the late 1800’s?
***
AFRICAN AMERICAN (Tennessee?)
***

2018 version. British RAL’s have been most common in my survey (51/135). Obviously first of all because European reference samples are much more numerous than African ones within 23andme’s database. But otherwise also in line with common knowledge about the origins of European admixture among African Americans.
***
AFRICAN AMERICAN (Virginia)
***

2018 version.
***
AFRICAN AMERICAN (Ohio)
***

2018 version.
***
AFRICAN AMERICAN (Michigan)
***

2018 version. The African breakdown is quite regular. The 0.4% “Northern East African” is however one of the highest such scores I have seen among African Americans. Although still of course only a tiny amount of DNA. For most people it is simply absent. This is most likely a mislabeled category for Atlantic Diasporans. Rather suggestive of Sahellian West African lineage due to (very) ancient geneflow with Nilo-Saharan or Chadic speakers. Also distinctive Native American score btw. About 10% (18/200) of my survey group received Native American scores greater than 2%.
***
AFRICAN AMERICAN (North Carolina)
***
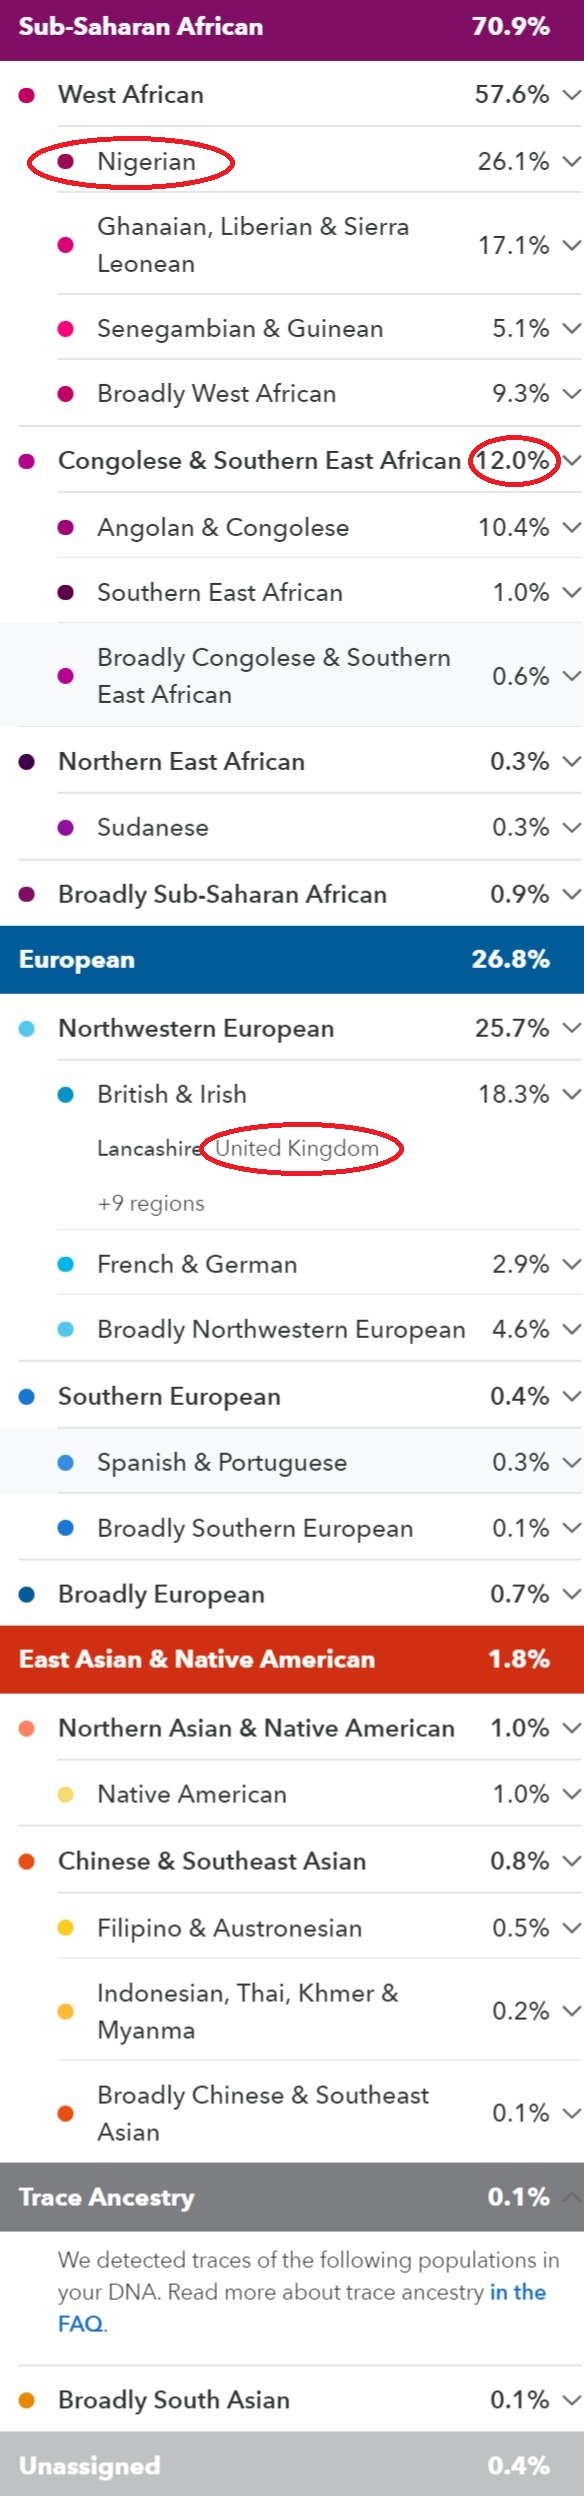
2018 version.
***
AFRICAN AMERICAN (Pennsylvania?)
***

2018 version. Only four persons in my survey received Nigerian RAL’s as a more solid confirmation of their Nigerian lineage.Very valuable outcome therefore! Even when in this case it was not yet specified on a state level.
***
AFRICAN AMERICAN (Georgia, Kentucky, Oklahoma)
***
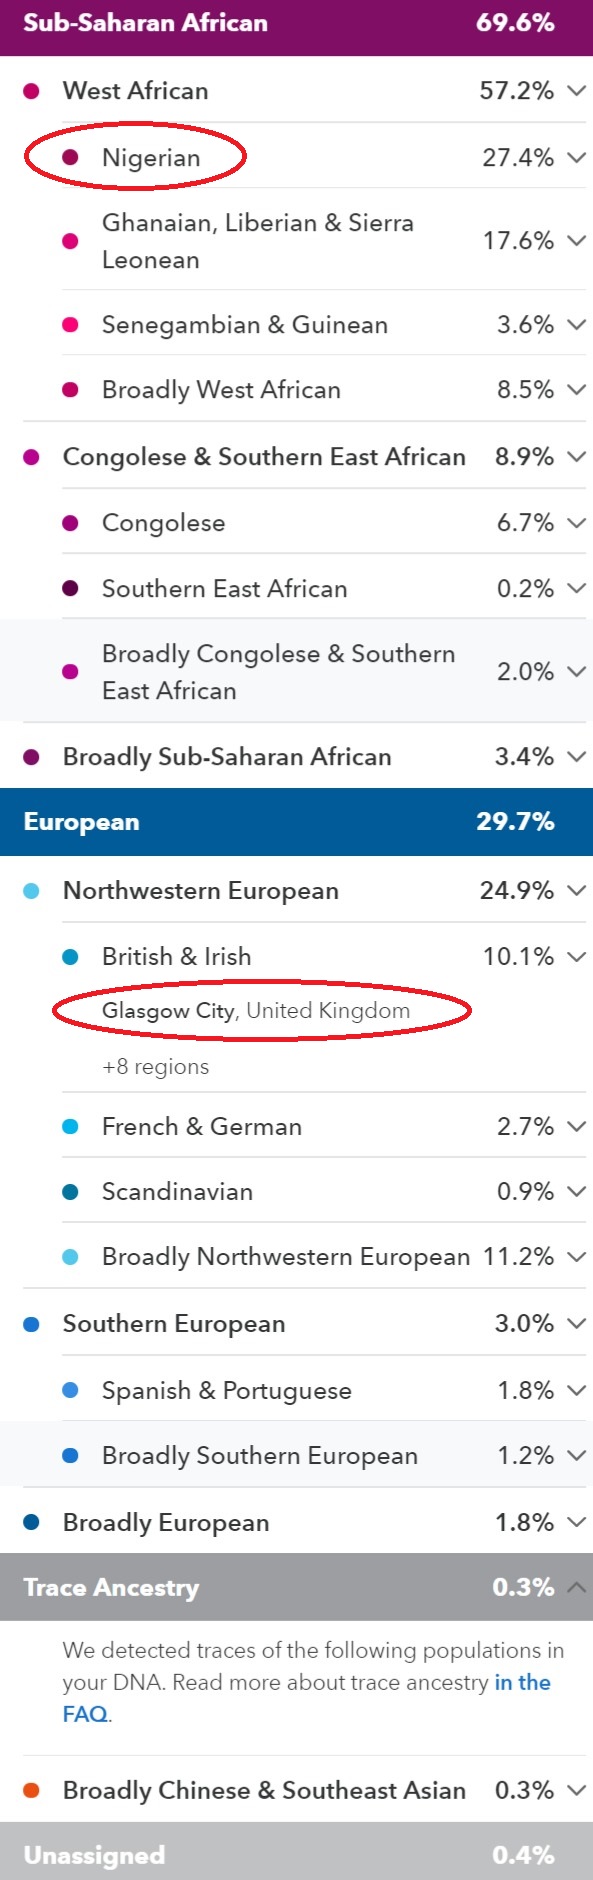
2018 version. The British RAL’s reported for African American often tend to specify London. Probably because 23andme’s RAL predictions on sub-national level tend to be over-ambitious. Reflecting rather the self-reported origins of 23andme customers who tend to hail from certain overrepresented areas within a given country. However interestingly also a few times a RAL suggesting Scottish lineage is being mentioned. Which should be historically plausible as well.
***
AFRICAN AMERICAN (Michigan?)
***

2018 version.
***
AFRICAN AMERICAN (Virginia)
***

2018 version.
***
AFRICAN AMERICAN (Texas & Oklahoma)
***

2018 version.
***
AFRICAN AMERICAN (Louisiana Creole)
***

2019 version. Not included in my survey, which had only 5 possibly Louisiana Creole results (incl. one from Texas). Obviously greater sample size will be needed to establish main tendencies. Still already insightful to see that for this particular person a clearly elevated “Senegambian & Guinean” score is being reported. But also interesting that “Nigerian” is in first place. While also the European breakdown is suggestive of partial Anglo-American lineage. Which might be quite common for other Creoles as well from what I have seen.
***
AFRICAN AMERICAN (South Carolina?)
***

2018 version.
***
AFRICAN AMERICAN (California & Colorado)
***

2018 version.
***
AFRICAN AMERICAN (New Jersey?)
***
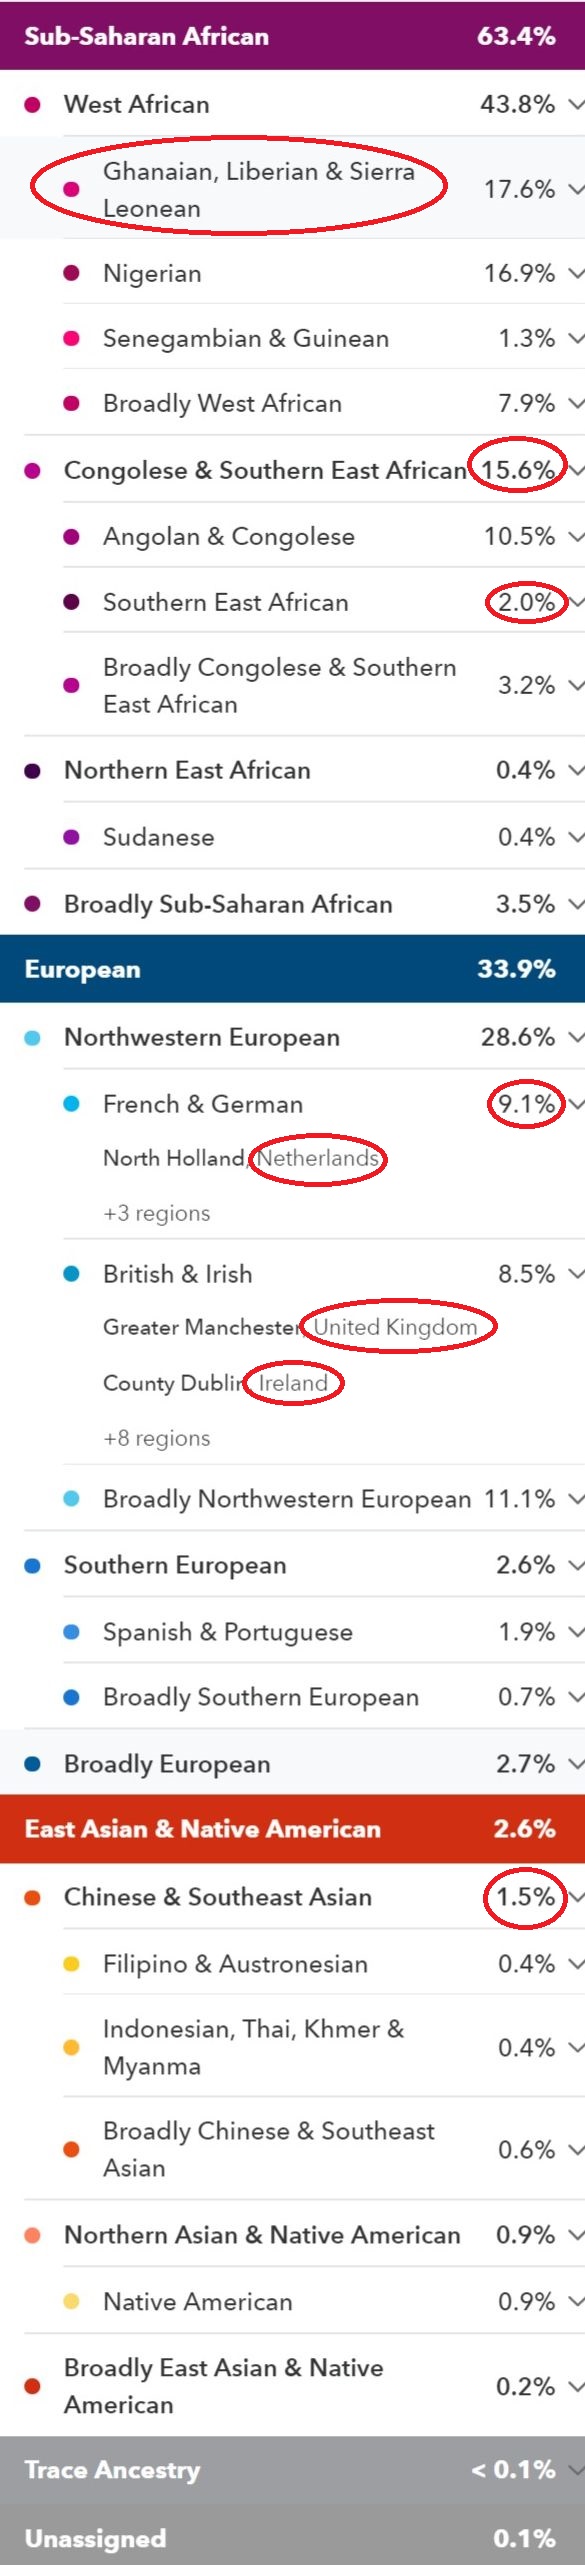
2018 version. I do not have complete details on this person’s background which is why I did not include it in my survey. However I find it very impressive how partial Dutch lineage is being confirmed both by RAL and admixture! Only time I have seen this for African Americans. Perhaps no coincidence that this person could have (partial) roots from New Jersey. As this state was part of the former New Netherland colony. And even when this is to be traced back all the way to the 1600’s still a very intriguing Afro-Dutch legacy has been maintained: Pinkster (see this article). This person is also very likely to have Malagasy lineage btw, probably by way of New York.
***
AFRICAN AMERICAN (Maryland?)
***

2018 version.
***
AFRICAN AMERICAN (Louisiana: Creole?)
***

2018 version. Possibly this person has a Creole background, but I have no certainty about it. Even if so apparently also some Anglo-American lineage is present. As can be verified from the European breakdown. The African breakdown does look distinctive and quite regionally balanced. Also one of the highest Native American scores in my survey.
***
AFRICAN AMERICAN (New Jersey & South Carolina)
***

2018 version. Very special results featuring the second-highest Southeast Asian score in my survey. This person’s Madagascar connection also being corroborated by the additional 2.2% “Southern East African”. And even more so confirmed by her maternal haplogroup: M23! Amazingly her Madagascar connection has actually already been identified by very thorough and innovative genealogical research in 2015. For more details see this article: The DNA Trail from Madagascar to Manhattan (as well as part II).
***
AFRICAN AMERICAN (Virginia & West Virginia)
***

2018 version. Highest scaled result for “Angolan & Congolese” in my survey. It represents a relative share of almost 25% (=14./60.9) of this persons African breakdown. This category was originally labeled just “Congolese” and later on renamed into “Angolan & Congolese”. But this was a mere superficial name change without any impact on the scores themselves.
***
AFRICAN AMERICAN (Pennsylvania, Virginia, West Virginia)
***

2018 version. The following screenshots show total African admixture levels which are on the lower end of the spectrum for African Americans. However take notice that usually the scaled African breakdown is greatly in line with my other survey participants. Underlining the consistency of the main regional patterns I have identified for African Americans as a whole.
***
AFRICAN AMERICAN (North Carolina)
***

2018 version.
***
AFRICAN AMERICAN (Virginia)
***

2018 version.
***
AFRICAN AMERICAN (Virginia)
***

2018 version.
***
AFRICAN AMERICAN (Louisiana Creole)
***

2019 version. Not included in my survey but quite similar to other Creole results I have seen. Family tree research has established that this person also has partial Virginia roots by way of Domestic Slave Trade. Possibly introducing her Madagascar lineage which is showing up in associated admixture but also actually in maternal haplogroup (B4a1a1)! Her European breakdown is being shown as a combination of Northwestern & Southern Europe. After the 2020 update the Southern European part has actually increased to 25.7%! Highly atypical for most African Americans of course but in line with French/Spanish lineage for Creoles.
***
AFRICAN AMERICAN (Louisiana: Creole?)
***

2018 version. Lowest amount of African admixture within my survey. However such scores are quite common for Louisiana Creole results I have seen on Ancestry as well. Obviously greater sample size will be needed to establish main tendencies. Still useful to see that for this particular person “Nigerian” and even more so “Senegambian & Guinean” are subdued. While the primary “Ghanaian, Liberian & Sierra Leonean” might actually also include Malian DNA I suppose. Because 23andme currently does not have any regions in place for pinpointing interior West African lineage. While the European breakdown is again strongly suggestive of partial Anglo-American lineage. As confirmed by the RAL’s for the UK & Ireland. It will be interesting to eventually see France appear as RAL for Louisiana Creoles. Although due to testing restrictions it might be tricky for 23andme to include many French customers in their reference database.
___________________________________________________________________________
Notes
1) The results included in my survey have been shared with me by the DNA testers themselves as well as by friends from among their own matches/connections. And some results were collected by me from social media too. I have naturally taken great care to cut away any name details in order to safeguard everyone’s privacy. Apologies in advance to anyone who recognizes their results and is not comfortable with this blog page featuring them. Please send me a PM and I will remove them right away.
Naturally I verified the background of each sample to the best of my capabilities but I did not have absolute certainty in all cases. Taking a cautious approach and preferring to leave out possible survey participants when in doubt. The profile pages on 23andme actually being very useful for confirming 4 USA-born grandparents. And often also the state origins of my survey participants were verified in this manner. Otherwise I followed the same guideline from my previous Ancestry survey from 2013-2018.
____________________
“As far as I was able to verify all of these African American results are from persons who have two self-identified African American parents. Louisiana Creoles also being included. For the sake of my research I have made an extra effort to make sure this was the case. Naturally I respect everyone’s right to selfidentify as they wish. Persons with one parent being African-American and the other one being either White or from the West-Indies, Latin America or elsewhere are […] not included in the statistics […]. Again beyond the scope of my research no further implications are intended.” (Fonte Felipe, 2015)
____________________
Of course this involves some grey area. Certain subgroups within my survey such as Louisiana Creoles or also South Carolina Gullah, have their own distinctive culture/history and may also choose to identify accordingly. Naturally I fully respect this! However for the sake of my research the criteria which mattered for my USA survey participants were 1) being of multi-generational African descent on both parental sides and 2) having multi-generational family origins within the USA on both parental sides. Again beyond the scope of my research no further implications are intended!
Just as a general disclaimer I should also point out the following. I am aware that ethnicity can be a sensitive topic. My research is purely scholarly. But it also stems from my deep fascination with all parts of the Afro-Diaspora as well as a profound love and respect for all of its vibrant & diverse cultures. I do not condone the misuse of my research for identity politics! And I will also not allow my blog to be used as a platform for any divisive speech or extremists. DNA testing can be very educational and may have many positive effects. However in some cases it may also be abused by narrowminded people with bad intentions.
- Can DNA Ancestry Testing Make You More Racist/Tribalistic? (Scientific American)
2) My survey of African American 23andme results is almost exclusively reflecting results which were obtained after the 2018 update (Ancestry Composition v3.0 & v5.0) In 2019 23andme expanded their reference datasets with South Asian, West Asian and most importantly North African samples. This prompted me to stop my survey because ideally you would want to only collect DNA results produced on the same footing. In order to avoid comparing apples and oranges so to speak. However it actually turns out that this 2019 update (Ancestry Composition v5.2) produced only very slight and marginal changes for most of my survey participants. Nothing profoundly different at all. At least within the African breakdown. See also:
- New African & East Asian Details in 23andMe’s Latest Ancestry Composition Update (August 2018)
- 23andMe Adds 1000+ More Regions and 30+ New Reports for Our Most Refined View of Ancestry To-Date (January 2019)
- 23andMe’s Latest Ancestry Service Adds Diversity and New Features (October 2019)
- The 23andMe Ancestry Algorithm Gets an Upgrade (October 2020)
This page features a selection of these surveyed results. I do actually have more screenshots available. However these were mostly obtained from the DNA Relatives page. And therefore these screenshots are in a less viewer-friendly format (see for example this screenshot). Their results are fully detailed though within my online spreadsheets. I like to thank again all the persons who kindly agreed to share their results with me. In particular I want to give a shout-out to Teresa and X! Their great help has been essential for my efforts to collect a representative sample group of 200 African Americans 23andme results! I am truly grateful for it! Follow the links below to get in tune with all sorts of highly valuable online resources made available by African American genealogy bloggers:
-
- African-American/African Descent Genealogy Blogs (Radiant Roots, Boricua Branches)
- BlackProGen (YouTube, Web series for and about people of color genealogy and family history research)
3) I firmly believe that despite inherent limitations and given correct interpretation 23andme’s regional admixture estimates can be very useful as a stepping stone for follow-up research. And just to get a general idea of where most of your African ancestors hailed from. All according to the latest state of knowledge. Which naturally may be improved upon across time. I find it important to stay positive and focus on what ever informational value you can obtain despite imperfections. Instead of taking an overtly dismissive stance. Preffering to see the glass as half full rather than half empty 😉 You do need to make an effort yourself and stay engaged to gain more insight though!
In particular your follow-up research may include a focus on your African DNA matching patterns and how your African DNA matches may validate or correlate with your regional admixture scores. For example if you find around 10 African matches and 4 of them appear to be Igbo Nigerians then this solidifies and also potentially specifies any major “Nigerian” score you might have obtained. See also:
- African DNA matches reported by Ancestry for 50 African Americans (under preparation)
Furthermore you will want to expand your knowledge about the historically documented presence of Africans in your earliest known places of origin within the Americas. In order to establish the historical plausibility of your 23andme scores. For example if you happen to be African American it is vital to be aware of not only Trans-Atlantic and Intra-American Slave Trade. But also learning about Domestic Slave Trade and Post Slavery migrations will be crucial for your deeper understanding. As actually going by sheer numbers Domestic Slave Trade was most significant for the USA. An estimated 1 million enslaved African Americans (often with Virginia background) are known to have been victimized by the so-called Second Middle Passage (see this link). For more detailed discussion and references see:
- African-American Migrations (In Motion: The African-American Migration Experience)
- Slave Voyages: not only Trans-Atlantic but also Intra-American!
- The Igbo Connection for Virginia & Virginia-Descendants
Any follow-up research is of course to be customized according to your own personal situation and also according to your own research preferences. Plain genealogy is indepensable for dilligently building up a decent family tree. Which is very valuable in itself. But regrettably these strictly genealogical efforts will usually not lead you back all the way to Africa. Save for some rare exceptions (Questlove on Finding Your Roots). Hence why I always insist on avoiding any source snobbery with relation to regional admixture analysis, such as performed by 23andme.
However when duly performed your family tree research will allow you to at least identify your earliest known ancestral locations within the Americas. Which will make it easier to correlate with slave trade patterns and documented African ethnicities for those areas. And if you are very persistent and/or lucky this might also eventually allow you to find localized documentation (plantation records; private correspondence of slave owners; church records; newspaper advertisements about runaway slaves etc.) possibly even mentioning any of your African-born ancestors on 1 single family line!
Combining advanced genetic genealogy techniques such as triangulation and DNA Painter with regional admixture of shared DNA segments also holds great potential in my opinion. As it might enable you to identify an earliest family line associated with such regional admixture! Especially when this regional admixture is distinctive such an approach can be very fruitful. For example when dealing with possible Malagasy lineage the presence of any “Southern East African” and/or Southeast Asian admixture should be very useful. Naturally all of this is to be combined with any other clues you might have. Also it goes without saying that extra scrutiny is always required in order to avoid jumping to conclusions!
For some very useful blog posts with detailed instructions read:
- Pinpointing the Origin of Family’s Igbo Ancestry with DNA (Roots Revealed)
- Using DNA Painter to Verify Igbo Origins (Roots Revealed)
- Got Roots in Madagascar? (Roots Revealed)
- Genetic Genealogical Methods Used to Identify Diaspora Relatives of Members of the Kassena Ethnic Group in Northern Ghana (TAKIR: The African Kinship Reunion)
- Discovering Igbo Roots Through Genealogy and DNA (Who Is Nicka Smith)
- My Nigerian father’s DNA, African American double cousins and continental African DNA cousins (Continental and Diasporic African genetic genealogy)
- Chromosome 7 – An African American Connection (Boricua Genes)
4) Various important and insightful studies have been published on African American genetics. One does need to take into account some differences in methodology. Not meant as an exhaustive overview but these are a few recommended papers:
- The genetic ancestry of African, Latino, and European Americans across the United States (Bryc et al., 2014)
- The Great Migration and African-American genomic diversity (Baharian et al., 2015)
- Genetic Consequences of the Transatlantic Slave Trade in the Americas (Micheletti et al., 2020)
- Genetic Landscape of Gullah African Americans (Zimmerman et al., 2020)
Follow links below for a section of my blog which features DNA studies on African American genetics which I have reviewed in the past. In fact in an upcoming blogpost I aim to review the latest study by 23andme by Micheletti et al. (2020).
- Autosomal DNA studies on African Americans
- Haplogroup studies on African Americans
- Are African Americans really mostly “Nigerian”? (review of Micheletti et al., 2020)
5) Given the theme of this blog my survey has naturally been focused on Tracing the African Roots of my survey group. However African Americans are not exclusively of African descent. Similar to most other Afro-Diasporans they show variable amounts of non-African admixture as well. Safe for some exceptions (by no means unicorns though!). As shown in table 1 this additional ancestry consists mainly out of European DNA and to a much lesser degree also Native American and Southeast Asian lineage. I fully understand and respect that given the brutal history of the Slavery Period as well as continued racism afterwards many African Americans might not be inclined to learn more about their mixed European origins. Even if the possibility of this European ancestry (partially) dating from the Post-Slavery Period cannot be ruled out in advance. Muhammad Ali’s Irish great-grandfather makes for an intriguing example:
- Muhammad Ali: Boxer’s ancestral Irish town pays tribute after death (BBC)
- Black/White Interracial Marriage Trends, 1850–2000 (A. Gullickson, 2006) (see p.3 for an insightful chart)
Still other African Americans might be more curious about their complete genetic make-up and how this might define them. Despite shared experiences one must also be careful to respect the localized context and different historical trajectories across the Afro-Diaspora. Instead of just letting one single perspective on inter-racial relationships overcloud things. In fact there can be several valid reasons to also explore your European origins in a pragmatic and open-minded manner. Ironically in the process you might often also acquire valuable details about African ancestors linked to your European ancestors as well as your biracial ancestors.
Those latter ones are more likely of course to have been integrated within your family history in a more meaningful manner. Personal family histories are bound to sometimes deviate from the assumed narrative. Ultimately it might be self-defeating to allow generalizations about European admixture to determine how you should feel about your own unique DNA makeup. Especially without at least having done any basic genealogical & historical research of your own in advance. Also in the greater interest of racial healing within the USA such research efforts may be beneficial. See also:
6) In fact aside from usually minimal Native American and Southeast Asian scores 23andme also at times reported trace admixture of “South Asian” and “Western Asian & North African” for my African American survey group. However with much less frequency and also not exceeding a minimum level of 1%, except for one time! The maximum score of “North African” only being 0.5% while for “South Asian” it was 1.4%. Which is why I have not provided more detailed statistics for these categories.
Such scores are often labeled as low confidence regions and dismissed as just “noise”. Rightfully so in some cases. But given correct interpretation and proper follow-up research at times these scores can still potentially lead you to distinctive ancestors. As indeed seems to be the case for minor Native American and Southeast Asian scores among African Americans. In fact by systematically scanning for associated DNA matches I have made both strongly diluted North African lineage (inherited by way of Fula ancestors) and South Asian (Gypsy!) lineage plausible for several African Americans who shared their profile with me.
After the 2019/2020 updates the incidence of “South Asian” and West Asian & North African” scores might actually increase slightly for African Americans. As 23andme is now better equipped to pick up on that type of DNA. Then again I also think that the primary regions appearing in your results will often be more deserving of your research efforts. Your research results might then be more fruitful and covering a wider span of your ancestral make-up. As afterall the regions with the biggest amounts can be deemed to be more solidly based on your most important regional origins (even when taken as mere proxies). Then again it is human nature to be intrigued by seemingly mysterious details, even at the risk of getting caught up in them. Also it seems to be not just a sign of the times that “exotic” ancestry is often thought to be appealing 😉
And to be sure – exactly because such “exotic” trace regions are suggestive of distinctive ancestors – it might in fact also be worthwhile to investigate such minor family lines. As you might find them to be more readily identifiable after performing a dilligent family tree research or by combining with other aspects of DNA testing (haplogroups, IBD matches etc.). So despite their lower confidence trace regions are not to be lightly dismissed either. Ultimately this will all be up to your own personal preferences. But it’s worth repeating again that without additional clues and corroborating evidence your attempts to trace back trace regions to specific ancestors or ethnic groups could very well lead to a dead end. Conjecture and unfounded speculation can then quickly turn to self-deception.
7) I have been investigating the occurrence of Malagasy DNA matches for African Americans for quite a while now. These research findings are however still preliminary. I do intend to publish a detailed blog post about my findings eventually. In short these would be:
- Malagasy matches from Madagascar are being reported for African Americans with increased frequency when compared with other parts of the Afro-Diaspora.
- African Americans with Malagasy matches often tend to have (ultimate) Virginia state backgrounds.
- Malagasy matches intriguingly are often themselves also showing up in Ancestry’s “Early Virginia African Americans” community.
- All of which corresponds very well with a historically plausible scenario of slave trade between Madagascar and the USA focusing mosty on Virginia and taking place especially in the early 1700’s.
- Founding effects and subsequent dispersal due to Domestic Slave Trade causing Madagascar matches to also turn up for people from the Deep South.
- Minor but distinctive Southeast Asian admixture scores (more reliably shown on 23andme) also fall in line with expected dilution dating from the early 1700’s.
- Many people who receive Malagasy matches also receive small matches from other parts of the Malagasy Diaspora. Such as Mauritius, Réunion, Seychelles, Comoros, South African Coloureds and even Saint Helena. Because of their mixed background (incl. European admixture) also other ancestral scenarios might be possible though.
- Follow-up research based on identifying the ethnicity of the actual shared DNA segments and triangulation could clarify things further.
For a pathbreaking blog series on this Madagascar connection see also:
- Part I: The DNA Trail from Madagascar to Manhattan (Radiant Roots & Boricua Branches)
- Part II: The DNA Trail from Madagascar to Manhattan & Our Family’s Malagasy Roots (Radiant Roots & Boricua Branches)
- Part III: The DNA Trail from Madagascar to Virginia (Radiant Roots & Boricua Branches)
The author of this blogseries, Teresa Vega, is currently writing a highly relevant book on this topic:
- The DNA Trail from Madagascar to the Americas (to be published soon)
8) The seemingly consistent and usually quite high “Nigerian” scores on 23andme may have seemed like a common and perhaps overplayed theme for some African Americans. But actually for other parts of the Afro-Diaspora other regions tend to show up with greater frequency. Making for a significant distinction. And in fact even among African Americans there is a lot more meaningful nuance to be seen if you take into account substructure according to ultimate US state origins (Virginia vs. South Carolina, see Table 6). More or less conforming with historical plausibility. Also to be taken into account is that the predictive accuracy of “Nigerian” among actual Nigerians is quite impressive (around 90% for southern Nigerians, see this page).
As I have always maintained the labeling of ancestral categories is not to be taken as gospel! In all my blog posts I always use quotations to refer to categories such as “Nigerian”. And not for nothing! Because inherently there wil be some border crossing overlap. Fanning out into neighbouring areas according to some declining gradient. More insight to be gained by learning how people from various known background tend to score for these categories. Which is why I have performed my surveys among both Africans and Afro-descendants throughout the years. See also chart below for my latest findings prior to creating this page:
So for example “Nigerian” will also possibly be indicative of ancestral ties with neighbouring countries. Even when its main ancestral implication will usually indeed involve Nigeria. Furthermore while for most people southeast Nigerian (Bight of Biafra) lineage will be indicated. For some people instead it will be mostly southwest Nigerian (Bight of Benin) lineage which is being suggested. The likelihood depending on your particular Afro-Diasporan background. Either way, my overall survey findings clearly confirm that 23andme does not report non-sensical or randomized results. Or even just automatically assign certain regions to all Afro-descendants, regardless of their actual background!
For immediate understanding a visual depiction might be best suited. Which is why I made this map below displaying the wider geographic distribution of “Nigerian” (see this page for similar maps). Regrettably 23andme is still not providing such maps and other types of clarifying context which may improve the ability of their customers to make more sense of their results… Beyond the potentially misleading country labeling and percentages which are not always properly understood by many people.
*** (click to enlarge)

***
9) The so-called “Senegambian & Guinean” region is clearly serving as a primary signature region for pinpointing Upper Guinean lineage among all my Cape Verdean survey participants. Quite similar to the equivalent “Senegal” region on Ancestry. But more predictive when comparing with Ancestry’s 2013-2018 version. The group average for “Senegambian & Guinean” being 73.1% of their scaled African breakdown for 100 Cape Verdeans. While on Ancestry the scaled group average of “Senegal” for 100 Cape Verdeans was 58.7% (see this chart). See also this page:
I find this very encouraging as it demonstrates that despite shortcomings these 23andme results are not totally random at all! As I always say instead of being preoccupied with finding imperfections it is wiser to adopt a “glass is half full” mentality. Focusing on anything that is worthwhile. Which is quite a lot actually on 23andme. Because by way of “Senegambian & Guinean” 23andme seems to be able to quite accurately distinguish Upper Guinean lineage from other types of African macro–regional lineage. In the first place making the distinction with Lower Guinean lineage (as indicated by “Nigerian” and to a lesser degree also “Ghanaian, Liberian and Sierra Leonean”). And it is even more reliably differentiating Upper Guinean lineage from Central African lineage (as indicated by “Angolan & Congolese”). As well as Southeast African lineage and North & East African lineage.
These implications of a reasonable predictive accuracy on 23andme are not only very significant for Cape Verdeans themselves but I would argue also very relevant for African Americans and other people of the wider Afro-Diaspora! Follow link below for better understanding of how a macro-regional perspective can be beneficial when looking into DNA results. Because it takes into account the various intersections based on historical and ethno-linguistic considerations, aside from merely genetic ones. Mutually reinforcing but still only meant to be indicative of course and to be used as proxies!
Also see this screenshot below for an illustration of how predictive the “Senegambian & Guinean” category can get. In this case for a mixed African American person who has 1 Cape Verdean parent.
AFRICAN AMERICAN (1/2) & CAPE VERDEAN (1/2)
***

2020 version. Very insightful results. Highlighting how African American and Cape Verdean breakdowns can quite easily be distinguished from each other. Even when showing the exact same amount of African admixture. Because as my survey has demonstrated Cape Verdeans will never show “Nigerian” in first place within their African breakdown. While a “Senegambian & Guinean” score of nearly 30% will be highly atypical among African Americans. In my survey of 200 African American 23andme results the maximum score for this region was 20.4%. With scores higher than 15% already being uncommon. Notice also the elevated level of “Spanish & Portuguese” betraying this person’s Cape Verdean side. Probably also accounting for the minimal but distinctive 1.3% “North African” score. While the minor but still clearly detectable Southeast Asian admixture is quite characteristic for African Americans.

Do you have the slideshow of the aa 23andme results from 2015?
LikeLike
I don’t because most of them are of a less viewer-friendly format, see also footnote 2. However all results can be seen in my spreadsheet. In case you like to see a particular result let me know.
Btw i’m assuming you made a typo when asking from results from 2015? This page is only featuring results which were obtained after the 2018 update (Ancestry Composition v3.0 & v5.0). In fact in 2015 I had already done some surveying of African American 23andme results. But at that time the AFrican breakdown of 23andme was still very basic and frankly not worthwile, see also this page.
LikeLike
Thank you. I was asking if you had a 23andme survey of aa results from 2015, although this page features results from the 2018 23andme survey after the update that year because I see that you mentioned some results from the 2015 survey. So, I was curious to see what many of those results looked like. However, you most likely answered that question. Again thank you very much for getting back to me. I enjoy and appreciate your work on this website. Have a nice day.
LikeLiked by 1 person
Thanks a lot for your appreciation, always glad to hear that! I actually already started surveying DNA results in 2011. I shared these findings also on 23andme’s online community at that time. But like I said back then the results were very basic. So at that time people were still relying on third party analysis, like Prof. Mc Donald and the pioneering African Ancestry Project by Razib Khan.
Just a few screenshots I saved from that time. Keep in mind that the so-called “Central & South African” category was pretty much meaningless because it was based on Pygmy/Khoisan samples only. Right now Central African ancestry (incl. Bantu lineage!) is much more in scope with DNA testing. However it often still remains underestimated to some extent on 23andme.
.
.

LikeLike
hi sir I noticed that, on average, African Americans tend to have a small amount of Southeast Asian when using this company’s DNA. Can you tell me which region it mostly comes from, Thailand, Myanmar or Indonesia?
LikeLike
Hi Brian,
Most likely this DNA component is an indication of (diluted) Madagascar ancestry. Because people from Madagascar are a genetic mix of Southeast Asians (Indonesia) and Southeast Africans. Scroll to the section: “Madagascar Connection” in this blogpost for more details.
LikeLike