
Contents
- Introduction
- Summary of Findings
- Observations
- “Ivory Coast/Ghana” also predictive of Liberian DNA
- “Benin/Togo” also predictive of Ghanaian & Nigerian DNA
- AncestryDNA regions correlating with language?
- Ancient migrations & spread of agriculture
- Screenshots & Youtube videos of West African AncestryDNA results (2013-2018)
- Implications for Afro-Diasporans
- How to make more sense of “Ivory Coast/Ghana” scores
- How to make more sense of “Benin/Togo” scores
________________________________________________________________________________________
UPDATE 03-09-2019: this page was first published on 21 February 2018 when I had only 41 AncestryDNA results available from this part of West Africa for my analysis (see this overview). As my survey has been ongoing I have managed to collect a sample group which has now doubled in size. Consisting of no less than 82 AncestryDNA results from Liberia, Ivory Coast, Burkina Faso, Ghana & Benin! Additional screenshots and new group averages have been added therefore. Also a few textual changes have been made (see this link for original version).
For a short recap of my final survey findings follow this link:
Please also keep in mind that AncestryDNA’s ethnicity estimates have been updated several times now! On this page I am dealing exclusively with AncestryDNA version 2 which was current between September 2013 and September 2018. All matters being discussed on this page are therefore not pertaining to updated results (Sept. 2018 up till now). In my opinion this version 3 regrettably has been a downgrade rather than providing meaningful improvement, overall speaking. Which is why I have discontinued my AncestryDNA survey. For more details read this blogseries:
- Did Ancestry kill their African breakdown? (part 1)
- Did Ancestry kill their African breakdown? (part 2)
- Did Ancestry kill their African breakdown? (part 3)
________________________________________________________________________________________
1) Introduction
On this page I will be posting AncestryDNA results of West Africans with confirmed ethnic background(s). Unlike for Afro-Diasporans in the Americas these results can therefore be verified with known genealogy. This should be helpful to improve correct interpretation and also to determine how reliable/predictive the various African AncestryDNA regions might be.
This discussion of West African AncestryDNA results will be divided in two parts, each having its own page. Roughly corresponding with the categorization of Lower Guinea & Upper Guinea. And also in approximate alignment with a preponderance of either “Ivory Coast/Ghana” or “Benin/Togo” scores (see map 2) instead of “Senegal” and/or “Mali” scores among my West African survey participants. See also:
- Research methodology for my AncestryDNA survey
- Spreadsheet featuring individual West African AncestryDNA results
- Spreadsheet featuring group averages for West African AncestryDNA results
Liberia, Ivory Coast, Burkina Faso, Ghana, Togo & Benin
Map 1.1 (click to enlarge)

Source: https://mapchart.net/africa.html
***
Map 1.2 (click to enlarge)

“Ivory Coast/Ghana” & “Benin/Togo” regions. Source: Ancestry.com
***
Specifically on this page I will focus on results from Liberia, Ivory Coast, Burkina Faso, Ghana, Togo and Benin (shown in red in map 1.1). Nigerian results have already been discussed on a separate page (any future results from Niger & Chad will be posted there as well). Results from the remaining West African countries (shown in green in map 1.1): Senegal, Gambia, Mali, Mauritania, Guinea Bissau, Guinea Conakry and Sierra Leone will be discussed in the second part of this exploration of West African DNA results. I will first present a summary of my main findings in section 2. I will provide more detailed analysis & relevant context in section 3. In the very last part of this page (section 5) I will discuss the implications these West African results might have for Afro-Diasporans. If you want to skip the discussion just scroll to section 4 to see screenshots of individual West African AncestryDNA results.
The screenshots of these various West African AncestryDNA results form the basis of my survey findings. I have grouped them by country and when possible also by ethnicity1. The backgrounds behind these West African results were verified by me in the best way I was able to. Mostly based on statements made by the persons who did the AncestryDNA test but in a few cases I also distilled a likely ethnic/national identity by way of other clues (usually family names and family locations). In these latter cases I have added a question mark in the header. Therefore a 100% accurate depiction of self-identification is not intended. The ethnic headers are merely meant to provide additional perspective. Even if at times only approximate info was available to me. Naturally I respect everyone’s right to self-identify as they please. My accompanying comments should be taken as informed speculation on my part they are not meant to exclude other possibilities or simplify complex family histories.
As these results below show many West Africans are in fact of “mixed” background if you go along with the regional framework provided by AncestryDNA. As I will continue to say it is counter-productive to get distracted by the country name labeling. Rather consider the AncestryDNA regions to be proxies of ancestral components which have become more frequent in certain loosely defined areas but still show a wide dispersal in neighbouring areas as well due to ancient migrations and inter-ethnic unions occurring probably since the dawn of mankind! If you invest some time in learning how to truly “read” the results they can still be very informational in my opinion.
I like to thank all my West African survey participants for having tested on AncestryDNA and sharing their results so that it may benefit other people as well!2 See also:
- African AncestryDNA results
- Central & Southern African results
- North & East African AncestryDNA Results
- Nigerian AncestryDNA results
- West African results part 2
_____________________________________________________________________________
2) Summary of Findings
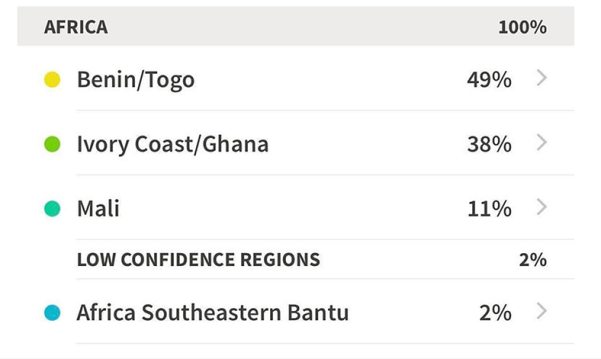
Selection of West African AncestryDNA results
***(click to enlarge)

***(click to enlarge)

***(click to enlarge)

***
In my personal estimation AncestryDNA can report valuable information about your ancestral origins as long as you interpret the data correctly and as long as you are also aware of the relevant context and inherent limitations. Still these results might appear to be “off” at first look for those not accustomed to how AncestryDNA or DNA testing in general works. Therefore please keep in mind the following disclaimers:
- Don’t take the country name labeling of the regions too literally. The regional percentages firstmost signal close genetic similarity to the samples taken from the countries after which the regions have been named. Actual origins from neighbouring countries should not be ruled out.
- Almost all African countries have been colonial creations with borders cutting right through the homelands of ethnic groups. Closely related ethnic groups can often be found on both sides of the border.
- Most DNA is common in many populations, just at different frequencies. Due to either migrations or shared origins dating back from hundreds or even thousands of years. For this part of West Africa in particular the migrations associated with speakers of various language groups such as Kwa, Gbe, Gur and Kru are a factor of paramount significance.
- Sometimes (very) ancient admixture rather than any recent lineage is suggested by these AncestryDNA estimates. And in this way some of these regional scores might perhaps best be seen as genetic echoes from a (very) distant past. Beyond family tales, historical knowledge or even ethnic origin traditions.
- Ethnicity is a construct which evolves across time due to ethnogenesis. Generally speaking therefore ethnic groups do not possess unique DNA markers. Especially in comparison with neighbouring ethnic groups or from within the same wider region. The most common scenario being a genetic gradient which causes ancestral components to gradually fan out. As can be verified from my survey.
- However by closely studying the regional combinations being reported for West Africans we can still learn a great deal. Inspite of individual variation group averages do tend to provide more solid ground to make meaningful inferences when specifying someone’s ancestral origins. Also finding out where a specific region is most prominent or rather most subdued holds valuable lessons.
West African group averages

***
The statistical data displayed in chart 2.1 is based on a limited sample size. Although almost all countries are being covered now (incl. also Burkina Faso!). While the sample size for Liberia and especially Ghana is quite decent actually. Which should contribute to a more robust dataset when compared with my initial findings in 2018 (n=41, see this overview). All of the included countries themselves do harbour a multitude of ethnic groups. Right now however I can only make statistic calculations for a few well represented ethnic groups within Ancestry’s customer database. It should be obvious therefore that a greater degree of genetic diversity and individual variation might be expected across West Africa and also within the listed countries.
Some of this diversity is already being shown by the Ghanaian results representing half of my sample group (for this part of West Africa). We can verify that the so-called “Ivory Coast/Ghana” region is indeed quite predictive for the 18 Akan samples (88%) and to a lesser degree also for the 4 Ga-Adangbe samples (69%). However for the 6 Ewe samples it is instead so-called “Benin/Togo” which is most prominent (67%)! This is something I had anticipated right from the start when I began my AncestryDNA survey five years ago already in 2013.
Eventhough only preliminary statements should be allowed at this stage I highly suspect that these group averages are already a reasonably good approximation of the main regional components to be found within the genepool of this part of West Africa. Atleast according to AncestryDNA’s current reference panel. The group averages I have calculated being more less in line with how the “typical native” scores according to Ancestry’s information: respectively 86% for “Ivory Coast/Ghana) (n=115) and 82% for “Benin/Togo” (n=60).
However also other regions are frequently reported. Either as minor genetic components with lower confidence but often also with substantial amounts above trace level. Nearly always neighbouring and genetically overlapping West African regions are involved. This goes especially for so-called “Nigeria” in regards to results from Benin; so-called “Benin/Togo” in regards to results from Ghana; so-called “Mali” in regards to results from Ivory Coast and so-called “Senegal” in regards to results from Liberia. In a way these main secondary regions help make each nationality more recognizable rather than just focusing on their primary regions which are in no way unique to any given country! It is also noteworthy how so-called “South-Central Hunter-Gatherers” (labeled “Pygmy/San” in my survey) is consistently showing up for results from Liberia and also to a lesser degree for results from Ivory Coast. For more discussion:
These extra regions may be unexpected at first sight for people who according to their own knowledge are “100%” Liberian, Ivorian, Ghanaian, Beninese etc.. Taking these results at face value can therefore be misleading without correct interpretation. The disclaimers I already mentioned above as well as the next section below should provide sufficient clarification. As actually this outcome does overall still make sense. In short the advise would be to: don’t overfixate on the labeling of ancestral categories! In fact this does not only go for AncestryDNA but any kind of admixture analysis. In order to avoid jumping to premature conclusions I highly recommend that you atleast browse through some of the topics mentioned in the following links:
- AncestryDNA Ethnicity Estimate Help and Tips (Ancestry)
- AncestryDNA regions (Tracing African Roots)
_____________________________________________________________________________
3) Observations
“Ivory Coast/Ghana” also predictive of Liberian DNA
Map 3.1 (click to enlarge)

Source: ancestry.com (text in red added by myself)
***
One of the main outcomes of my West African survey is that based on group averages so-called “Ivory Coast/Ghana” is most prevalent in Liberia. And not as you might assume in either Ivory Coast or Ghana. Although the group averages are actually not that far apart (see chart 2.1). Liberia is currently not featured with its own region on AncestryDNA. That’s why it is only logical that Liberian DNA will be described in terms of the existing 9 African regions. Given Liberia’s geographical location an intermediate outcome between “Ivory Coast/Ghana”, “Mali” and “Senegal” was to be expected therefore. To be sure all of these three regions do indeed show up in Liberian results. But by far “Ivory Coast/Ghana” has turned out to be predominant. Even when for one result it was instead “Senegal” which was the biggest region. Undoubtedly this is linked to ethno-linguistical background as will be explained further below.
Actually so-called “Ivory Coast/Ghana” is also being reported with substantial amounts in Sierra Leone. Much for the same reasons as for Liberia, its neighbouring country. Afterall Sierra Leone is also not appearing with its own region on AncestryDNA. The Sierra Leone context is however more complex because it seems to have a greater Upper Guinean influence (“Senegal” and “Mali”) compared with Liberia. Furthermore also the usually quite mixed (within Africa) background of the Krio people complicates any straightforward interpretation. This will be discussed in greater detail in “West African Results, part 2”.
Based on what I have seen I can already say that it might be expected that especially Mende people and other ethnic groups from southern Sierra Leone will score high “Ivory Coast/Ghana” scores. On average perhaps in the range of 40-50%. The “Ivory Coast/Ghana” region is also frequently showing up (above trace level) in the results of other West African countries. As far north as Senegal and as far east as Nigeria (also mentioned in map 3.1). However much more subdued and never as primary region, unlike what I have observed several times already for Sierra Leone (see my spreadsheet).
Then again “Ivory Coast/Ghana” can of course also be very predictive of either Ghanaian or Ivorian DNA. But as my survey is demonstrating only as as long as you fit a certain ethnic profile. Keeping in mind that my sample size is still limited the highest “Ivory Coast/Ghana” scores (>90%) have been obtained for persons with either an Akan or Kru background. To be sure this does not mean that “Ivory Coast/Ghana” is an indicator of actual Akan or Kru descent! Other ethnic backgrounds might still be perfectly compatible with high “Ivory Coast/Ghana” scores. However this finding does seem to suggest that AncestryDNA might use samples taken from both Akan & Kru populations to calculate their so-called “Ivory Coast/Ghana” estimates.
As far as I know Ancestry has not confirmed the ethnic backgrounds of their African Reference Panel. However just speculating I would say it’s very likely that Brong (Akan speaking) samples from Ghana were used. Possibly combined with Ahizi (Kru speaking) samples as well as Yacouba (south Mandé speaking) samples. Both from western Ivory Coast. The Brong appeared in a pre-release version of AncestryDNA (see this screenshot). While the Ivorian samples have been used for atleast two genetic studies already (Brucato et al., 2010 & Fortes-Lima et al. 2017) and might have been included in the now defunct Sorenson Database which was bought by Ancestry.com a few years ago. Although again I have no certainty about this.
Such a selection of samples might explain why Liberian Kru results and Ghanaian Akan results show the highest “Ivory Coast/Ghana” amounts I have observed during my survey. It would simply mean that genetically speaking they are a near perfect match to the samples within AncestryDNA’s database. Naturally so if these samples happen to be Akan and Kru like themselves! The possible inclusion of Mandé speaking Ivorian samples (Yacouba) might then explain why “Ivory Coast/Ghana” scores are still so frequently reported also across Upper Guinea as well as south Mandé speakers in Liberia. I need more results from those countries to confirm though. I only managed to include one result from Burkina Faso. And it might be expected that, given wider variation, “Ivory Coast/Ghana” will be reported in substantial amounts over there as well.
“Benin/Togo” also predictive of Ghanaian & Nigerian DNA
Map 3.2 (click to enlarge)

Source: ancestry.com
***
Map 3.3 (click to enlarge)

***
In my West African survey I have included nine results from Benin (almost all with a Gbe speaking background). And their “Benin/Togo” scores (70% on average and with a 79% median, see chart 4.2) are in line with what Ancestry mentions about the score of the “typical native” being 82%! Of course this represents only a limited sample size but it does testify to the predictive accuracy of this region. I have however also come across substantial and even impressingly high so-called “Benin/Togo” scores for people from other countries than either Benin or Togo. Most notably (eastern) Ghana and (southern) Nigeria. But surprisingly also among people of the Afro-Diaspora coming from places with relatively few documented direct ancestral connections with either Benin or Togo. I have already blogged about these findings because they were seemingly so counter-intuitive at first sight:
- Is “Benin/Togo” really pinpointing origins from within Benin’s borders?
- Nigerian AncestryDNA results (scroll to section 4)
My ongoing survey now allows me to more solidly confirm what I had previously already outlined in the blog pages referenced above. The “Benin/Togo” region can indeed be predictive of genuine Beninese ancestry but not exclusively so! Keeping in mind that my sample size is still limited, the highest “Benin/Togo” scores (>80%) have been obtained for persons with a Gbe speaking background. For one Ewe person from Ghana it was even as high as 97%! To be sure this does not mean that “Benin/Togo” is an indicator of actual Gbe or Ewe descent! Other ethnic backgrounds might still be perfectly compatible with high “Benin/Togo” scores. However this finding does seem to suggest that AncestryDNA is using samples taken from Gbe-speaking populations to calculate their so-called “Benin/Togo” estimates.
Knowing the history (ca. 1000-1500 AD) of the Gbe migrations (see map 3.3), originating in southern Nigeria and spreading westwards across Benin & Togo into eastern Ghana, is crucial to gain deeper understanding. And also just being aware that West African ethnic groups are often spread across borders and share a great degree of ancient origins with neighbouring groups is essential. Either way I imagine this finding could really be an eye-opener for many people looking to interpret their so-called “Benin/Togo” results. It puts the reporting of so-called “Benin/Togo” scores into much better perspective. Both for Ghanaians and (southern) Nigerians, but also for Afro-Diasporans (see section 5 for implications).
I like to underline that so-called “Benin/Togo” is not an exclusive marker for any given ethnic group or nationality. Both according to Ancestry’s own info (see map 3.2) as well as my survey findings it could be suggestive of many different ethnic origins from eastern Ghana into southern Nigeria, while possibly also some ethnic groups further west such as the Gur speaking people in Burkina Faso and northern Ivory Coast might score substantial amounts for this region as well. This geographical range ultimately to be explained mostly by shared ancient origins from Nigeria rather than from Benin or Togo.
AncestryDNA regions correlating with language?
Map 3.4 (click to enlarge)

Source: Ancestry (2013) & Roger Blench (2012)
***
From my experience learning about ancient migrations and the distribution of African language groups can be very helpful to make more sense of your AncestryDNA results. I like to point out from the start that what’s about to follow is still mainly my own personal take on it and not intended to be conclusive in any way. Map 3.4 features a PCA (principal component analysis) plot of the West African regions on AncestryDNA as well as a map of West Africa’s main language groups. Taking a cue from this juxtaposition it seems to me that roughly speaking:
- The so-called “Senegal” and “Mali” regions correspond mainly with the distribution of Atlantic and Mandé languages. All concentrated within the area which is also known as Upper Guinea.
- The so-called “Ivory Coast/Ghana” region seems to coincide mostly with the area where both Kwa and Kru languages are spoken.
- So-called “Benin/Togo” seems to be associated first of all with the Volta-Niger languages (which includes both Gbe languages and Yoruba as well as Igbo).
- So-called “Nigeria” would in fact also be including Volta-Niger languages. Creating major overlap, even when shifted more eastwards. But in addition it’s probably also covering all other major language groups native to presentday Nigeria (incl. also Chadic speaking Hausa’s, not shown in the map but based on my Nigerian survey findings).
- These last three AncestryDNA regions (“Ivory Coast/Ghana”, “Benin/Togo” and “Nigeria”) together more or less envelop the so-called Lower Guinea area.
- Presently AncestryDNA does not have any separate region for Burkina Faso (which is mostly Gur speaking, see this map). The Gur languages are therefore probably being covered by a mixture of “Ivory Coast/Ghana” with “Mali” and in selected cases also some “Nigeria” or “Benin/Togo”.
- So-called “Cameroon/Congo” is a bit out of scope because it is principally linked to the Bantu languages (shown in blue) from Central & Southern Africa. But it also connects with the closely related Bantoid languages within the border area of Cameroon & Nigeria which gave rise to the Bantu expansion.
To truly digest this information you will first need to resist the (unrealistic) urge to see everything in “exact” and “precisely” delineated terms. Instead attempt to focus on approximate tendencies and rough correlations to be observed within a bigger context. This can help you gain greater insight from your results. In particular for Africans taking the AncestryDNA test there is no need to panic when your results show less than 50% for whichever region you happen to be “native” of or whichever region you expected to be most relevant given your background. As long as your main breakdown consists of a plausible combination of neighbouring regions there should be no cause for immediate concern 😉
DNA testing is revealing that usually ethnicity cannot be distilled into one single genetic category, unless you happen to be a perfect match to the samples your DNA is being compared to. Instead typically most ethnic groups will be described as a composite of neighbouring and interrelated ancestral categories. This might be counterintuitive at first but does actually make sense if you take into consideration the genetic impact of shared origins, ancient migrations and inter-ethnic mixing throughout the ages. The distribution of language groups is a good indicator of the broader patterns to be taken into consideration. As generally speaking the initial expansion of distinctive populations was accompanied by the spread of their language and often also their particular mode of livelihood. Various scientific papers have already demonstrated that broad-scale population structure within Africa reflects both geography, (pre-)history and language. For example see:
- The Genetic Structure and History of Africans and African Americans (Tishkoff et al., 2009)
- Genome-wide patterns of population structure and admixture in West Africans and African Americans (Bryc et al., 2010)
- Admixture into and within sub-Saharan Africa (Busby et al., 2016)
Although again not perfectly so! There will always be factors adding to complexity and things being less clearcut or consistent as you might wish for. Some reservations to keep in mind: language shift; cultural assimilation; deep ancestry predating ethnogenesis; whole scale absorption of ethnic minorities; ethnic blending because of trading diaspora’s, polygamy, local slave trade, increasing urbanization in multi-ethnic cities etc., etc.. For all these reasons people speaking the same or related languages might still have divergent DNA profiles because we all have unique genealogies which transcend ethnicity if you go back in (pre-)history far enough. Another aspect to be aware of is that the linguistic categorization of Africa’s languages is very much a project in progress! Even when the main outlines are pretty much agreed upon among most scholars already. See also:
- African Maps (Ethno-Linguistic, Lower Guinea, Upper Guinea, Sahel/Interior) (Tracing African Roots)
- African language materials (Roger Blench)
- Niger-Congo materials (Roger Blench)
Map 3.5 (click to enlarge)

Source. Notice how the old grouping of Kwa languages used to extend from southern Nigeria into southeastern Ivory Coast. Also notice the presence of Kru languages in both Liberia & Ivory Coast.
***
Map 3.6 (click to enlarge)

Source. Notice how all 3 language groups are practically adjacent and crossing modernday country borders.
***
From Ancestry’s information (see this plot) it can be gleaned that the “Benin/Togo” and “Ivory Coast/Ghana” regions cluster the closest from all other African regions on AncestryDNA. And furthermore the samples from Benin/Togo and Ivory Coast/Ghana are the only ones that seem to overlap to some degree. From my Nigerian survey findings it has come to light that the “Benin/Togo” region is very commonly reported for southern Nigerians as well. Although usually as a secondary region. Less frequently and with lesser amounts “Ivory Coast/Ghana” is still also present among several Nigerian results. Suggesting that people in this broader area (Lower Guinea) are genetically speaking quite closely interrelated. Nonetheless it has turned out that if you resist from taking the country name labeling too literally these regions do seem to describe rather distinctive and separate genetic clusters, albeit loosely defined. “Ivory Coast/Ghana” to be associated mostly with Akan & Kru affiliations but possibly also indicative of south Mandé connections. While “Benin/Togo” is more so centred on Gbe affiliations, as well as southern Nigeria where the Gbe originated and still share a great deal of DNA. Together this would encompass the Volta-Niger language group.
Looking into maps 3.5 & 3.6 above it’s instructive to grasp how the Gbe languages of Ewe (Ghana/Togo) and Fon (Benin) are grouped together with southern Nigerian languages into one Kwa cluster. Nowadays also termed “Volta-Niger“, but formerly also known as eastern Kwa! It is even more illuminating to be aware that also the Kru languages from Ivory Coast and Liberia once used to be classified as Kwa (see this map)! Nowadays a finer distinction is being made and an independent or intermediate position with the Gur languages is often assumed (see this article for an overview). Still this doesn’t take away from the overall close relationships and a hypothetical ultimate origin from Nigeria. Aside from the well known and relatively recent Gbe migrations, this might otherwise be traceable to thousands of years ago rather than hundreds of years ago. Principally driven by the initial spread of agriculture throughout West Africa. And not to be confused with the more recent & convoluted split-migrations taking place in historical time periods. In particular the expansion of the Akan people as well as the southward drift of Mandé people in the past millennium. Apparently causing the Kru populations to migrate further into Liberia, coming in from presentday Ivory Coast.
Ancient migrations & spread of agriculture
Map 3.7 (click to enlarge)

Source: The Peopling of Africa: A Geographic Interpretation (Newman, 1995)
***
Map 3.8 (click to enlarge)

***
____________________
“Also from Nigeria, some of the Kwa peoples spread in similar fashion through the West African tropical rain forest to the Ivory Coast and forced other Kwa peoples, the Kru and Lagoon speakers, westward into the Ivory Coast and Liberia. […]
“Agriculture has since been introduced to most of the Kru and Lagoon peoples, but it usually has rice as the basic crop, which comes from a different center of dispersal, or manioc, which was introduced into West Africa from the New World. Even today in the Ivory Coast, as several botanists (Miege 1953; Chevalier 1952) have remarked, there is a sharp boundary of yam cultivation on the Bandama River, which is also the border between the Baoule [Akan] and Kru peoples.” (Anthropological Implications of Sickle Cell Gene, Livingston, 1958, p.552)
____________________
As mentioned by AncestryDNA its so-called “ethnicity estimates” might also reflect ancient migrations taking place “thousands of years ago”. This is often overlooked by people when contemplating their results. However it then of course becomes very useful to consider the current state of knowledge in regards to the earliest peopling of West Africa. Obviously this is a very complex subject and much is yet to be uncovered. Naturally I am also not claiming to be any “expert” as my own reading in this field is still limited. Therefore I will only touch on some key aspects. The quote above is taken from a rather old source and uses an outdated definition of the Kwa language group. The article itself as well as its author however remain influential and widely read. Therefore I suspect that these statements might still be essentially valid. The spread of agriculture across West Africa and its possible linkage with population migrations is not fully known in all its details yet. However it seems not farfetched to assume that especially the so-called Nok culture (within modernday Nigeria) played a pivotal role in this process.
The main driving forces behind ancient West African migrations are displayed in map 3.7. Basically two major centres of dispersal are identified, one located in modernday Nigeria and to be associated with yam cultivation and Kwa/Benue-Congo languages (the Volta-Niger grouping had yet not been proposed at that time). The other centre possibly located in modernday Mali and associated with African rice and (proto-)Mandé speakers (see this article). Migrations may have first went along the savannah corridor and only in more recent times also a southwards movement into the rainforest zone. Interestingly the Ivory Coast & Liberia seem to be exactly at the point where these two major forces meet up! Right at the intersection of so-called Lower and Upper Guinea. It might also be very insightful to know if the so-called Dahomey gap (a southern savannah enclave breaking up the West African rainforest zone) possibly played a facilitating role in these migrations taking place in the last 4 or 5 millennia.
Map 3.8 is showing the so-called Yam Belt in West Africa (see this page for a similar map). I am inclined to think that the modern-day distribution of yam cultivation could still be roughly correlated with ancient migrations within West Africa. The three world’s biggest producers are Nigeria, Ghana and Ivory Coast. Followed closely by Benin & Togo (see this article). I find it striking that this so-called Yam Belt conforms to a great part with the so-called Lower Guinea area. Which in my survey seems to be genetically defined by the interrelated regions of “Ivory Coast/Ghana”, “Benin/Togo” and “Nigeria”. It is also very fascinating to learn about the cultural significance of Yam festivals in both Nigeria, Ghana and the Ivory Coast.
Even so, obviously also ecological circumstances play a significant role in the current production of yam. And more recent historical developments as well as cultural borrowing might have altered things. For example nowadays West African populations tend to have several staple foods, incl. crops originally imported from the Americas (cassave & maize). And actually yams are also grown all the way west in Cape Verde where it still retains its original Senegambian pronounciation: inhame. Possibly derived from the Wolof verb to eat: nyami. This original form of the word yam is in fact widespread in creole or patois languages across the Afro-Diaspora in the Americas (see this article). Adding an enticing twist to this culinary saga!
Summarizing it can be said that my reasoning in this section may have been speculative in some aspects but it is still grounded in phenomena which are more or less verifiable. It might offer more clarification for my West African survey findings featured on this page. Furthermore it could explain the at first sight surprisingly frequent reporting of “Benin/Togo” and to a lesser degree also “Ivory Coast/Ghana” scores among Nigerians. These could then be regarded as merely mislabeled ancestral elements native to the Nigerian genepool. In population genetics it is often the source populations which are assumed to display the greatest degree of diversity, the offshoots being a subset of this variety due to founder-effect.
Many people are still getting blindsided by AncestryDNA’s modern country name labeling. In order to get more added value from your results I find it essential to fully realize the interrelatedness of West African genetics due to ancient migrations! Currentday language families in West Africa are suggestive of these migrations but not perfectly so due to language replacement and the other reservations pointed out already above. The same goes for the distribution of Africa’s traditional native crops (yam, African rice but also Sahelian pearl millet) which again appears to be indicative for ancient West African migration patterns but understandably not correlating for the full 100%.
Unfortunately this highly fascinating topic of early West African (pre-)history is often absent or poorly represented in the curricula of primary and secondary education. Furthermore both scholars and laymen tend to pay more attention to other areas of Africa. In particular North/East Africa because of early human evolution or Ancient Egypt as well as Central/Southern Africa in regards to the Bantu expansion. Regrettably this relative neglect of West African orientated research has lead to a severe lack of basic knowledge among the general public. Leaving them vulnerable to serious misinterpretation and even at risk of being mislead by agenda-driven fringe movements.
It is a true shame that West African (pre-)history too often is forcibly linked to other faraway places simply for prestige reasons or misguided ideology. This is not to deny that West Africa has indeed been in long standing mutual contact with neighbouring parts of Africa. And these connections are certainly also research worthy. Then again so much insight is to be gained when you consider West Africa to be a regional unit within its own right and on its own terms. With its own independent historical driving forces centered principally in modern-day Mali and modern-day Nigeria along the Niger river valley, the true bearer of civilization for West Africa in so many ways.
Some suggestions for further reading:
- General History of Africa (Unesco) (all volumes online available)
- The Peopling of Africa: A Geographic Interpretation (Newman, 1995)
- Themes in West Africa’s History (E.K. Akyeampong, ed., 2006)
- Celebrating Nigeria’s yummy yams (BBC, 2010)
- Lele’s Festival de ñame, 2007: 5,000 years of culinary history (Latinogenaologyandbeyond, 2017)
_______________________________________________________________________
4) West African AncestryDNA results
As far as I was able to verify all of the following screenshots below are from persons with four grandparents from said nationality, unless specified otherwise. But naturally I did not have absolute certainty in all cases. Practically all results have been collected by me from public websites or social media.2 I like to thank all my survey participants for having tested on AncestryDNA and sharing their results online so that it may benefit other people as well!
Results from Ghana
Chart 4.1 (click to enlarge)

***
Map 4.1 (click to enlarge)

Source: Abina and the Important Men
***
While reviewing the more detailed statistics I calculated for my Ghanaian sample group in chart 4.1, keep in mind that averages tend to hide underlying variation. It’s always advisable to also take into account other measures such as the median and especially the minimum & maximum values to get a sense of the range of the scores. Naturally also the sample size (mentioned in the row labeled “Number”) is essential to place this data in better perspective. And even more so actual ethnic background as demonstrated by my separate data for the few Akan and Ewe results in my survey!
We can verify that both “Ivory Coast/Ghana” (32/42) and “Benin/Togo” (9/42) appear as primary region for Ghanaians. In other words showing up with the biggest amount in a person’s breakdown. It seems that actual ethnic background within Ghana determines which one of both (closely interrelated) regions will predominate. Especially the Ewe people score high amounts for so-called “Benin/Togo”. While the so-called “Ivory Coast/Ghana” region is much better equipped to detect Akan origins. The 4 Ga-Adangbe samples being somewhat intermediate. Obviously more samples are needed, incl. also from other Ghanaian ethnic groups. Especially samples from northern Ghana are lacking right now. While the Ashanti results are relatively well represented I do not yet have much Fante results either. But this outcome already serves as a wake-up call for people who take the country name labeling of ancestral categories as gospel 😉
Aside from “Ivory Coast/Ghana” and “Benin/Togo” also other main regions are sometimes showing up above trace level (=low confidence) in Ghanaian results. Especially “Nigeria” and “Mali”. It should be kept in mind that neither of these regions are confined to their AncestryDNA labeling. In particular so-called “Mali” might often be connected rather with northern Ghana (Gur speaking) (referred to as “Mole-Dagbani” in map 4.1). In the absence of corroborating evidence these regions are perhaps likely to suggest ancient genetic similarity. Even when in fact also relatively recent family ties to especially Nigeria might exist and be hinted at. Given the oft-mentioned traditions linking Ghana and especially the Akan to Sahelian origins, it might be surprising that the “Mali” region is not showing up more strongly among their results. However several modern researchers nowadays tend to assume these traditions are merely deriving from Akan elite connections with Mandé gold traders. Not to be generalized for the entire population which may have been native and living as (yam) farmers within current-day Ghana for a very long timespan already based on archaeological findings:
- Ethnic Politics and the Relocation of Ghana, Benin, and Mauritania (GeoCurrents, 2011)
- Les Akan: peuples et civilisations (K.R. Allou, 2015)
- ROOTS.NL (S1E2) – Searching for Gold (Tracing African Roots, 2017)
- The Akan Diaspora in the Americas (Ch. 2) ((K. Konadu, 2010)
- Toward a New Understanding of Akan Origins (A. Klein, 1996)
I will be posting these Ghanaian results grouped according to known ethnic background and ranked according to main regional score. Despite the obviously limited number of samples an insightful pattern seems to arise already. As expected “Ivory Coast/Ghana” peaks among my Akan samples. But this is not an actual confirmation of Akan lineage! The highest “Ivory Coast/Ghana” amount I have seen reported for an Akan person is 100%! However a Liberian of possibly Kru descent came very close with an amount of 97%. Also a Ga-Adangbe person reached an amount of 92% “Ivory Coast/Ghana”. So it pays to be cautious and resist jumping to conclusions.
As discussed in section 3 it seems likely that one part of the samples being used by Ancestry to determine their “Ivory Coast/Ghana” estimates are Brong, an Akan subgroup. Hence the strong genetic similarity detected with Akan persons in my survey, in particular those of Ashanti descent. For other ethnic groups in Ghana a greater variation can be expected. This does not only involve the Ewe & Ga-Adangbe from the southeast but also other ethnic groups from further north. Map 4.1 shows the main ethnolinguistic groups living in Ghana. For even greater detail you may also want to consult this one.
***
GHANA (Akan)
***

***
The so-called “Ivory Coast/Ghana” region is capable of providing very accurate predictions of Akan ancestry. This is convincingly demonstrated in the screenshot above and also the following ones. This person of Akan background is being described as practically 100% “Ivory Coast/Ghana” if you ignore the miniscule trace regions. Which is just what you would expect, even when such genetic statements are usually more complicated. In this case it was probably a near perfect match to AncestryDNA’s samples from Ghana which led to this outcome.
***
GHANA (Akan:Ashanti)
***

***
GHANA (Akan: Ashanti)
***

***
GHANA (Akan)
***

***
GHANA (Akan: Ashanti & Sefwe)
***

***
GHANA (Akan: Ashanti?)
***

***
GHANA (Akan: Ashanti)
***

***
GHANA (Akan: Ashanti & Brong-Ahafo)
***
Interestingly a considerable “Mali” score appearing above trace level for this person of partial Brong descent. However during my survey such scores have been uncommon for my Akan survey participants.
***

***
GHANA (Akan?)
***
I have no complete certainty about this person’s background so I suppose that actual distant Nigerian lineage (going back 3 or 4 generations) could indeed be a possibility. As suggested by the 9% “Nigeria” amount. Especially Hausa and Yoruba migrations into Ghana are known to have taken place already long before its independence in 1957. However I suppose it might also simply indicate genetic similarity caused by ancient migrations and shared origins across Lower Guinea.
- Nigerians in Accra: Their stories and successes (Daily Trust, 2017)
***

***
GHANA (Akan?)
***

***
GHANA (Akan: Fante, only 1/2?)
***
This is one of possibly 4 results with a Fante background in my survey. It was only confirmed for one side though so maybe this person’s other parent is of another background. Explaining perhaps the increase in “Benin/Togo”. But who knows perhaps also persons of fully Fante background might get described this way. Afterall their southern location might imply some genetical differentiation when compared with Akan speakers from further north, such as the Ashanti and Brong.
***

***
GHANA (1/2 Akuapem & 1/2 Fante)
***
The Akuapem are an interesting group. Despite being Akan speakers they are said to be a fairly recent “amalgamation of indigenous patriarchal, Volta-Camoe-speaking Guans and matriarchal, Kwa-speaking Akan people“. The Guan people being assumed to have been among the earliest settlers of Ghana! Interestingly the breakdown turned out to be quite balanced also.
- AKUAPEM PEOPLE: GHANA`S ANCIENT GUANS AND AKANS OF THE MOUNTAINS (Trip Down Memory Lane 2013)
***

***
GHANA (1/2 Akuapem & 1/2 Gbe: Ewe)
***
A similar breakdown as the previous one. As will be seen further below the increased “Benin/Togo” amount might also be correlated with this person’s partial Ewe lineage.
***

***
GHANA (3/4 Akan & 1/4 Gur: Frafra)
***
This breakdown could easily be mistaken for one of the results I have seen for people of fully Akan descent. But still this person is aware of atleast one Gur speaking (Frafra) grandparent from Bolgatanga, all the way north. Otherwise one parent selfidentifes as Ashanti and another grandparent would be Fante. Interestingly the so-called “Mali” amount is hardly detectable beyond a slight trace amount.
- Frafra people (Trip Down Memory Lane, 2013)
***

***
GHANA (Akan & Ga-Adangbe)
***
Eventhough belonging to an ethnically mixed person this breakdown is still showing a very convincing “Ivory Coast/Ghana” score. Based on their geographical location as well as their language not being categorized as Gbe it might already be assumed that generally speaking the Ga-Adangbe will be genetically close to the Akan. However given their internal sub-groups and possible inter-ethnic unions from several generations ago with the neighbouring Ewe people undoubtedly there will be greater variation.
***

***
GHANA (Ga-Adangbe)
***
This insightful breakdown provides proof that high “Ivory Coast/Ghana” scores are not exclusive to Akan results. Also interesting to see the 6% “Nigeria” showing up. Even when several scenarios might apply, it’s still intriguing to know that the Ga people (similar to the Ewe) have oral traditions about migrating from southern Nigeria in the last millennium when the famous Benin empire was expanding.
- Origin of the Ga-speaking people of Accra (Watson-Quartey, 2011 / Trip Down Memory Lane, 2013)
The DNA results for this person and the two following Ga-Adangbe persons have been enabled by the very laudable “African Royal DNA Project”.
Its mission is to:
“assist Africans in the Diaspora whose ancestors were forcefully removed from the Continent an opportunity to find their actual biological families. The project also allows the African Royals on the Continent to find out what happened to their families that were taken. “
For more details see their websites:
***

Source: African Royal DNA Project
***
GHANA (Ga-Adangbe)
***
Again very insightful breakdown as it features one of the highest so-called “Mali” amounts reported for a Ghanaian in my survey. Several possible explanations might apply. It would have been interesting to see how typical such a score might be with the addition of more Ga-Adangbe results in my survey.
***

Source: African Royal DNA Project
***
GHANA (Ga-Adangbe: Krobo)
***
Very educational to see these results which look quite different from the two directly above. Highlighting the variation among Ga-Adangbe people. The Krobo being a sub-group which is well known for its cultural traditions. In accordance with the elevated level of “Benin/Togo” shown below one of their probable source of origin is stated to be Sameh in either Benin or Nigeria.
- Krobo people (Trip Down Memory Lane, 2012)
***
Source: African Royal DNA Project
***
GHANA (no further details)
***

***
GHANA (Gur: Champa, possibly distant Hausa)
***
The screenshot below features one of the most evenly divided breakdowns in my Ghanaian survey. With no less than 4 main regions being mentioned, very atypical up to now. Usually the top 2 regions combined are clearly predominant for Ghanaians (>90%). This higher regional concentration being a key aspect to distinguish native African results from those of the Afro-Diaspora, generally speaking (see this overview). Evenso all 4 main regions are still plausible for the Ghanaian context.
Intriguingly these results belong to a person with confirmed origins from northern Ghana. One parent self-identifying as Chamba which is a subgroup of the Konkomba people who are Gur speakers. They have a highly interesting history as it is said they are among the oldest known inhabitants of northern Ghana. Unfortunately their past also includes recurrent conflict with neighbouring ethnic groups. For Afro-descendants in the Americas it is extremely useful to be aware that “Chamba” was also a frequently used ethnonym for enslaved captives in the West Indies!
Also noteworthy is that this person’s family is Hausa-speaking. Actually Hausa is a commonly used lingua franca in northern Ghana, due to its trading diaspora. So actual Hausa descent is not required to be a Hausa speaker in Ghana. But still given the rather elevated “”Nigeria” amount (the second-highest score in my survey) it could be indicative of genuine Hausa lineage I suppose. I was kindly granted access to this person’s DNA matches. And by using my filtering tutorial I was able to find at least 2 matches who seem to be from northern Nigeria (both family names & ethnic regions being plausible). Nothing conclusive as actually the geneflow might also be the other way around, but still a very neat finding!
See also:
- Konkomba, History, Culture, Religion, Economy (M. Herbstein, 2006)
- The Konkomba people (Trip Down Memory Lane, 2013)
- An Historical and Ethnographic Commentary on The Northern Conflict (Katanga, 1994)
- Chart featuring the ethnic origins of runaway slaves in Jamaica, incl. 169 Chamba! (D. Chambers, 2007)
- History of Hausa in Ghana (Zango FM)
***

***
GHANA (Gur & Akan: Mamprusi, Mossi & Fante)
***
Again quite exceptional breakdown. Not only because it features so many different regions. With “Ivory Coast/Ghana” almost ending in last place! But in particular because of the primary score of “Mali”. Very insightful outcome! As I have always suspected from the start that “Mali” might be indicative not only of Mande speaking origins from Upper Guinea but also of Gur speaking origins from Burkina Faso (such as Mossi) and surrounding areas, incl. northern Ghana (such as Mamprusi)! Given this persons mixed ethnic background the other remaining scores could have several explanations.
***

Source: African Royal DNA Project
***
GHANA (Gbe: Ewe)
***
This person of confirmed Ewe background on all lines is being described as practically 100% “Benin/Togo” if you ignore the minuscule Trace regions. It is therefore a very insightful even if perhaps counter-intuitive breakdown for a Ghanaian person. It is by far the highest “Benin/Togo” score I have seen in my survey up till now. The circumstance that “Benin/Togo” seems to be especially peaking for persons of Ewe background is very much suggestive of Ancestry using Gbe samples to calculate their so-called “Benin/Togo” estimates. Not only from Benin but possibly also including actual Ewe samples from Togo! After all that would explain this nearly perfect match to the samples in Ancestry’s database. Interpreted in such a manner this breakdown is actually very coherent!
This outcome also makes for a perfect example to illustrate how the country name labeling by AncestryDNA should not be taken as gospel. Almost all African countries have been colonial creations with borders cutting right through the homelands of ethnic groups. Also very closely related ethnic groups can often be found on both sides of the border. This is indeed the case for the Ewe people and the greater language group of the Gbe they belong to. And especially Togo has very artificially drawn borders. The split-up of Eweland being caused by the takeover of formerly German held colony of Togoland.
- Is “Benin/Togo” really pinpointing origins from within Benin’s borders?
- British Togoland (wikipedia)
- Map of Eweland
***

***
GHANA (Gbe: Ewe)
***

***
GHANA (Gbe: Ewe )
***

***
GHANA (Gbe: Ewe )
***

***
The results above belong to a person who self-identifies as being Ewe. It appears therefore that the “Benin/Togo” amount will show some significant variance for Ewe results (97%-72%-46%), perhaps correlating with deeper ancestry or also with more recent inter-ethnic unions from only a few generations ago. I will need more Ewe survey participants to confirm. But it can already be said that 9% “Cameroon/Congo” does seem very atypical. It is not showing up as a low confidence region. Which increases the odds that this is a genuine finding of probably Central African DNA! I have yet to see such a relatively high amount being reported for Ghanaians or other West Africans, with the exception of Nigerians but in their case it’s plausible given that Cameroon is their neighbouring country.
I am merely speculating here, but generally speaking I would assume that such a surprising instance of seemingly Central African DNA is possibly to be linked to the return movement of formerly enslaved persons from the Americas. Not only from the US or the West Indies but also in fact from Brazil! Accra is still home to the so-called Tabom people for example. These people are often assumed to have been especially of Yoruba descent but perhaps some of them already had multigenerational roots in Brazil and would therefore also be multi-ethnic, incl. some Angolan or Congolese mixed in. Otherwise it might also be due to Congolese Recaptives, although I have only read about them being brought to Sierra Leone and Liberia. However the Krio people from Sierra Leone in turn did migrate to other West African cities, incl. Accra. I suppose actual DNA matches from either these last two countries or more spectacularly from Central Africa itself might offer more clarification. For more details:
- Afro-Brazilians in Ghana (Tabom) (Wikipedia)
- A Slice of Brazil In Accra (Modern Ghana, 2011)
- Historia dos Tabom, Afro-Brasileiros em Acra, Gana (A. Meira Amos & E. Ayesu, 2005)
- Presence of Krio in Accra (Dakubu, 1997)
***
GHANA (Gbe: Ewe & Akan: Fante)
***
Almost 50/50 breakdown with “Benin/Togo” surpassing “Ivory Coast/Ghana” but not by that much. Seems like a fitting outcome for this person with both Ewe and Akan lineage.
***

_______________________________________________________________________
Results from Benin
Chart 4.2 (click to enlarge)

Map 4.2 (click to enlarge)

***
For a long time I could not include any results from Benin in my survey. This is most likely because migrants from Benin are quite uncommon in the US or the UK. And therefore they will appear less frequently within AncestryDNA’s customer database than for example Nigerians or Ghanaians. However in 2018 I was very lucky to add a substantial number to my Beninese survey group (n=9). This addition was enabled by the commendable “African Royal DNA Project”. When it comes to my West African survey results I am very much indebted to this pioneering and powerful project!
Its mission:
“assist Africans in the Diaspora whose ancestors were forcefully removed from the Continent an opportunity to find their actual biological families. The project also allows the African Royals on the Continent to find out what happened to their families that were taken. “
For more details see their websites:
- https://www.dnatestedafricans.org
- http://www.rootstoglory.com
- An Amazing Success Story of DNA Testing and a Benin Reconnection !
Except for one person all my 9 Beninese survey participants are Gbe-speakers. And it turns out that the so-called “Benin/Togo” is indeed quite predictive of genuine Beninese DNA. Their “Benin/Togo” scores (70% on average and with a 79% median, see chart 4.2) are in line with what Ancestry mentions about the score of the “typical native” being 82%! Still also minor but considerable scores of “Nigeria” as well as “Ivory Coast/Ghana” are on display for some individuals.
As discussed in section 3 it seems likely that the samples being used by Ancestry to determine any “Benin/Togo” score are from either southern Benin or southern Togo and belong to a Gbe (Kwa) speaking subgroup. For other ethnic groups (non-Gbe) in Benin a greater variation can be expected. For some groups “Benin/Togo” might then actually only be secondary or even very minor when compared with more prominent scores for either “Nigeria” (Yoruba), “Mali” (Bariba and other Gur-speaking) or even “Senegal” (Fula/Fulfulde). Map 4.2 shows the main ethnic groups living in Benin. Or see also this one which is even more detailed. For further reading:
***
BENIN (Gbe: Ayizo)
***

Source: African Royal DNA Project
***
BENIN (Gbe: Ayizo)
***

Source: African Royal DNA Project
***
Both of these results belong to persons who are from the Ayizo People of Dahomey Kingdom in Allada, Benin. They were made available by the praiseworthy efforts of the African Royal DNA project. A true blessing because as already described above it doesn’t seem likely many other DNA testers from Benin will be forthcoming. Even when Benin holds a tremendous significance for the Afro-Diaspora.
- Royal DNA Results Are In for Benin (Dahomey Kingdom) (African Royal DNA Project, 2017)
Overall speaking these two results seem perfectly in line with their known backgrounds. The Ayizo language belonging to the Gbe language group, just like Ewe and Fon. The minor regional scores for so-called “Ivory Coast/Ghana” and “Nigeria” being consistent with inevitable genetic overlap. However it might be educational to indulge in some speculation concerning the seemingly Central African trace regions (4% “Cameroon/Congo” and 3% “Southeastern Bantu”) shown in the second screenshot. They could very well just be a mere misreading of DNA patches which Ancestry finds hard to classify (hence “low confidence”!). So it might not be relevant for the person in question. But generally speaking I suppose such amounts could also *possibly* be explained by distant Aguda ancestry: formerly enslaved Afro-Brazilians who returned to West Africa in the 1800’s. Adding an intriguing but complicating twist when wanting to interpret DNA results from southern Benin. But also in fact Togo, Ghana and Nigeria.
- Afro-Brazilians in Benin (Aguda) (Orisha Image, 2017)
- Afro-Brazilians in Togo (A.M. Amos, 2001)
- Family of Souza of Benin & Togo (S. de Souza, 2005)
- “Letters from Africa”: The Diaspora of the Diaspora (C. Fonseca, 2001)
***
BENIN (Gbe: Gun/Goun)
***

Source: African Royal DNA Project
***
The results above as well as the following ones all belong to people of the Gun or Goun kingdom around the Beninese capital of Porto Novo. The Gun language they speak belongs to the Gbe language family. Some of the results show an impressive “Benin/Togo” level while others are more varied. Given the location and its historical connections with the Yoruba and people to the west (perhaps also the Mina people?) not that surprising. For more info:
- Chronologie du royaume gun de Hogbonu (Porto-Novo) (1975)
- Youtube video of Gungbe speaker
- Youtube video of African American being reunited with his Benin DNA cousin
BENIN (Gbe: Gun/Goun)
***

Source: African Royal DNA Project
***
BENIN (Gbe: Gun/Goun)
***

Source: African Royal DNA Project
***
BENIN (Gbe: Gun/Goun)
***

Source: African Royal DNA Project
***
BENIN (Gbe: Gun/Goun)
***

Source: African Royal DNA Project
***
BENIN (Dendi)
***

Source: African Royal DNA Project
***
Very special results as the Dendi people are quite unique! As can be seen in map 4.2 they are located all the way in the north of the country, along the border with Niger. Where the closely related Songhay people live. Linked to the famous Songhay empire therefore! Their Dendi language is also quite singular in not only Benin but the whole of West Africa because it is often classified as belonging to the Nilo-Saharan language family. Which could be testament to ancient migrations along the Sahelian corridor.
The African breakdown on display is one of the most evenly mixed among my Benin survey group. Most likely because their DNA is not easily described by the given categories. But what really stands out is the elevated “Mali” score. Indicative of genetic affiliations with people from the West African interior. As also seen for Gur speaking results from Burkina Faso and people from the northern parts of Ivory Coast and Ghana.
- Songhay Empire (Wikipedia)
_______________________________________________________________________
Results from Liberia
Chart 4.3 (click to enlarge)

***
Map 4.3 (click to enlarge)

Source: Ethnologue
***
While reviewing the more detailed statistics I calculated for my Liberian sample group in chart 4.3, keep in mind that averages tend to hide underlying variation. It is always advisable to also take into account other measures such as the median and especially the minimum & maximum values to get a sense of the range of the scores. Naturally also the sample size (mentioned in the row labeled “Number”) is essential to place this data in better perspective. And even more so actual ethnic background!
During my survey it turned out that by far “Ivory Coast/Ghana” is the most characteristic AncestryDNA region appearing for Liberians. Generally speaking and usually also convincingly so (see median score). However this is almost always combined with other main regions showing up. In particular “Senegal”, “Mali”, and “South-Central Hunter-Gatherers”. “Senegal ” being the most important secondary region. It should be kept in mind that none of these regions are confined to their AncestryDNA labeling.
I have ranked these Liberian results based on the amount of highest to lowest score for “Ivory Coast/Ghana”. And despite the obviously limited number of samples an insightful pattern seems to arise already: “Ivory Coast/Ghana” peaks among Liberians with a Kru background. But it is not an actual confirmation of Kru lineage! A complicating factor in my Liberian survey is that most of my survey participants have a mixed ethnic background (within Liberia). More results of Liberians with just one single ethnic background (at least for all 4 grandparents) would be needed to get a clearer picture. The highest “Ivory Coast/Ghana” amount I have seen reported for a confirmed Kru (Grebo) person is 94%. But I strongly suspect that an even higher score of 97% also belongs to a person of Kru descent. A shocking outcome perhaps for people who still take the country name labeling on AncestryDNA too literally 😉 But it actually does make sense if you are aware of the full context.
As discussed in section 3 it seems reasonable to assume that Ancestry not only uses Brong samples from Ghana to determine their “Ivory Coast/Ghana” estimates. But in addition it might also be using both Kru samples and southern Mandé samples from Ivory Coast. Both of these language groups are also represented by closely related ethnic groups in Liberia! So this could very well explain the strong genetic similarity detected with especially Liberian Kru persons. Furthermore it might also be the reason for the still relatively high “Ivory Coast/Ghana” scores being reported for people of southwest Mandé background in Liberia, such as the Kpelle and the Dan/Gio. Again I will need more (unmixed) samples to confirm though.
The only Liberians with decreased “Ivory Coast/Ghana” scores (<50%) in my survey seem to be Liberians with a background which includes ethnic groups living right next to the border with either Sierra Leone or Guinea, such as the Vai and Gbandi. Regrettably I have no full details for the only Liberian to score “Senegal” as a primary region rather than “Ivory Coast /Ghana”. Either way it seems that a greater variation is possibly to be expected for selected ethnic groups in the north. This is however only intended as a tentative statement! It might be particularly insightful to know the results of a person of fully Gola descent. As the Gola language is considered an isolate and the only language within Liberia (along with Kissi) to be grouped within the Atlantic language family (see map 4.3). The consistency of the minor but still distinctive “South-Central Hunter-Gatherers” region among my Liberian sample group has been another very fascinating finding. As it seems to confirm the mythical tales about the very first inhabitants of Liberia! For more details see:
Further reading:
- Liberians: An Introduction to their History and Culture (ed. D. Renard, 2005)
- Overview of Liberian ethnic groups (incl. proportions) (CEFAN, 2015)
- The People Groups of Liberia (H. Vogel, 2012)
- The Grain Coast, Malaguetta Coast or Pepper Coast before 1822 (Liberia: Past & Present)
***
LIBERIA (Kru?)
***

***
Despite the perhaps confusing labeling the so-called “Ivory Coast/Ghana” region seems to be strongly corresponding with Liberian ancestry. At least for Liberians themselves. This is convincingly demonstrated in the screenshot above and also the following ones. Suggesting a near perfect match to the samples contained in Ancestry’s Reference Panel, which are being used to calculate their “Ivory Coast/Ghana” estimates. A fully 100% amount could have been achieved had it not been for the 3% “South-Central Hunter-Gatherers” score. As will be seen in the following screenshots such minor but still clearly detectable amounts are very consistent and typical for Liberian results in my survey.
Because the person behind these results was adopted I regrettably do not have any further details about her background. However I suspect that she could very well be Kru and in particular Krahn, as they may have been the most relatively numerous among the refugees of the immensely tragic Liberian civil war. Either way it is very telling that both a Liberian and a Ghanaian person obtained a 97% “Ivory Coast/Ghana” score. As this is bound to have implications for how Afro-Diasporans should interpret their own so-called “Ivory/Coast/Ghana” scores. I will provide more details in the next section. However right now it might already be useful to point out that this person is part of the so-called “African Caribbean” genetic community (labeled as “migrations”) based on a shared genetic affiliation for “Ivory Coast/Ghana”. I was kindly given permission to view this person’s DNA matches and she has no less than 1,540 matches (30 pages)! Practically all of them either African Americans, Hispanics or West Indians.
***
LIBERIA (Kru: Grebo)
***

***
These results belong to a woman of confirmed Kru descent. Her testresults are also shown in a great Youtube video. It can be seen further below in the video section or by following this link. The remaining amount not shown in the screenshot is 2% “Senegal”. I need more results to confirm but such a breakdown might be quite typical for people who are solely of Kru descent.
***
LIBERIA (Kru & Mandé: Kpelle)
***

***
These results belong to a man of a mixed Kru and Kpelle background. His testresults are also shown in a great Youtube video. It can be seen further below in the video section or by following this link. It might be deemed surprising that his partial Mandé lineage (Kpelle) did not result in higher “Mali” and/or “Senegal” amounts. As it is right now they are both merely reported as trace regions of 2%. While “Ivory Coast/Ghana” is shown convincingly as the predominant region. Due to a lacking number of Liberian results to compare with I can only speculate at this moment. However I would venture to say that *possibly* this outcome is caused by an (assumed) inclusion of Ivorian Mandé samples by AncestryDNA. Again I would need to get more confirmation, however it might explain why both this person’s Kru and Mandé side are described as overwhelmingly “Ivory Coast/Ghana”.
A complicating factor would be that despite being Mandé speaking it could actually be that the Kpelle people during their migrations into Liberia might have absorbed people of other ethnic groups into their ranks, either by cultural assimilation, language shift and/or also inter-ethnic marriages. Another perhaps relevant aspect would be that the Kpelle language is classified as being a southwestern Mandé language, at times also termed “Mandé-Fu”. Despite commonalities this separates the Kpelle language from the so-called Mandé-Tan or also Manding languages which are more commonly associated with the former Mali empire. See also:
***
LIBERIA (Kru: Grebo & Lofa county)
***

***
LIBERIA (Kru: Grebo, Mandé: Kpelle, Atlantic: Gola, and distant “Congo”)
***

***
This breakdown belongs to a person with a rather mixed background. Yet still his primary “Ivory Coast/Ghana” score seems very prominent. Interestingly there is awareness of one distant ancestor (great-grandparent) with repatriated slave heritage, sometimes also known as “Congo” in Liberia. Similar to Sierra Leone also in Liberia many so-called recaptives were brought in for settlement. Apparently because many of these liberated Africans happened to be from slaveships intercepted near the Congo river they were all called “Congo” irrespective of actual provenance. At first a distinction was made between them and the Americo-Liberians, who were rather formerly enslaved persons from the USA. However, over the years the two groups joined and now it seems that the terms “Americo-Liberian” and “Congo” are used interchangeably. Very similar to the formation of the Sierra Leone Krio people. Except that the Liberian term “Congo” seems quite misleading for the much more intricate and varied origins of the Americo-Liberians.
During my survey I have been very careful to seek out any clues of Americo-Liberian lineage as understandably this might complicate a proper interpretation given their rather mixed origins. Despite being very influential they have afterall always been a small minority. According to some estimates about 2.5% of the total population. I am merely speculating here but in this case perhaps the 4% “Nigeria” as well as the 2% “Southeastern Bantu” score might be associated with this person’s Americo-Liberian familyline. However only DNA matches might confirm I suppose.
***
LIBERIA (Kru)
***

***
This person might yet be of an ethnically mixed background, involving also neighbouring Guinea. But there is no certainty about it. Either way the breakdown seems pretty much in line with those of other Kru persons I have seen up till now. The 6% so-called “South-Central Hunter-Gatherer’s” amount is the highest I have seen in my survey. Another Liberian received the same score. As mentioned already a possible connection with Liberia’s earliest inhabitants seems very tempting. I should point out that I did not come across any apparent hint of “Congo” lineage for this person, which might theoretically provide another explanation for the elevated 6% “South-Central Hunter-Gatherers” score.
***
LIBERIA (?)
***

***
LIBERIA (Mandé: Dan/Gio)
***

***
This person’s family is from a Mandé speaking ethnicity called either Dan or Gio. They are located in the border area with Ivory Coast and Guinea Conakry (see map 4.3). Interestingly only 17% of his ancestry is designated as “Mali” while “Ivory Coast/Ghana” is clearly prevailing. As mentioned for the half Kpelle result above *possibly* this outcome is caused by an (assumed) inclusion of Ivorian Mandé samples by AncestryDNA. Perhaps these samples might even belong to the same Dan ethnic group, as they are found across the border as well. And apparently an alternate name of theirs is Yacouba! More results from Mandé speaking Liberians and Ivorians are needed to confirm though.
Even though the 17% “Mali” score might seem minor, it is still showing up quite strongly when we take into account that 1) a “typical native” of Mali is only 39% “Malian” according to Ancestry (see also AncestryDNA Regions) 2) the Liberian group average for “Mali” is 7.6% (n=12). So eventhough it shows up relatively subdued, “Mali” might yet be a significant ethnic marker for this Liberian person.
Still it is also intriguing to speculate what this may imply for the deeper ancestral origins of Mandé speaking groups in Liberia. It is known historically they were last to arrive in Liberia (Atlantic/Mel speaking groups being assumed to have settled first followed by Kru speakers from the east, see also this link). And they might have absorbed many previous inhabitants among their ranks by intermarriage and/or language shift. The Dan/Gio language is being classified as a southeastern Mandé version. Sharing many commonalities with the central and more “classic” Mandé languages but still also separate. Implying different historical and possibly also different genetical trajectories. Again I will need more samples to confirm though. A perhaps hardly noticeable hint but still meaningful could be the trace amount of <1% for “South-Central Hunter-Gatherers”. This is the lowest amount I have observed for Liberians and might suggest a minimal intermingling with strictly coastal populations.
***
LIBERIA (1/2 Kru: Bassa & ?)
***

***
I have only full confirmation for one side of this person’s family. This person might yet be of an ethnically mixed background, incl. also distant Americo-Liberian. But there is no certainty about it. Either way the breakdown seems pretty much in line with those of other Kru persons I have seen up till now. Except perhaps for the 4% “Southeastern Bantu”. Which is the third-highest such score I have observed for Liberians.
***
LIBERIA (no further details)
***

***
Regrettably no further details available for this persons background. However all the main regions seem perfectly in line with what I have observed during this survey. Except that the 6% “South-Central Hunter-Gatherers” is very distinctive. The highest such score for Liberians up till now.
***
LIBERIA (1/2 Kru: Grebo & 1/2 Mandé: Vai)
***

***
LIBERIA (?)
***

***
LIBERIA (Mandé: Vai, Gbandi & Kru: Bassa & distant West Indian)
***

***
Yet again a person of quite mixed origins (within Liberia). However for the first time we can see how “Ivory Coast/Ghana” can also be relatively low (<50%) for Liberians. Both “Senegal” and “Mali” amounts are above group average. With especially the “Mali” score standing out! It seems very likely that this outcome is correlating with her partial Mandé side (Vai & Gbandi). As her confirmed Kru lineage (Bassa) would only apply for one grandparent. Interestingly unlike the Gbandi language and most other Liberian Mandé languages the Vai language is classified as being similar to the central versions, incl. Manding. It would be very insightful to compare with the results for a person of fully Vai descent.
The great-aunts of this person’s grandfather are said to have been formerly enslaved West Indians. This might appear to be quite distant but still would account for a sizeable degree of Americo-Liberian lineage (1/16?). The strikingly elevated scores for “Cameroon/Congo and “Southeastern Bantu” already seem quite suggestive as combined they are the highest such scores I have observed for Liberians. Despite being “low confidence” regions at this increased level the possibility of minor Central African DNA seems quite realistic.
Intriguingly the trace amount of European admixture also seems very indicative of such a heritage. It is showing up as <1% so-called “Iberian Peninsula” which in itself is not to be taken too literally. It could be a misreading of other types of western or also southern European DNA. And actually even North African DNA is often described by this category. Which sometimes results in minor scores of this region being reported for Fula people! Given the various possibilities it will be very instructive to have a closer look into the DNA matches.
I was kindly granted access to this person’s DNA matches. I first scanned all of them and then I filtered them for both 100% African as well as 100% European profiles (see this tutorial). Amazingly out of a total of 3,372 DNA matches (68 pages!) it seems that she has over 500 European-American matches! Some of them with also quite large shared DNA segments (around 20cM). Now it might be that actually in some cases there might be some hick up in Ancestry’s algorithm and these matches in fact are not 100% European genetically speaking. Sometimes due to privacy settings Ancestry does not display all of the ethnic regions for your matches. Which could imply that it’s them who would have some distant African ancestor rather than the other way around. Still I think the odds are high that she indeed has some distant European ancestor by way of the West Indies. Looking at the African matches, (possibly about 17), most of them seem to be from Liberia as expected. This is going by plausible family names as well as ethnic regions. Also a few matches could be from Sierra Leone and Guinea. Interestingly two profiles might be be partially Senegalese and one match might be Nigerian! Again possibly an indication of distant West Indian lineage.
***
LIBERIA (Mandé: 1/2 Kpelle & ?)
***

***
Unfortunately I have no full details about this person’s background. Except that one side of her family would be Kpelle. However just like the previous breakdown again “Ivory Coast/Ghana” is quite subdued while “Mali” and especially “Senegal” are showing up very strongly. Another noteworthy aspect of this breakdown would be the 8% “Cameroon/Congo”, the highest such score I have seen in my Liberian survey. Possibly together with the 4% “Nigeria” it might be indicative of distant Americo-Liberian ancestry. I can only speculate in regards to the other half of this person’s background but I suspect that another Mandé line could very well be included as well.
***
LIBERIA (northern?)
***

***
This is the only Liberian result in my survey to show not “Ivory Coast/Ghana” but rather “Senegal” as primary region. It demonstrates how so-called “Senegal” can be reported in significant amounts as far south as Liberia. Also the “Mali” amount is in fact very impressive and the second-highest in my Liberian survey. Regrettably I have no further details on this persons background beyond that he was adopted from Liberia. Just from the looks of it such a breakdown might very well also belong to a person from Guinea or Sierra Leone.
I have kindly been granted access to the DNA matches for this person and by applying my filtering tutorial I was able to zoom into possibly 11 African profiles out of a total of 1,146 DNA matches (23 pages). Intriguingly most of his African matches appear to be from either Sierra Leone or Guinea (7x) (going by family names, ethnic regions and 1 time also birth place) rather than from Liberia (3x). One single match might even be a Hausa-Fulani from Nigeria, undoubtedly then related by way of a Fula line. Many ancestral scenario’s could be valid, incl. also being descended from recent migrants from neighbouring countries. But either way it illustrates how both Liberia and Ivory Coast are somewhat intermediate between Lower Guinea and Upper Guinea.
_______________________________________________________________________
Results from Ivory Coast
Chart 4.4 (click to enlarge)

***
Map 4.4 (click to enlarge)

Source: Wikipedia
***
While reviewing the more detailed statistics I calculated for my Ivorian sample group in chart 4.4, keep in mind that averages tend to hide underlying variation. It’s always advisable to also take into account other measures such as the median and especially the minimum & maximum values to get a sense of the range of the scores. Naturally also the sample size (mentioned in the row labeled “Number”) is essential to place this data in better perspective. And even more so actual ethnic background!
I have not been able to include that many results from the Ivory Coast. This is most likely because Ivorian migrants are relatively uncommon in the US or the UK. Therefore Ivorians will appear less frequently within AncestryDNA’s cusomer database than for example Liberians or Ghanaians. Nevertheless going by Ancestry’s own information as well as my survey findings, the so-called “Ivory Coast/Ghana” can indeed be quite predictive of genuine Ivorian DNA. However this is almost always combined with other main regions showing up.
I should point out though that among my Ivorian survey participants three family members are included (mother & two children) who have distant Krio lineage from Sierra Leone. This possibly explains some of the “Benin/Togo” scores I observed for them. Even when in fact another Ivorian result of Senoufo background showed the highest so-called “Benin/Togo” score. So-called “Mali” is the most important secondary region and I suspect this will be maintained also when other Ivorian results will be added to my survey. It should be kept in mind that currently AncestryDNA does not have any separate region to describe Gur speaking affiliations (incl. Senoufo, even when nowadays it’s classified as a separate language group). So any so-called “Mali” score might in fact also be connected rather with Burkina Faso.
As discussed in section 3 it seems likely that one part of the samples being used by Ancestry to determine their “Ivory Coast/Ghana” estimates are Brong, an Akan subgroup. While there is a possibility that in addition Ivorian samples were used with a Kru background as well as a southern Mandé background. I have no certainty about this though. If true this sample selection would however already cover 3 out of the 4 main Ivorian language groups (Akan, Kru, Mandé). The notable exception being the Gur/Senoufo as already pointed out above (referred to as “Voltaiques” in map 4.4). Either way, a greater degree of variation is to be expected given the rather complex ethno-linguistic situation of the Ivory Coast. Perhaps correlating mostly with a north-south axis. It would have been interesting to see if in addition of “Mali” also substantial “Senegal” scores may be reported for people from the northwest of Ivory Coast. For southern Ivorians it would have been fascinating to see if the tendency of minor but relatively pronounced so-called “South-Central Hunter-Gatherers” scores would be maintained.
My Ivorian survey findings would not have been possible without my Ivorian amie J. 😉 She not only shared very insightful DNA results from herself and her family with me. But in addition she also shared her profound thoughts with me about DNA testing and Côte d’Ivoire’s history, as well as providing useful sources. I was greatly inspired by her in my discussion about the Ivorian samples in Ancestry’s Reference Panel and the ancient migrations taking place in West Africa. So here’s a shout-out en français: J, je te remercie énormément pour ton aide, tu es vraiment géniale!
For further reading:
- Ancient migrations into Southeast Ivory Coast (M. Pescay, 1967)
- Les Akan: peuples et civilisations (K.R. Allou, 2015)
- Effects of Samori Toure’s conquests in Senoufo land (Tagouana, Djimini, 1885-1890) (M. Bamba & K. Kiyali, 2016)
- Histoire des Fohobélé de Côte d’Ivoire: une population sénoufo inconnue (F. Ouattara Tiona, 1999)
***
IVORY COAST (Akan: Agni/Aowin)
***

***
Highest “Ivory Coast/Ghana” score obtained for an Ivorian of Akan descent in my survey. Three other people also received the exact same amount, 2 Ghanaians of likewise Akan descent and also a Liberian of most likely Kru descent. Interesting to compare the minor trace regions for each. For the Ivorian above it is 3 % “Mali”. For the Ghanaians however it is 2% “Benin/Togo” combined with 1% “Mali” for one and for the other it is again 1% Benin/Togo, 1% “Nigeria” and 1% Cameroon/Congo”. So a clear shift eastwards. For the Liberian it was rather 3% South-Central Hunter-Gatherer”. Although only trace amounts still some subtle differentiation it seems therefore.
***
IVORY COAST (7/8 Akan: 1/2 Lagunaire, 3/8 Baule & 1/8 Krio)
***

***
This was the first ever West African result to be included in my AncestryDNA survey already a couple of years ago. As I have always said from the beginning the best way to learn about the accuracy of admixture analysis in DNA testing is by closely studying the results of people who can actually verify their background. This breakdown still is tremendously helpful in this regard and I remain grateful it was shared with me back then by J. 🙂
Judging from this 1 individual result the “Ivory Coast/Ghana” category can be very predictive also for someone of Ivorian descent! Undoubtedly this reflects her mostly Akan background. The breakdown mentions 83% for “Ivory Coast/Ghana” but according to the range given it could be as high as 94%. Ancestry performs 40 separate estimates for each region and 83% would be the average of these 40 runs. 83% is also pretty much the same as the 86% scored by the “typical native” from Ivory Coast/Ghana according to Ancestry. This 86% being the median result of their 99 samples (see AncestryDNA Regions for more details).
I am also blown away by how the minor “Nigeria” % seems to be pretty much in line even, with her 1 non-Ivorian great grandparent who is Krio, the descendants of ex-slaves from the USA, maroons from Jamaica as well as liberated slaves from all parts of West/Central Africa being settled in Freetown/Sierra Leone. It is known many of them were Yoruba so some minor “Nigeria'” would fit well. Some of the trace regions might also be explained by the very diverse Krio background but it cannot be ruled out that they may actually also be associated with her Akan side, especially the “Mali” score. Despite the low confidence being attached to trace regions the distinctive “South-Central Hunter-Gatherers” score might still be a very meaningful finding.
I was also given access to her DNA matches. And by using my filtering tutorial I was able to find some very fascinating West African matches. Out of a total of 551 DNA matches (12 pages) 11 matches are almost certainly West Africans. Aside from her brother & mother (see below) one other profile appeared to be Ivorian, quite likely Kru (Guéré, Wè). Another profile could be confirmed to belong to a Liberian, most likely also Kru. All other remaining 7 matches were from Ghana (judging from plausible family names and ethnic regions). Intriguingly many of her Ghananian matches do not appear to be Akan, or only partially so. In fact 6 of them had “Benin/Togo” mentioned as biggest region in their profile preview. Also for one of them I could confirm by way of family tree details a Volta region background, near the border with Togo! Without further confirmation several ancestral scenarios could apply. However as suggested by J. herself a probable explanation might be the known migrations into southeastern Ivory Coast coming from eastern Ghana. See also:
- Baule people (Trip Down Memory Lane, 2012)
- Ebrie people (Akan Lagunaire) (Trip Down Memory Lane, 2013)
- Krio from Sierra Leone: Afro-Diasporans with a twist? (Tracing African Roots, 2015)
- Krobo migrations into Ivory Coast (K.R. Allou, 2015)
***
IVORY COAST (7/8 Akan: 1/2 Lagunaire, 3/8 Baule & 1/8 Krio)
***

***
These results belong to the brother of the first Ivorian person I featured above. The results below belong to their mother. It provides a very useful illustration of recombination. Due to the random nature of genetic inheritance her brother ended up with a markedly higher “Mali” proportion than herself (21% vs 3%). Judging by his mother’s results shown below (27% “Mali”) he might have received this part of his DNA firstmost through his maternal side, who is mostly Baule. Although only a comparison with his father’s results could clarify this conclusively. His father being fully Akan Lagunaire/Lagoon (mainly Attie but also Ebrie and Abbey).
I wouldn’t be surprised if the “Nigeria” scores reported for him (5%) and his sister (6%) also exclusively come from their mother’s side, given her partial Krio connection and possibly distant Yoruba lineage. But it’s still possible that also their fully Akan father shows some small amounts for these regions as well. Afterall in my Ghanaian survey I have seen maximum scores of 9% “Mali” and 10% “Nigeria” being reported for Akan persons (see chart 4.1). Even when on average it’s much more subdued and often absent. See also:
- Random nature of genetic inheritance (Ancestry)
***
IVORY COAST (3/4 Akan: Baule & 1/4 Krio)
***

***
These results belong to the mother of the two previous persons. She has one grandparent of Krio descent from Sierra Leone/Gambia. Given the possibly ultimate Yoruba lineage involved the 13% “Benin/Togo” and 7% “Nigeria” could very well be reflecting the Krio side of her family tree. Perhaps the 2% “Cameroon/Congo and 2% “South-Central Hunter-Gatherer’s” amounts are to be added as well. As this would complete an approximately 25% genetic inheritance. However judging from the very few Krio results I have seen they also tend to score “Ivory Coast/Ghana”, so I suppose it cannot be ruled out that some minor % of this region could also be part of her Krio heritage.
Otherwise this person’s results would be reflecting her Baule side. And it seems very noteworthy that a relatively high so-called “Mali” score is obtained. Especially when contrasting with the relatively subdued level of “Mali” scores for my Ghanaian Akan samples (2% on average, see chart 4.1). The history of Baule migration into presentday Ivory Coast and in particular their relationships with other populations already residing there is quite distinctive when compared with Ghanaian Akan. It might not be too surprising therefore that genetically speaking the Baule can no longer be described in the exact same way as Akan people from Ghana. I will need more Baule samples to confirm any pattern though.
I was also given the opportunity to have a closer look into her DNA matches. And by using my filtering tutorial I was able to find some very fascinating West African matches. Out of a total of 901 DNA matches (19 pages) 21 matches are almost certainly West Africans. Very useful to compare with her daughter’s matches. First of all because any shared matches will increase the odds of them not being false positives (IBS) but rather IBD (Identical By Descent). This was indeed the case for nearly all African matches of her daughter which she also received except one from Liberia. Overall speaking however she received notably more matches than her daughter, undoubtedly because of her Krio grandparent. Plus unlike her daughter and son she got assigned to a genetic community for African Caribbeans (renamed into “migrations” after Ancestry’s latest update). Highlighting her closer links to the Afro-Diaspora (as represented by Ancestry’s customers). Interestingly also the African matches were more numerous. Most were again from Ghana, but intriguingly one of them might be from Nigeria!
***
IVORY COAST (Senoufo)
***

Source: African Royal DNA Project
***
Very remarkable breakdown shown above. It features one of the highest “Mali” score I have observed in my entire West African survey. Demonstrating that the so-called “Mali” region is not exclusive to Mandé speakers but could also be indicative of Gur and Senoufo origins! Up till recently the Senoufo language group used to be classified under the Gur language group. This larger language family is to be found in the northern parts of Ivory Coast, Ghana, Benin as well as Burkina Faso and Mali.
AncestryDNA does not have any separate region yet for Burkina Faso (which is mostly Gur speaking, see this map). Otherwise this person’s breakdown would probably look a lot different because of closer genetic similarity. Right now any significant Gur/Senoufo affinity is more likely to be described as a composite of not only “Mali” and “Ivory Coast/Ghana”, but apparently also “Benin/Togo“! Especially the rather strong appearance of that last region might be surprising. It will be interesting to see if the same pattern also continues for other Senoufo/Gur speaking results or that perhaps this individual result turns out to have been less typical. Either way this result does indicate very clearly that a greater variation of Ivorian AncestryDNA results is to be expected, in line with actual ethnic background.
***
_______________________________________________________________________
Youtube Videos
***
LIBERIA (Kru: Grebo)
***
***
LIBERIA (Kru: Krahn & Mandé: Gio/Dan)
***
***
LIBERIA (Kru & Mandé: Kpelle)
***
***
IVORY COAST (Kru: Guéré)
***
***
IVORY COAST (Akan, Mandé & Kru: Baoulé, Malinké, Gouro) [UPDATED RESULTS]
***
***
GHANA (Akan: Ashanti?)
***
***
GHANA (Akan?)
***
***
__________________________________
5) Implications for Afro-Diasporans
To conclude this page I will now describe some of the most important implications for Afro-Diasporans in an attempt to improve proper interpretation of their West African regional scores, in particular for “Ivory Coast/Ghana” and “Benin/Togo”. This section firstmost reflects my own reasoning and naturally other interpretations remain possible as well. As always context is everything and solid genealogical research combined with historical plausibility should be leading instead of wishful thinking.
1) “Ivory Coast/Ghana” does not cover full extent of Ivorian & Ghanaian DNA
- The Ghanaian & Ivorian origins of Afro-Descendants in the Americas will indeed primarily be described by “Ivory Coast/Ghana” on AncestryDNA. But to a lesser degree also by “Benin/Togo” and “Mali”. As these are the major secondary regions reported for Ghanaians and Ivorians in my survey. The major secondary regions for Liberians have been “Senegal” & “Mali”.
2) “Ivory Coast/Ghana” is also predictive of Liberian & Sierra Leonean DNA
- The so-called “Ivory Coast/Ghana” region is indeed quite predictive of both Ghanaian and Ivorian origins. However in addition ancestry from Liberia and to a lesser degree (southern) Sierra Leone might also be described by this region. You will need to perform your own follow-up research in order to find out more specifics.
3) “Benin/Togo” is also predictive of Ghanaian & Nigerian DNA
- The so-called “Benin/Togo” region seems to be quite predictive of Beninese origins (based on nine results). However in addition ancestry from eastern Ghana and southern Nigeria might also be described by this region. You will need to perform your own follow-up research in order to find out more specifics.
4) “SC Hunter-Gathers” can also be predictive of West African ancestors
- In particular Liberian, Ivorian and Sierra Leonean ancestors might have passed on so-called “Africa South-Central Hunter-Gatherers” DNA markers, which are also present in their own genome. The “Africa South-Central” labeling by AncestryDNA is therefore not to be taken too literally. Despite usually appearing as “low confidence” trace region this still represents a very distinctive type of DNA. For more discussion see:
“Ivory Coast/Ghana” & “Benin/Togo” quite predictive
Chart 5.1 (click to enlarge)

***
A very insightful selection of West African AncestryDNA results has been shown on this page. Even if still quite limited in number and scope. Keeping in mind the relevant context and limitations already discussed in the previous sections it seems that the “Ivory Coast/Ghana” and the “Benin/Togo” regions are both reasonably predictive. This is going both by my own preliminary survey findings (see chart 2.1) as well as by Ancestry’s own information in regards to how the “typical native” scores: respectively 86% for “Ivory Coast/Ghana) (n=115) and 82% for “Benin/Togo” (n=60). Also when comparing with the predictive accuracy of other regions (see chart 5.1 above) “Ivory Coast/Ghana” and “Benin/Togo” perform fairly well. Better than for example “Nigeria” and “Mali”.
After going through this whole page it should be abundantly clear that the regional labeling by AncestryDNA is not intended to be taken too literally! My survey findings seem to indicate that ethno-linguistic background will be a more relevant determinant for West African AncestryDNA results rather than nationality per se. Correlating with the selection of West African samples by AncestryDNA in their reference panel and how well these samples happen to match with someone’s DNA. The regional percentages reported by AncestryDNA firstmost signal close genetic similarity to the samples taken from the countries or areas after which the regions have been named. And not actual descent or some kind of blood quantum as is too often assumed. The regional scores are also often reflective of ancient migrations & overlapping genetics/geography rather than any recent lineage (see section 3 for more detailed discussion).
Admixture analysis such as provided by AncestryDNA is often drawing criticism for not being in line with unrealistic expectations. Specifically in regards to how ancestral categories should conform exactly to a person’s family tree and all the known ethnic lineage it may contain. Disregarding how such over-specified information is simply not to be found in our DNA. Atleast not given the current state of knowledge. However I myself do strongly believe that AncestryDNA’s Ethnicity Estimates can still be of great informational value as long as you know how to correctly interpret them; educate yourself about inherent restrictions; as well as combine with other research findings.
One factor many critics fail to take into account is that Afro-descendants usually do not have the privilege of being able to fall back on paper trails when wanting to learn more about their African origins. Because of this lack of viable alternative Afro-Diasporans cannot afford to be snobbish about the imperfections of admixture analysis. Basically we will want to maximize all the informational value we can obtain. Taking any promising lead we can get and combine with other clues. Seeing the glass as half full and not half empty. Rather than be overcritical and risk loosing out on helpful information, even when only approximate or incomplete. Your admixture results will always be relevant to put things in perspective. If only to be able to (roughly) distinguish between major sources of ancestral origins versus minor lineage.
Instead of taking a generalizing and dismissive stance each aspect of admixture analysis should be judged on its own strenghts and weaknesses. Precisely because of its still unrivaled West African regional specificity I find AncestryDNA (2013-2018 version) to have been more insightful than anything on offer by other commercial DNA testing companies as well as any thirdparty analysis such as available on Ged-Match, DNA Land etc.. At least up till the latest update in 2018/2019 by 23andme.3 My assessment is based on the more than 500 AncestryDNA results of native Africans I have seen by now. Which were usually in alignment (broadly) with their verifiable background (see this overview). Also my survey of Afro-Diaspora results was largely a confirmation of historically documented African origins for each nationality. Again such potentially profound information is not something to carelessly brush aside when wanting to Trace African Roots!
Combining various levels of regional resolution
Map 5.1 (click to enlarge)

***
The three maps shown above illustrate three different levels of regional resolution which may all be useful when wanting to explore your West African origins. On the left the various bigger language groups of western Africa are being displayed. As discussed in section 3 these language groups tend to overlap to a great extent with AncestryDNA’s West African regions which are displayed in the right bottom corner. For a historical perspective I have also included a map which lays out all the relevant slave trade regions for West Africa. Again seemingly corresponding with AncestryDNA’s regions. The two-way distinction being made between Upper Guinea & Lower Guinea will not only be helpful to connect the dots when it comes to Afro-Diasporan history. In fact it may also lead to a greater understanding of genetic overlap patterns within West Africa and identifying West Africa’s main (pre)historical driving forces before the advent of Europeans.
Combining insights from various disciplines is central to my personal research strategy. Always looking for complementarity, correct interpretation & plausibility. Critical but also staying open-minded and careful not to be dismissive when informational value can still be obtained. From my experience it can be very beneficial to acquire a basic grasp of this interplay between genetics, ethno-linguistics and (pre)history. It has definitely provided a deeper understanding of my own personal African origins as a Cape Verdean descendant. And in addition it has also clarified many of the questions which came up during my ongoing AncestryDNA survey. Helping me to see the origins of not only the Afro-Diaspora but also Africans themselves in much sharper focus.
Obviously we’re not dealing here with exact science. The causal relationships will be complex, tentative and multi-faceted. Categories will tend to be blurry, overlapping and not just strictly “black or white”. Just like in real life 😉 Understandably many people desire to have the most specific degree of resolution when searching for their African roots. They want to be able to pinpoint their exact ethnic origins and preferably also know the exact location of their ancestral village. In a way following in the footsteps of the still very influential ROOTS author Alex Haley. See also:
- Is it possible to pinpoint a plausible ethnic origin for one’s African bloodline? (Tracing African Roots)
- What can be learnt from AncestryDNA when trying to trace African ancestry? (Tracing African Roots)
Unfortunately these are rather unrealistic expectations to have in regards to DNA testing. Not only given current scientific possibilities. But also because such expectations rest on widely spread misconceptions about ethnicity, genetics, genealogy as well as Afro-Diasporan history. Too often people ignore how the melting pot concept is really nothing new but has always existed, also in Africa! Generally speaking ethnicity is a fluid concept which is constantly being redefined across time and place. Too often people fail to take into consideration how due to genetic recombination our DNA will never be a perfect reflection of our family tree but might actually also at times suggest very ancient migrations. Too often people underestimate the actual number of relocated African-born ancestors they might have (dozens or even hundreds!) and the inevitable ethnic blending which must have taken place across the generations. Too often people are still not informing themselves properly about Africa itself and the documented origins of the Afro-Diaspora. Many specific details might have been lost forever but there is a wealth of solid and unbiased sources available which can help you see both the greater picture as well as zoom in more closely to your own relevant context. See also:
- Fictional Family Tree incl. African Born Ancestors (Tracing African Roots)
- DNA studies for Africans and Afro-Diasporans (Tracing African Roots)
- Documented ethnic/regional origins of the Afro-Diaspora (Tracing African Roots)
- Maps (ethnolinguistic, slave trade, various parts of Africa) (Tracing African Roots)
AncestryDNA might not provide the “100% accurate” ethnic granularity many people unrealistically wish for. But it does offer a regional format which goes one big step beyond just describing your DNA as “West African”. Unlike any of its commercial competitors AncestryDNA is able to distinguish no less than 5 different West African regions. In addition its 2013-2018 version also did a reasonable job at separating West African DNA from Central/Southern African DNA (“Cameroon/Congo” and “Southeastern Bantu”). Which is essential for getting a full scope perspective on the origins of the Afro-Diaspora. Therefore AncestryDNA’s analysis during 2013-2018 of African DNA (k=9) had a huge advantage above for example 23andme’s inadequate African regional resolution (k=4) within that same timeperiod (2013-2018). Typically both West Africans and confusingly also Central and Southern Africans, as well as their Afro-descendants in the Diaspora were described as predominantly “West African” on 23andme (before their 2018/2019 update), as if applying some kind of monolithic blanket term for Niger-Congo speaking origins. See also:
The analysis performed by AncestryDNA, even when pioneering and already very valuable in my estimation, is still only a first rudimentary step in deciphering one’s origins within Africa. The current nine African regions might very well have different ethnic implications for each separate nationality within the Afro-Diaspora but also in individual cases. Follow-up research may enable you to still zoom in closer to more specific West African lineage. In this regard group averages of AncestryDNA results for West African ethnic groups or nationalities can be very helpful in order to know what to expect more or less. And also in order to make a proper inference of how you yourself fit in the scheme given any other ancestral clues you might have. Even when entangling the intricate origins of an Afro-Diasporan will by default almost always be very tricky. Being aware of the greater interrelatedness of African genetics, history and ethnicity as shown in map 5.1 may still provide added value to your initial results and produce new research findings.
How to make more sense of “Ivory Coast/Ghana” scores
Map 5.2 (click to enlarge)
Source: http://www.ancestry.com. (text in red added by myself)
***
Performing follow-up research based on your AncestryDNA score for the so-called “Ivory Coast/Ghana” region might very well enhance your understanding of the actual ancestors who passed on this part of your DNA. In some cases it might even help you pinpoint specific ethnic lineage! However as always it pays to be careful and not jump to conclusions, lest you may misidentify any of your ancestors. Below I will just describe a schematic approach. Intended in the first place for people with substantial amounts of “Ivory Coast/Ghana”.4 Naturally other approaches can be fruitful as well.
Some considerations
- Realize that any so-called “Ivory Coast/Ghana” % can also be indicative of either Liberian or Sierra Leonean DNA (among other less likely possibilities which I will exclude for now because of decreased odds)5.
- Realize that your “Ivory Coast/Ghana” amount is likely to be traced back to numerous family lines and not just one (unless you happen to have relatively recent West African ancestry). Just as an example: a 25% score “Ivory Coast/Ghana” for a typical Jamaican might be due to the genetic contributions of inbetween 15 to 50 different African-born ancestors. On average the DNA contribution of an ancestor living in the mid 1700’s could be around 0.5%-1.5%. See also:
- Realize that therefore your “Ivory Coast/Ghana” score could include ancestors from various countries, all at the same time. For example a 25% score “Ivory Coast/Ghana” for a typical African American might be traced back to 10 ancestors from Ghana, 5 ancestors from Liberia and 5 ancestors from Sierra Leone.
Action plan:
- Build up your family tree and attempt to trace back to your earliest known ancestral location in the Americas for all lines. The so-called “migrations” (a.k.a. genetic communities) you have been assigned to by AncestryDNA will usually be quite indicative in this regard! For example for African Americans it might be truly worthwhile to know if most of their ancestry is to be traced back to either Virginia or South Carolina. For West Indians it will be useful to know if there has been any inter-island migration within their family tree.
- Research the documented slave trade patterns for these earliest known ancestral locations. This will give you an approximate idea of the odds involved with having for example either Liberian or Ghanaian ancestry. It’s advisable to also study all other relevant aspects of local history (incl. possibly African retention) associated with these earliest known ancestral locations in the Americas. See also:
- Trans Atlantic Slave Trade Database
- Discussion in next section
- Perform a full scan of your DNA matches and filter them for 100% African profiles. Determine if there are any matches among them from Ghana, Liberia Ivory Coast or Sierra Leone. Be sure to also check if “Ivory Coast/Ghana” is being reported for them as a main region.6 Provided they are genuine IBD matches this could directly inform you if you happen to have any lineage from Liberia, Ghana etc.. However many reservations are to be taken into consideration! Firstly your MRCA might not be of the same background as your match. Also be aware that these matches will give you an indication of only one single family line. Furthermore realize that certain West African nationalities (Ivory Coast, Burkina Faso, Benin, Togo) are underrepresented among Ancestry’s customer database, while others might be fairly well represented (Liberia, Ghana, Nigeria). Stacking the odds in favour of receiving matches from those last countries. Which however may not per se be in line with their overall proportional contribution to your DNA. Moreover absence of evidence is not evidence of absence!
- How to find those elusive African DNA matches on Ancestry (Tracing African Roots)
- Try fitting your West African matches into your family tree. This will be very tricky given scanty information and will also require a lot of patience. But it might still be worthwhile for eventually zooming in closer to your West African origins along a certain family line or even actually identifying a West African ancestor! Breaking down those brick walls based on paper trails! Having either your parents or other close family members also DNA tested will of course be greatly helpful. Especially if they share the same West African matches with you. However any shared matches for your West African match might do the trick I suppose. As long as you can figure out how these shared matches are to be placed in your family tree. More advanced techniques such as triangulation and DNA painting might also open up promising avenues.
- Benefits of Triangulation (Segmentology)
- Using DNA Painter to reconstruct ancestral DNA (Ultimate Family Historians)
“Ivory Coast/Ghana” across West Africa & the Diaspora (sorted)
Chart 5.2 (click to enlarge)

***
Chart 5.3 (click to enlarge)

Source: TAST Database (2018). Follow this link for underlying numbers.
***
Chart 5.2 is displaying the findings of my survey of both Afro-Diaspora as well as West African AncestryDNA results as of February 2018 (see this page for a complete and up-to-date overview). Eventhough due to limited samplesize this data is preliminary it is still also cross-sectional because it was collected at random from various parts of the Diaspora and also within West Africa. Overall contributing to the robustness of the data. Chart 5.3 is taken from the Trans Atlantic Slave Voyages Database and features the proportional shares of each African slave trade region for selected parts of the Diaspora.7 The share of the so-called Gold Coast being highlighted, this would conform to the coastline of modernday Ghana. See also this map.
We can establish that the so-called “Ivory Coast/Ghana” region is most prevalent among first Liberians, followed by Ghanaians and Ivorians. Also take note that as expected among other West Africans it is most subdued for Beninese and Nigerians. Given the discussion in the previous sections this outcome can be considered as roughly corroborating the prediction accuracy of the “Ivory Coast/Ghana” region among West Africans themselves.
In regards to the Afro-Diaspora we can observe how “Ivory Coast/Ghana” is peaking for Anglo-Caribbeans while it is most subdued for Brazilians, Cape Verdeans and Mexicans. This conforms with what we know already about slave trade patterns. The Gold Coast being heavily visited by especially English slave traders but also Dutch ones (see chart 5.3). The Gold Coast Diaspora arguably being the greatest in the West Indies. While Upper Guinea and Central Africa are overwhelmingly the most important areas of provenance for Cape Verdeans, Mexicans and Brazilians. So again this would seem to be corroborating the prediction accuracy of the “Ivory Coast/Ghana” region.
It’s interesting to ponder about a finer-grained composition of these “Ivory Coast/Ghana” scores (distinguishing between genuine Ghanaian origins versus Liberian origins etc.) for Jamaicans, Barbadians and Guyanese. We should then naturally also take into consideration the slave trade records for Windward Coast and Sierra Leone. While furthermore keeping in mind that Guyana was supplied with African captives also by the Dutch as after all Guyana used to be a Dutch colony, just like Surinam. From such a perspective it seems that so-called “Ivory Coast/Ghana” might entail the most varied origins for Guyana (as well as Surinam) and a follow-up research into possible Liberian, Ivorian or Sierra Leonean origins could potentially be most beneficial for them.
Also noteworthy how “Ivory Coast/Ghana” shows up more strongly for Haitians than might have been expected based on documented slave trade records: 15,1% “Ivory Coast/Ghana” versus 4.6% Gold Coast (Haiti is referred to as Saint Domingue in chart 5.3). This outcome is most likely to be explained by undocumented contraband slave trade by the English into Haiti by way of either Jamaica or Barbados. However otherwise also genetic ties due to slave trade with both Sierra Leone and the Windward Coast will be reflected. Also including actual Ivory Coast connections (Cap Lahou)! See also:
- Kap Lawou Kanga: What’s in a Name? (Bookmanlit)
This factor of largely undocumented slave trade is even more valid for the Hispanic Caribbean which also received captives by way of French, Dutch and Danish contraband traders. And in addition we should probably also take into account post-colonial migrations by English speaking West Indians into Puerto Rico and the Dominican Republic. Making for a rather convoluted situation which thanks to genetics is now however becoming more clearer. I suspect that for Hispanic Caribbeans with a relatively larger total amount of African DNA (>50%) also an increased relative share of “Ivory Coast/Ghana” might be observed. Especially for Puerto Ricans. In line perhaps with more recent African origins (1700’s/1800’s versus 1500’s/1600’s). I will devote a separate blog post to this topic eventually.
The data for the USA is somewhat intermediate in all of this. However it is striking how the estimated slave trade from Gold Coast (9-13%) into the US is lower than their group average for “Ivory Coast/Ghana” (19.6%). Inter-colonial slave trade by way of the West Indies might provide one half of the explanation. But we can be practically sure that also the genetic contributions of the Windward Coast and Sierra Leone are having their impact in so-called “Ivory Coast/Ghana” scores for African Americans. Especially for those with strong South Carolina connections. I will explore this in greater detail in the next paragraph.
Relative %’s slave trade from Sierra Leone, Liberia, Ivory Coast & Ghana
Chart 5.4 (click to enlarge)

Source: TAST Database (2018). Follow this link for underlying numbers.
***
Map 5.3 (click to enlarge)

Source: TAST Database. Follow this link for underlying numbers.
***
Seeking a proper context is always essential when trying to interpret your own personal “Ivory Coast/Ghana” test results. Not only your unique family history will matter in this regard but also your nationality or even your provincial/state origins within your home country. Especially your earliest known ancestral locations in the Americas might be very indicative as discussed above. In order to provide more solid ground when seeking to determine the plausibility of various ancestral scenarios I have performed a customized search in the Trans Atlantic Slave Trade (TAST) Database.7
Chart 5.4 features the relative shares of slave trade originating with the regions of “Sierra Leone” (also includes Guinea!), “Windward Coast” (includes both Liberia & Ivory Coast) and “Gold Coast” (Ghana). Take note that it adds up to 100% along the row! In order to focus solely on the slave trade within this area I have left out all other slave trade regions from the equation. Map 5.3 is also based on TAST Database with its estimates of 388,747 captives being disembarked in North America. Very useful because it is providing more detail beyond the traditional slave trade regions. Take note for example how the so-called “Sierra Leone” slave trade region is now split up between the modernday countries of Guinea & Sierra Leone (based on embarkation port details, see this overview). The same goes for the Windward Coast information which is now split up between Liberia and Ivory Coast. Even when similar to the AncestryDNA regions these modernday country origins are not to be taken too literally 😉 Inland slave trade routes could very well cross borders after all.
As can be seen in chart 5.4 the relative importance of either Sierra Leone (incl. Guinea), Windward Coast (Liberia & Ivory Coast) or Gold Coast (Ghana) varies a lot for each particular destination within the Americas. However it seems that for most destinations in the Americas slave trade by way of the Gold Coast was prevalent. Therefore so-called “Ivory Coast/Ghana” amounts reported for Afro-descendants from those places are likely then to be firstmost referring to Ghanaian ancestry. Even when my survey findings are demonstrating that Ghanaian DNA is not exclusively described by “Ivory Coast/Ghana”. But also by “Benin/Togo” and to a lesser degree “Mali” as well.
Generally speaking these proportional shares (again they add up to 100% and exclude slave trade from other regions!) do make a lot of sense, given not only known slave trade patterns but also cultural retention. For example the primary share of 64,7% “Sierra Leone” for Cuba would be correlating with the frequently mentioned so-called Ganga or Canga presence, a slave ethnonym for captives brought in from Sierra Leone and northern Liberia. See also:
- Cubans trace roots to remote Sierra Leone village (BBC, 2014)
- Documented ethnic origins of Liberated Africans in Cuba (compare “Ganga” with “Mina”, also take note of all of the subgroups!)
The Windward Coast has its highest relative share for the Dutch Guianas (Surinam and Guyana). It is very likely to be an underestimate even as I left out slave voyages which covered several embarkation regions at the same time (“Other Africa”). This outcome is in line with recent research revealing the great significance of not only Liberia but also Ivory Coast as a potential ancestral location for Afro-descendants in these formerly Dutch colonies. Quite unique when compared with the rest of the Afro-Diaspora! See also:
The proportional share of the Gold Coast is perhaps surprisingly peaking for Pernambuco in Brazil, with no less than 100%. But basically this just says that documented slave trade from either Sierra Leone or Windward Coast was nonexistent. This is to be explained by again Dutch slave trade patterns from their Elmina headquarters in Ghana during its brief occupation of Northeast Brazil (1630-1654). In absolute numbers and compared to other embarkation regions this Gold Coast share is quite minor for Pernambuco even when still noticeably higher than for other Brazilian regions (see this overview). Otherwise it’s Jamaica and Barbados with the highest Gold Coast proportional shares. This is pretty much as expected as it conforms with the oft mentioned Ghana connection for the Anglo-Caribbean. Nonetheless the minor shares of Windward and Sierra Leone may still be conflated also in the “Ivory Coast/Ghana” scores for Barbadians, Jamaicans etc. See also:
Focusing only on the USA data again a varied picture is showing up. Which can be quite useful when interpreted correctly. The likelyhood of genuine Ivory Coast origins seems minuscule for African Americans. Taking a cue from map 5.3 the ranking for the USA as a whole would be as follows (take note this time the proportional shares are reflecting the entire slave trade from Africa):
- Ghana: 14.46% (56,200)
- Sierra Leone: 7.1% (27,600) (Guinea is mentioned separately with 4.45% / 17,300)
- Liberia: 5.56% (21,600)
- Ivory Coast: 0.05% (200)
However otherwise it’s quite apparent that the so-called “Ivory Coast/Ghana” region as reported for African Americans is due to not only Ghanaian ancesty but also Liberian origins and probably to a lesser degree also (southern) Sierra Leonean ancestry. Reviewing chart 5.4 again it seems that especially South Carolina might have an increased probability for non-Ghanaian lineage being behind so-called “Ivory Coast/Ghana” amounts. Its Gold Coast share being one of the lowest (36.6%), while its Sierra Leone share is one of the highest (41.6%). But also for Virginia in fact the shares for Windward Coast and Sierra Leone are quite pronounced when compared with other parts of the Afro-Diaspora. Combined they are nearly equal to the Gold Coast share of 56.3%.
As always there are several reservations to keep in mind though. First of all the Sierra Leone data could also be reflecting origins from northern Sierra Leone (Temne, Sherbro etc.) as well as Guinea (chart 5.4). I have not yet seen many AncestryDNA results from Atlantic-Mel speaking Sierra Leoneans but I suspect that unlike the Mende from southern Sierra Leone they will be primarily described in terms of “Senegal” and “Mali” rather than “Ivory Coast/Ghana”. Furthermore there is also the influence of inter-colonial slave trade by way of the West Indies which is likely to have been more so in favour of the Gold Coast. Another aspect to take into consideration is the time period these captives arrived. Those transplanted West Indian captives as well as early arrivals (1650-1750) in Virginia (where Gold Coast trumps Windward Coast & Sierra Leone) might very well have had a head start of several generations in producing offspring when compared with relatively late arrivals (1750-1850) in South Carolina. Many of their descendants eventually getting scattered across the Deep South due to Domestic Slave Trade. See also:
- Estimated slave trade from Sierra Leone, Liberia Ghana into the USA in numbers (TAST Database)
- Estimated slave trade from Sierra Leone, Liberia Ghana into the USA according to timeperiod (TAST Database)
Personally I have a hunch that the breakdown for Virginia (even though less in numbers) might be more representative for the average African American than the South Carolina breakdown. But all in all I suspect that there’s not a dramatic difference between the likelihood of “Ivory/Coast/Ghana” denoting either Liberian or Sierra Leonean origins rather than Ghanaian ones for African Americans. I’m guessing the odds pretty much even out. The best way to get more certainty is finding any locally born matches from these countries. Even when actually they will (usually) only represent one single family line, which might imply a DNA contribution of about 1% on average.
Interestingly I have had the opportunity to look through the DNA matches of several Liberians already. And I was amazed by the number of not only African American matches but also matches across the Caribbean and Hispanic Americas. The total number of these matches are actually quite comparable to the DNA matches I have seen reported for Ghanaians. I intend to blog about this in greater detail in the near future. Of course when receiving a Sierra Leonean or Liberian match you will still have to be very careful and check whether they do not have any partial Krio or Americo-Liberian ancestry. Because in that case the ancestral connection might actually be reversed! And your MRCA could even be African American! Both Liberia and Sierra Leone having received freed ex-slaves from the US and the West Indies as settlers. See also:
Just as a final reminder it should be kept in mind that the actual amounts being reported for the so-called “Ivory Coast/Ghana” regional components are first-most a measurement of the genetic similarity to most likely Akan (Brong) samples from Ghana and possibly in addition Kru samples as well as perhaps south Mandé samples from Ivory Coast. However it will by default only be a rough estimate as more fitting sample groups to compare with may very well be missing within Ancestry’s current Reference Panel.
Follow-up research to make more sense of these rough estimates is therefore required. Even when in itself AncestryDNA’s regional breakdown is already quite insightful and also in line with what you might expect given West African genetics and the documented origins of the Afro-Diaspora based on slave trade records. Still one is left to wonder how might an updated and expanded configuration of Ancestry’s reference panel lead to improvement? Firstly a careful selection of relevant reference populations to be added would seem prudent. Especially the inclusion of Gur samples from Burkina Faso might result in sharper regional delineation. Furthermore I suppose replacing the current “Ivory Coast/Ghana” region with three separate and properly labeled regions to describe and measure genetic affiliations with either Kru, Akan or southern Mandé samples could also be beneficial.
How to make more sense of “Benin/Togo” scores
Map 5.4 (click to enlarge)
Source: http://www.ancestry.com
***
Performing follow-up research based on your AncestryDNA score for the so-called “Benin/Togo” region might very well enhance your understanding of the actual ancestors who passed on this part of your DNA. In some cases it might even help you pinpoint specific ethnic lineage! However as always it pays to be careful and not jump to conclusions. Below I will just describe a schematic approach. Intended in the first place for people with substantial amounts of “Benin/Togo”.4 Naturally other approaches can be fruitful as well.
Some considerations
- Realize that any so-called “Benin/Togo” % can also be indicative of either Ghanaian or Nigerian DNA (among other less likely possibilities which I will exclude for now because of decreased odds and/or lack of data).
- Realize that your “Benin/Togo” amount is likely to be traced back to numerous family lines and not just one (unless you happen to have relatively recent West African ancestry). Just as an example: a 25% score “Benin/Togo” for a typical Haitian might be due to the genetic contributions of in between 15 to 50 different African-born ancestors. On average the DNA contribution of an ancestor living in the mid 1700’s could be around 0.5%-1.5%. See also:
- Realize that therefore your “Benin/Togo” score could include ancestors from various countries, all at the same time. For example a 25% score “Benin/Togo” for a typical Barbadian might possibly be traced back to 10 ancestors from Benin, 8 ancestors from Ghana and 7 ancestors from Nigeria. Just to name one possible combination out of many others depending on your individual family history.
Action plan:
- Build up your family tree and attempt to trace back to your earliest known ancestral location in the Americas for all lines. The so-called “migrations” (a.k.a. genetic communities) you have been assigned to by AncestryDNA will usually be quite indicative in this regard! For example for African Americans it might be truly worthwhile to know if most of their ancestry is to be traced back to either Virginia or South Carolina. For people from Louisiana any distant Haitian ancestry could be relevant.8 For West Indians it will be useful to know if there has been any inter-island migration within their family tree.
- Research the documented slave trade patterns for these earliest known ancestral locations. This will give you an approximate idea of the odds involved with having for example either genuine Beninese origins or rather Ghanaian or Nigerian ancestry. It’s advisable to also study all other relevant aspects of local history (incl. possibly African retention) associated with these earliest known ancestral locations in the Americas. See also:
- Trans Atlantic Slave Trade Database
- Discussion in next section
- Perform a full scan of your DNA matches and filter them for 100% African profiles. Determine if there are any matches among them from Nigeria, Benin, Togo or Ghana. Be sure to also check if “Benin/Togo” is being reported for them as a main region.9 Provided they are genuine IBD matches this could directly inform you if you happen to have any genuine lineage from Benin or Togo as opposed to rather having either Ghanaian or Nigerian ancestors which passed on this “Benin/Togo” part of your DNA. However many reservations are to be taken into consideration! Firstly your MRCA might not be of the same background as your match. Also be aware that these matches will give you an indication of only one single family line. Furthermore realize that certain West African nationalities (Ivory Coast, Burkina Faso, Benin, Togo) are underrepresented among Ancestry’s customer database, while others might be fairly well represented (Liberia, Ghana, Nigeria). Stacking the odds in favour of receiving matches from those last countries. Which however may not per se be in line with their overall proportional contribution to your DNA Moreover absence of evidence is not evidence of absence!
- How to find those elusive African DNA matches on Ancestry (Tracing African Roots)
- Try fitting your West African matches into your family tree. This will be very tricky given scanty information and will also require a lot of patience. But it might still be worthwhile for eventually zooming in closer to your West African origins along a certain family line or even actually identifying a West African ancestor! Breaking down those brick walls based on paper trails! Having other close relatives also DNA tested will of course be greatly helpful. Especially if they share the same West African matches with you. However any shared matches for your West African match might do the trick I suppose. As long as you can figure out how these shared matches are to be placed in your family tree. More advanced techniques such as triangulation and DNA painting might also open up promising avenues.
- Benefits of Triangulation (Segmentology)
- Using DNA Painter to reconstruct ancestral DNA (Ultimate Family Historians)
“Benin/Togo” across West Africa & the Diaspora (sorted)
Chart 5.5 (click to enlarge)

***
Chart 5.6 (click to enlarge)

Source: TAST Database (2018). Follow this link for underlying numbers.
***
Chart 5.5 is displaying the findings of my survey of both Afro-Diasporan as well as West African AncestryDNA results as of February 2018 (see this page for a complete and up-to-date overview). Even though due to limited sample size this data is preliminary it is still also cross-sectional because it was collected at random from various parts of the Diaspora and also within West Africa. Overall contributing to the robustness of the data. Chart 5.6 is taken from the Trans Atlantic Slave Trade Database and features the proportional shares of each slave trade region for selected parts of the Diaspora.7 The share of Bight of Benin (a.k.a. Slave Coast) is being highlighted. This would be the coastline of modern-day Togo, Benin and western Nigeria. See also this map.
We can establish that among West Africans the so-called “Benin/Togo” region is most prevalent among Beninese, followed by Nigerians and Ghanaians. Also take note that as expected among other West Africans it is most subdued for Ivorians and practically non-existent for Liberians. Given the discussion in the previous sections this outcome can be considered as roughly corroborating the prediction accuracy of the “Benin/Togo” region among West Africans themselves. Even when obviously the sample size for Benin itself is very minimal and also samples from Togo & Burkina Faso are not yet included in my survey.
In regards to the Afro-Diaspora we can observe how “Benin/Togo” is peaking for Barbadians & Haitians while it is most subdued for Cape Verdeans and Mexicans (whose overwhelmingly predominant areas of provenance are Upper Guinea and Central Africa). This conforms more or less with what we know already about slave trade patterns (see chart 5.6). Going by proportion and sheer numbers of slave trade with the Bight of Benin as well as cultural retention (Vodou!) the primary ranking of Haiti (Saint Domingue) is not surprising at all. Actually going by these criteria Brazilians from Bahia might be expected to have an even greater “Benin/Togo” imprint. However as clearly illustrated by the minimal share of Bight of Benin in the slave trade with southeast Brazil (1.4%) this is not something to be generalized for the whole of Brazil. Which seems to reflect also in the more so intermediate group average of 12% “Benin/Togo” for my Brazilian sample group.
Perhaps in contradiction to general knowledge but the Bight of Benin was actually also a very significant trading area for African captives who ended up in English as well as Dutch colonies within the West Indies. In particular Barbados incorporated a relatively large segment of people shipped from the Bight of Benin (18.8%). It seems that also genetically this Bight of Benin connection has left a profound legacy. Even when most likely also Ghanaian & (southeast) Nigerian origins are to be included in that very impressive group average of 31.7% “Benin/Togo”. Furthermore my Barbadian sample size (n=15) is still quite limited so this preliminary group average might actually also decrease with the future addition of more Barbadian AncestryDNA results into my survey. For more in depth discussion see next paragraph.
The “Benin/Togo” group averages for Hispanic Caribbeans are somewhat intermediate but also hiding a great deal of underlying variation. They may yet provide extra insight as I suspect that for Hispanic Caribbeans with a relatively larger total amount of African DNA (>50%) also an increased relative share of “Benin/Togo” will be observed, on average. Especially for Dominicans. In line with perhaps more recent African origins (1700’s/1800’s versus 1500’s/1600’s). I will devote a separate blog post to this topic eventually.
The so-called “Benin/Togo” scores reported for African Americans are more complex to disentangle. For now I will already note that based on charts 5.5 & 5.6 the estimated slave trade from the Bight of Benin (2%-3%) into the US is remarkably lower than the African American group average for “Benin/Togo” (14.7%). This is actually true for several other nationalities in my survey as well. But for none is the difference so striking! One might already deduct that the odds of “genuine” Beninese origins are lowest for African Americans and highest for Brazilians & Haitians. Based on a comparison of proportional shares in slave trade from either the Gold Coast (mostly Akan speakers? but also Volta-Niger speakers such as the Ewe), Bight of Benin (mostly Volta-Niger speakers, such as the Fon but also Yoruba) and Bight of Biafra (mostly Volta-Niger speakers, such as the Igbo). This comparison is heavily skewed toward the Bight of Benin for both Haiti and Brazil. But clearly not so for the USA. Its proportional share for Benin proper (2.26%, see map 5.3) probably being one of the lowest across the entire Afro-Diaspora!
How to account for unexpectedly high “Benin/Togo” scores among African Americans & Anglo-Caribbeans?
Chart 5.7 (click to enlarge)
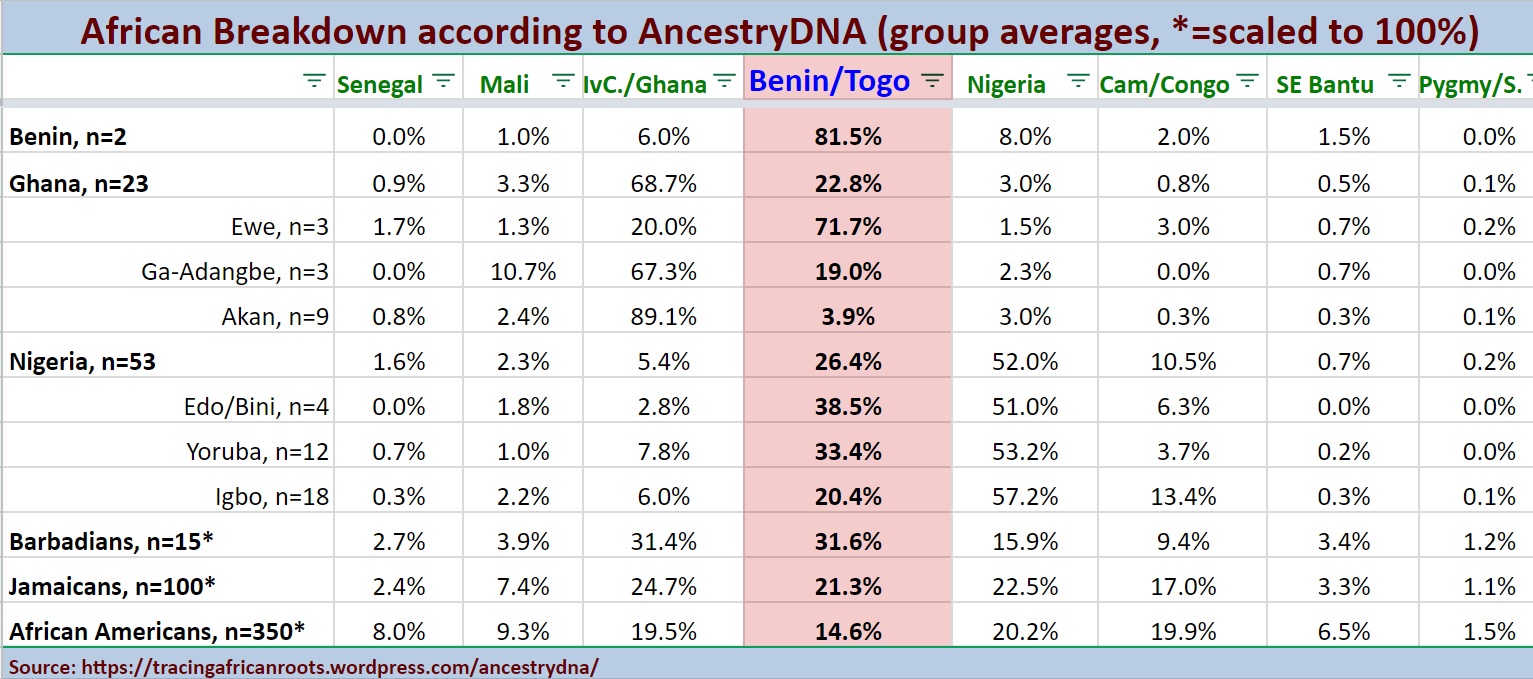
***
(click to enlarge)

Maximum “Benin/Togo” scores among some of my West African survey participants.
***
One of the most surprising outcomes of my ongoing survey of AncestryDNA results across the Afro-Diaspora has been the higher than expected average scores for “Benin/Togo” seen for African Americans and to a lesser degree also for Anglo-Caribbeans such as Jamaicans and Barbadians.10 It is surprising because even given individual variation and many possibilities of “real” Beninese ancestry to some (minor) degree, documented Trans Atlantic slave trade data does not seem to support such a consistently high average level of “Benin/Togo”, especially not for the USA.
It’s intriguing to think about what might possibly be causing this outcome. I will attempt to take this discussion one step further based on additional context. The following four scenario’s I will describe may provide partial explanations for the unexpectedly high “Benin/Togo” percentages being reported but as a fair warning in advance they are also to some degree speculative!
- Larger than assumed proportion of Ewe captives involved in Gold Coast slave trade
- Mislabeling of southern Nigerian DNA
- Early arrival of Bight of Benin captives & dispersal due to inter-colonial slave trade
- Illegal slave trading with Bight of Benin after 1807/1808
1) Large proportion of Ewe captives involved in Gold Coast slave trade?
____________________
“The lack of historical attention to Ga, Adangbe, Ewe, and—to a lesser extent—Fante speakers in the central coast has a lot to do with the historical “weight” associated with centralized and expansionist kingdoms in Atlantic Africa—particularly Asante, Dahomey, Benin, and Kongo.”
“Those who lived in decentralized societies and small polities constituted a majority of the people in the Gold Coast and throughout Atlantic Africa and, by the fact of their relative powerlessness vis-à-vis centralized kingdoms, they were overrepresented among the enslaved, the (dis)embarked, and the dispersed. It is for this very reason that their collective stories form an important aspect of the Gold Coast diaspora.” (Gold Coast Diasporas: Identity, Culture, and Power, W. Rucker, 2015, p.27)
____________________
One of the key findings of my West African survey has been that the actual ethnic background of a West African might be a better predictor of his or her breakdown on AncestryDNA rather than their nationality. We can clearly see this in chart 5.7 where I have specified some subgroups along ethnic lines for my Ghanaian and Nigerian survey participants. Of course allowance to be made for my minimal sample size (as of February 2018) and possible simplification of more complex ethnic backgrounds. It is still very useful to be aware that my Ewe samples from Ghana show the highest “Benin/Togo” group averages (aside from 2 actual Beninese persons). While also for various southern Nigerian ethnic groups “Benin/Togo” is a significant genetic component. Any African American or West Indian descendant of either eastern Ghanaians (in particular the Ewe and perhaps also Ga-Adangbe) or southern Nigerians is therefore likely to have inherited part of their so-called “Benin/Togo” score through them.
The genetic impact of non-Akan Ghanaians (such as the Ewe but also Gur speakers from the north) on the Afro-Diaspora may have been seriously underestimated up till now. Their historical presence in the Americas often being either neglected or ignored. In part due to an overemphasis on the Akan and their prestigious associations with the Ashanti empire. To be sure the so-called Coromantee influence has indeed been profound in especially the Anglo-Caribbean. However it is perhaps sometimes forgotten how cultural assimilation of less influential ethnic groups from Ghana into the Akan/Coromantee mold may also have been rampant. It is useful to know that despite being a majority the Akan make up less than 50% of the current-day population of Ghana (see this link). While the actual share of Akan people among Gold Coast captives is yet to be determined, but this could actually also have been less than 50% (see quote above).
Due to their geographical location Ewe and Ga-Adangbe captives in the Americas might have been conflated with either the Akan or also with fellow Gbe speakers from Togo/Benin. The latter were often labeled as “Papa” or “Popo” at least in English or Dutch colonies. There exists another related slave ethnonym, “Mina”, which could also be very relevant in this regard. The correct interpretation of this term has been contested among historians. Both Akan and Gbe being suggested as the main intended group of people for this “Mina” designation. Naturally this will often be context-dependent as this term was used not only in French but also Portuguese and Spanish colonies. However my AncestryDNA survey findings might put a new twist on it.
- African Ethnicities and the Meanings of ‘Mina,’ (Gwendolyn Midlo Hall, 2003)
- Ethnicities of Enslaved Africans in the Diaspora: On the Meanings of “Mina” (Again) (Robin Law, 2005)
- Documented ethnic origins of Liberated Africans in Cuba (take note of the listed subgroups of the nacion “Mina”, as well as actual embarkation ports!)
Despite being shipped away from the so-called “Gold Coast” (and also counted as such in the Trans Atlantic Slave Trade database) a higher than expected number of these captives might actually originally have been from the borderlands with Togo (so-called Volta region). Or also in fact from Togo or even Benin itself! Only ending up in the European slave ports along the Gold Coast instead of the Bight of Benin because of coastal shipping or overland routes. All of which is to say that the proportion of Gbe (incl. Ewe) & Ga-Adangbe speaking people among Gold Coast captives might have been larger than hitherto imagined.
Obviously much more research is needed to establish firmer ground. However my preliminary AncestryDNA survey findings might already be indicative of some of the main trends. Going by the preliminary group averages depicted in chart 5.7 it’s least likely that any “Benin/Togo” amount being reported for an African American or Anglo-Caribbean would have been inherited by way of an Akan ancestor (3.9%). As actually the “Ivory Coast/Ghana” region is a quite accurate predictor of Akan lineage (but not exclusively so!). For my Ga-Adangbe samples it’s a rather mixed picture (19% but mostly due to 1 perhaps atypical sample). But the occurrence of predominant “Benin/Togo” amounts (71%) among my Ewe samples seems to be a quite consistent and telling outcome already.
Recombination of genetic components across the generations can be quirky though and there may also be other complexities to consider so all of this is just to sketch 1 plausible yet still inconclusive ancestral scenario. To be applied on African Americans and West Indians as a whole. You will need to have further corroborating evidence to confirm in individual cases! A promising avenue of follow-up research might be to systematically investigate and compare the number of DNA matches among the Afro-Diaspora as reported for Ghanaians of either Akan or Ewe lineage. See also:
- Documented ethnic origins for Jamaicans and other Anglo-Caribbeans
- Ewe people and their part in the Gold Coast Diasporas: Identity, Culture, and Power (Walter C. Rucker, 2015)
- DNA matches reported on AncestryDNA for Ghanaians of Akan & Ewe descent (under preparation)
2) Mislabeling of southern Nigerian DNA
Aside from indicating (eastern) Ghanaian lineage so-called “Benin/Togo” might also very well be derived from southern Nigerian ancestors. As can be seen in chart 5.7 my Nigerian survey participants score in between 20-30% for “Benin/Togo”. However in individual cases it can get as high as 40% or even 50%, as shown in the screenshots below chart 5.7. That compilation picture is featuring the maximum scores for some of my sample groups (see this link for maximum scores among the Afro-Diaspora). This “Benin/Togo” reporting is quite consistent across the board for southern Nigerians. It is not at all exclusive to the Yoruba but also to be observed for the Edo and Igbo! And while not shown in chart 5.7 actually also for persons of Efik, Urhobo or Isekiri descent (see my Nigerian survey). So any of these southern Nigerian ethnic groups is likely to have passed on so-called “Benin/Togo” DNA markers into the genepool of African Americans & Anglo-Carribeans.
In section 3 and also on this page I have already discussed why the genetic origins of actual Nigerians are not fully covered by just only the region “Nigeria”. Additional regions are needed to describe their DNA, in particular “Benin/Togo” but also “Cameroon/Congo”. Similarly also for African Americans & Anglo-Caribbeans the “Nigeria” region may not be reporting the full extent of someone’s Nigerian origins. But rather it may tend to underestimate them, generally speaking. And the reported “Benin/Togo” amounts for African Americans & Anglo-Caribbeans might in part actually also have been inherited by way of Nigerian ancestors who already carried these DNA markers in their own genome.
Obviously putting an exact number on this additional Nigerian genetic contribution by way of “Benin/Togo” is impossible to make right now. However just taking a wild swing at the available data I wouldn’t be surprised if it turns out that about 5% of the 14.7% “Benin/Togo” average score for African Americans is actually hailing from southern Nigeria. While another 5% could actually be from eastern Ghana. The remaining 4.7% “Benin/Togo” then being much more in line with what you would expect based on the slave trade records. Both Ghana (14.46%) and Nigeria (16.34%) being much more likely to host source populations for African Americans than Benin (2.26%, see map 5.3).
For Anglo-Caribbeans it’s more complex because they do tend to have a substantial documented connection with the Bight of Benin. And therefore for them “Benin/Togo” has an increased likelihood of being the “real thing’! Just to get an approximate idea we might apply a very rough formula derived from the average Nigerian breakdown in my survey (see chart 5.7). Whereby 52% “Nigeria” is combined with 26.4% “Benin/Togo”. Put in another way a ratio of 1% “Nigeria” / 0,5% “Benin/Togo”. Based on my very preliminary data for Barbados this would imply that 8% (1/2 * 16% “Nigeria”) is to be deducted from the 31.7% “Benin/Togo” group average, which leaves a still hefty average amount of 23.7%! For Jamaica we would arrive at a corrected “Benin/Togo” average of about 10% (21.4% – 1/2 * 22% “Nigeria”). Any possible Ewe connection still included though! Of course this is a mere speculative exercise at this stage which needs more fine-tuning and increased sample size. It is certainly not intended to be applied for individual cases 😉 Only an update by AncestryDNA might clarify this issue, improving their reference panel with additional West African populations. For more details and references see:
3) Early arrival of Bight of Benin captives & dispersal due to inter-colonial slave trade
Chart 5.8 (click to enlarge)

Source: The Atlantic Slave Trade: A Census, (P.D. Curtin, 1969, p.150)
***
Chart 5.9 (click to enlarge)

Source: Gregory E. O’Malley, “Beyond the Middle Passage : Slave Migration from the Caribbean to North America, 1619-1807”, The William and Mary Quarterly, 66, (1), 2009.
____________________
“Assuming that the inter-colonial trade from the British Caribbean to South Carolina reflected the ethnic composition of the transatlantic migration to the British Caribbean, this inter-colonial trade must have diversified the enslaved population in South Carolina considerably. For captives from the Bight of Benin, in particular (mostly Aja in this period), transshipment to South Carolina was no doubt profoundly alienating. They composed more than a quarter of the slave trade to the British Caribbean, but no known voyages linked their home region and South Carolina directly.” (Final Passages: The Intercolonial Slave Trade of British America, 1619-1807, G. O’Malley, 2014, p.185)
____________________
As discussed above both eastern Ghanaian and southern Nigerian origins for any “Benin/Togo” reporting among Anglo Caribbeans and African Americans are certainly not to be ruled out. But it seems undeniable already that many of such scores will also include a significant and genuine ancestral tie with people from current day Benin & Togo. Most apparently for Barbados but also for Jamaica which has a “Benin/Togo” group average that is only just falling behind the one for Haiti (21.4% vs 23%, see chart 5.5). This rather pronounced impact is possibly to be explained by the relatively early arrival of the contingent of Bight of Benin captives in the Anglo Caribbean. Combined with dispersal into North America through inter-colonial slave trade this may have set off a demographic founder effect in both the West Indies as well as the USA.
English slave trade patterns show a great deal of fluctuation across time and also in regards to destination within the Americas. Generally speaking, as shown in chart 5.8, up to 1730 the Bight of Benin seems to have played a significant role but afterwards its share in English slave trade decreased sharply. Given that most of English slave trade was geared towards the West Indies rather than North America this would be especially relevant for Barbados and Jamaica. The more specific and up-to-date slave voyage data for Barbados confirm that especially during the late 1600’s and early 1700’s there was indeed a major inflow of captives from Benin arriving in the West Indies. And possibly by way of inter-colonial slave trade these captives were also partially brought over first to Jamaica when its plantation economy was being set up in the late 1600’s as well as to the USA.
According to recent research (see chart 5.9) this inter-colonial slave trade via the West Indies would amount to about 15% of overall slave importations for the USA (domestic and overland slave trade from within the US is however not included!). Inter-colonial trade was more pronounced for some states than others. Apparently being continued even when trans-atlantic slave trade was also in full force throughout the 1700’s. But proportionally speaking this inter-colonial slave trade from the West Indies might have made the biggest impact right from the start in the late 1600’s and early 1700’s. These decades marked the crucial beginning of the formation of African Americans as well as Jamaicans and Barbadians as new populations through the blending of ethnic lineages from various parts of Africa. An exact reconstruction of this process might never be possible. But increasingly both historical and now also genetic evidence seems to be forthcoming that people from the Bight of Benin may have been more prominent in all of this than imagined.
Despite the prevailing brutal living conditions in the Caribbean – causing negative reproduction rates in general – it might possibly be that cumulative founder effects were set in motion by those people who did manage to survive the ordeal and passed on their genes to the first generations of locally born slaves in the Caribbean as well as to some degree in the USA. So it would seem in this case the inherited “Benin/Togo” markers could be signaling genuine Beninese ancestry, especially from the Aja, Fon and other Gbe speaking groups who would have had a relatively larger presence during these earlier time-periods. This may be especially true for Barbados because unlike most other parts of the West Indies (but similar to the US!) it had a naturally reproducing slave population already in the late 1700’s which put an end to the need of continued mass slave imports. See also:
- Proportion of African-born vs. Creole in West Indian slave populations (Higman, 1984)
- Early testimony (1680’s!) of cultural retention in Jamaica from Benin (“Papa” music) (R. Rath, 1993)
- The North American Periphery of the Caribbean Slave Trade, ca. 1700–1763 (Gregory E. O‘Malley, 2014)
4) Illegal slave trading with Bight of Benin after 1807/1808
____________________
“In the Bight of Benin, traffic peaked in the first half of the eighteenth century. It was nevertheless the part of West Africa where the slave trade persisted longest. Almost all the captives leaving the region after 1830 passed through Lagos and Whydah, with the latter port remaining active into the mid-1860s.” (Abolition of the Slave Trade, 2012)
“the fate of the Clotilda has stood out as an intriguing chapter in the history of slavery in the United States. It’s even more important in Alabama, where the slaves brought from what is now Benin, in Africa, aboard the Clotilda settled in Mobile Alabama after emancipation, in an area that became known as “Africatown.” (Is This the Wreck of the Last U.S. Slave Ship?, S. Pruitt, 2018)
“Over the 25 years between 1842 and 1867, 14,060 of these ‘liberated Africans’ were moved to British Guiana, 11,391 to Jamaica and 8,854 to Trinidad, as were 5,027 to the Windward Islands and St Kitts.” (General History of the Caribbean: The long nineteenth century : nineteenth century transformation, ed. K.O. Laurence, 2011, p.197)
____________________
We have already established that English as well as American slave trade with the Bight of Benin would have been relatively minor or even insignificant after the 1730’s (see chart 5.8). However illegal slave trade taking place after 1807/1808 may have again depended on the the Bight of Benin to a greater degree (e.g. the Clotilde voyage in 1859!). The extent of these illegal slave trading activities for the USA and in particular its demographic impact is usually assumed to be rather restricted though. Given the very low reported rate of African born slaves in the USA throughout the 1800’s and the documented early creolization of American slaves in general this option therefore seems least likely to offer an overall explanation for the high averages of reported “Benin/Togo”. Although in selected individual cases it could very well be. Especially for the Gulf states as well as the coastal area of South Carolina & Georgia there might be increased odds. It might be useful to know that African born slaves at that time were often referred to as “Guinea man” or “Guinea woman” (“Guinea” being a standard term to refer to coastal West Africa in a general way, see this link). I have come across such terms a few times already in slave narratives written down in the early 1900’s. Implying they were uncommon but not totally unheard of yet. Dedicated family tree research might be very rewarding then as documentation might still exist even.
For the Anglo-Caribbean a related ancestral option arises from the fact that during the 1800’s thousands of so-called recaptives or also Liberated Africans were being settled and employed as contract labourers in the West Indies. Many of these Liberated Africans were recruited among ex-captives who were originally shipped from the Bight of Benin. It is often said that aside from Congo’s (a blanket term for Central Africans) also Yoruba’s (a.k.a. Nago) were predominant among them. In line with the main areas of illegal slave trade for Brazil & Cuba in that time period. After having been intercepted these Liberated Africans were being introduced by the English into their colonies with the greatest demand of labour due to still expanding sugar plantations. This was mostly the case for Guyana and Trinidad but also Jamaica may have received close to 12,000 of these recaptives.
Judging from the data I have seen it seems that Barbados was not among the main recipients and so this scenario could be least plausible or even irrelevant for Barbadians. Actually also for Jamaicans the odds of having Liberated African lineage which connects into any substantial “Benin/Togo” score might be deemed restricted. Going by rough estimates it would seem that the number of Bight of Benin contract labourers was not that high to make a major impact on the Jamaican gene-pool (at most 5,000? within a total Jamaican population of in between 375,000-500,000 between 1840-1870, see this link). Most of them being concentrated in two parishes. Still due to their amazing retention of Yoruba customs I imagine it must not be that difficult to trace back such lineage and possibly correlate with any “Benin/Togo” (and also “Nigeria”) amounts. Further reading:
- Dreams of Africa in Alabama: The Slave Ship Clotilda and the Story of the Last Africans Brought to America (Sylviane A. Diouf, 2007)
- The Illegal Slave Trade to the United States, 1808-1860 (In Motion: The African-American Migration Experience, 2005)
- The end of the British Atlantic slave trade or the beginning of the big slave robbery, 1808-1850 (Christian Cwik, 2014)
- Etu & Nago: The Yoruba Connection (House of Oosaala Productions, 2004)
The four possible ancestral scenario’s I have described above all have varying degrees of plausibility & probability. Each one of them or also any given combination might apply in individual cases. Each case to be judged on its own merits naturally and depending also on any possible additional clues. In order to at least fit in some of the pieces of the “Benin/Togo” puzzle follow-up research is simply a must! As I have argued above aside from African DNA matches also a close study of the slave trade patterns and just any relevant piece of local history for your earliest known ancestral location in the Americas might go a long way. Even when clear-cut results will not be guaranteed.
As a final reminder I like to stress yet again that so-called “Benin/Togo” is not an exclusive marker for any given ethnic group nor nationality. Any amount scored for this region can be suggestive of many different ethnic origins from eastern Ghana into southern Nigeria, while possibly also some ethnic groups further west such as the Gur speaking people in Burkina Faso and northern Ivory Coast might score substantial amounts for this region as well. All of this aside from possibly pinpointing genuine origins from within either Benin or Togo. Right now there’s just no way of making the distinction. Perhaps with an upcoming update there will be more clarity. But even so a perfect measure of “genuine” Beninese ancestry might never truly be possible due to artificial manmade borders and a high degree of genetic similarity between neighbouring ethnic groups, especially those belonging to the Volta-Niger language group (Gbe, Ewe, Fon, Aja, Yoruba, Edo, Igbo etc.). In the end all of these ancestral regions are afterall constructs much like the very concept of “ethnicity” itself.
Actual amounts being reported for the so-called “Benin/Togo” region are first most a measurement of genetic similarity to most likely Gbe speaking samples from Benin and Togo. Nothing more but also nothing less! Because in themselves AncestryDNA’s estimates are already quite insightful and also roughly in line with what you might expect given West African genetics and the documented origins of the Afro-Diaspora based on slave trade records. Still one is left to wonder how might an updated and expanded configuration of Ancestry’s reference panel lead to improvement? Firstly a careful selection of relevant reference populations to be added would seem prudent. Especially the inclusion of Gur samples from Burkina Faso might result in sharper regional delineation. The creation of a less confusingly labeled region to describe and measure genetic affiliations with Gbe samples from not only Benin and Togo but also eastern Ghana would also be beneficial. And in order to decrease the inevitable overlap with fellow Volta-Niger speaking southern Nigerians perhaps it might be a good idea to for once dispense with the ubiquitous Yoruba samples and only rely on more genetically distinctive Igbo samples for the “Nigeria” region and perhaps also add in Middle Belt Nigerian samples?
_______________________________________________________________________
Notes
1. I am aware that ethnicity can be a sensitive topic for West Africans. Aside from wanting to learn more about my own West African roots my motivation to research these so-called Ethnicity Estimates is purely scholarly. It stems from a deep fascination with West Africa’s ancient population migrations, its many connections with the Afro-Diaspora as well as a profound love for its vibrant & diverse culture. I do not condone the misuse of my research for identity politics! I am in full support of democratizing knowledge. However when parts of my work are being copied I do expect that a proper referral to my blog and the additional context it provides will be made.
2. I like to express my sincere gratitude to all the persons whose online posting of their results has made this survey possible! Most results on this page have been shared with me directly by invitation. But some were also collected by me from public websites or social media. As I found them to be of potentially great educational benefit for others. I have asked for prior consent whenever I could but regrettably wasn’t able to do so in all cases. I have naturally taken great care to cut away any name details in order to safeguard everyone’s privacy. Apologies in advance to anyone who recognizes their results and is not comfortable with this blog page featuring them. Please send me a PM and I will remove them right away.
3. Currently you are much more likely to get a realistic estimate of your West African lineage on 23andme. Even if of course not 100% accurate 😉 Still going by actual West African 23andme results the predictive accuracy of their 3 new West African regions (“Senegambian & Guinean”, “Ghanainan, Liberian and Sierra Leonean” and “Nigerian”) is quite impressive. To be fair Ancestry’s African breakdown during 2013-2018 was far better in my opinion than 23andme’s African breakdown during that same period (before their update in 2019). Unlike any of its commercial competitors AncestryDNA was able to distinguish no less than 5 different West African regions. In addition it also did a reasonable job at separating West African DNA from Central/Southern African DNA (“Cameroon/Congo” and “Southeastern Bantu”). Which is essential for getting a full scope perspective on the origins of the Afro-Diaspora. See also:
- “West Africa” category on 23andme (2013-2018)
- 23andme results from West Africa (part 1) (after 2018/2019 update)
- 23andme results from West Africa (part 2) (after 2018/2019 update)
4. I will be working under the assumption that these “Ivory Coast/Ghana” and “Benin/Togo” scores are reported as main region and also with a considerable relative share within the complete African breakdown. Arguably the main regions appearing in your results might be more deserving of your research efforts. Your research results might then be more fruitful and covering a wider span of your ancestral make-up. As afterall the regions with the biggest amounts can be deemed to be more solidly based on your most important regional origins (even when taken as mere proxies).
Therefore any reporting of “Ivory Coast/Ghana” and “Benin/Togo” as mere trace regions with low confidence will be left out of consideration. As the labeling already implies in such cases you are dealing with an increased possibility of a false positive or misreading of your DNA. Depending on the particulars actually such scores might still have informational value. But the array of ancestral possibilities simply becomes too broad for any meaningful discussion on this page.
5. As my survey (2013-2018) has demonstrated and also in accordance with Ancestry’s own information, so-called “Ivory Coast/Ghana” may be reported as a main region (above trace level) for people as far north as Senegal and as far east as Nigeria. However on average these scores are likely to be subdued and minor unlike the primary and even predominant amounts reported for Liberia and (southern) Sierra Leone. It’s reasonable to assume that generally speaking such small DNA amounts will hardly be detectable for Afro-descendants after many generations of genetic recombination and dilution. Especially when only taking into consideration Afro-Diasporans with substantial amounts of “Ivory Coast/Ghana”.
This is however pending on any forthcoming update of my survey findings for Burkina Faso, Guinea and Mali. Regrettably I hardly have any results from these countries right now. But it might be expected that the group averages for the so-called “Ivory Coast/Ghana” region in these countries might still turn out to be considerably high. For an intriguing alternative ancestral scenario of northern Ghanaian (Gur speaking) origins:
- Ama, A Story of the Atlantic Slave Trade (M. Herbstein, 2001)
“Set in the late eighteenth and early nineteenth centuries, the book tells the story of Ama. a girl from what is now northern Ghana who is kidnapped by a Dagomba raiding party and taken to the Asante capital of Kumasi, then to Elmina Castle on the coast and, eventually, to a slave plantation in Brazil.”
6. Ideally you would want to verify if the shared DNA segment with your West African matches is also showing up as “Ivory Coast/Ghana”. Because that way you could have more certainty that these matches will indeed relate to your own “Ivory Coast/Ghana” amount. Regrettably this potentially very useful information is not available because Ancestry so far has not implemented a chromosome browser. See also:
7. It should be pointed out that only Trans Atlantic slave voyages are being included in charts 5.3, 5.4 & 5.6 as well as map 5.3. And not Inter-Colonial slave voyages! So this data is not intended to reflect the full picture. For example largely undocumented English contraband slave trading was very significant for the Hispanic Americas and to a lesser degree also Haiti (“Saint Domingue”). While for the USA especially Domestic Slave Trade from the Upper South looms large. In order to avoid any potentially misleading information I have therefore left out the highly incomplete data for the Dominican Republic, Puerto Rico and Louisiana. As it is least likely that their African origins will be reasonably well represented by the TAST database. For all places mentioned obviously also post-Slavery migrations should be taken into consideration (for more disclaimers see this page).
8. It might be possible that within the USA context the odds of genuine Bight of Benin origins will be highest for people from Louisiana. However this is very tricky to ascertain due to much higher shares of inter-colonial (from the West Indies) as well as domestic slave trade (from the Upper South) rather than direct Trans-Atlantic slave trade with Africa. Therefore tracing back to the earliest ancestral locations within the Americas might be an especially difficult task. See also:
9. Ideally you would want to verify if the shared DNA segment with your West African matches is also showing up as “Benin/Togo”. Because that way you could have more certainty that these matches will indeed relate to your own “Benin/Togo” amount. Regrettably this potentially very useful information is not available because Ancestry so far has not implemented a chromosome browser. See also:
10. This section is mostly based on an earlier blog post I wrote in 2015: Is “Benin/Togo” really pinpointing origins from within Benin’s borders? To date it remains one of my most popular blog posts. Especially in 2017 when it was by far my most read blog post (around 14,500 views). Indicating perhaps how especially this so-called “Benin/Togo” region has captured the imagination of many African Americans and other Afro-descendants while trying to make sense of their AncestryDNA results. As I will continue to say the country name labeling should not be taken too literally. However if you make an effort to inform yourself of the wider context and learn how to interpret correctly this usually unexpected regional score for many people could still prove very insightful in their quest to Trace African Roots!

Hello,
Nice work Fonte and thanks again for all the work you are doing it’s very helpful! 🙂 I have been wondering about the inter-migration within Africa and how this could have impacted the results we have observed so far for continental Africans and also for the diaspora. I went to http://www.slavevoyages.org to see the number of voyages between African regions (from 1514 to 1866) and Sierra Leone is by far the region that received the highest amount of African slaves ( about 94,300 from a total of 457 voyages mostly during the 1800s, with the Bight of Benin and the Bight of Biafra representing the highest amounts of slaves embarkations). Concerning the Windward Coast, all the ships came from Central Africa (Cabinda, Congo River, and Loango to be specific) and totaled about 5000 disembarked slaves from these regions. Do you think maybe this could be a possible reason behind the 7% Southestern Bantu for one of the Ivorian Akan samples? Inland migration can also be a possibility but I don’t know these regions with high SoutheasternBantu are quite far from Ivory Coast, it’s a trace region for this particular sample but 7% is quite something, plus it comes with some Cameroon/Congo…. AAh! Je suis intriguee by these results since I saw them I am just trying to figure them out lol
LikeLiked by 1 person
Salut! Haha it’s very intriguing indeed! As I told you i have come across such puzzling SE Bantu scores for other West Africans as well. And just very recently I’ve added a new result from Guinea Bissau (Fula Preto) who has an unexpected “Nigeria” score of 19%!!! Perhaps due to trading connections with Hausa-Fulani in northern Nigeria? Either way like you said African migrations across the continent should be taken into account. Although I’m also very curious to know what will happen with these scores after Ancestry does their update. Plus also looking into DNA matches might provide further clues.
But the historical context definitely matters! So that’s a great idea to look into the slavevoyages database. I hadn’t thought about that myself yet. Very fascinating to get so much detail. And especially the Liberia / Windward Coast numbers do make such a scenario more plausible. It also reminds me how apparently all Krio people are called “Congo’s” in Liberia.
I do know about this other website which focuses more on the socalled Recaptives or liberated Africans being resettled in Sierra Leone, Liberia and also Gambia it seems. It’s still being expanded but it already has a searchable database:
https://liberatedafricans.org/courts.php
Another thing I was thinking although perhaps a bit farfetched (because of dilution) is the incoming slave trade carried out by the Portuguese on the Gold Coast when they still had the Elmina Castle (1482-1637). I’m talking about slave imports and not slave exports! With African captives being brought over from Nigeria (Benin Kingdom) and also the Congo by way of São Tomé, to be sold to Akan and/or Mandé merchants in order to work as carriers in the inland gold trade. This part of intra-African slave trade history is not well known among the general public but it may have involved quite considerable number of displaced people who ended up in Akan territory. This article provides more backgroundinfo:
Wangara, Akan and Portuguese in the Fifteenth and Sixteenth Centuries. II. The Struggle for Trade
LikeLike
Aah Haaa!!! Do you remember the conversation we had on Nsoko and Begho and the Wangara trading slaves in exchange of gold with the Akan on here https://tracingafricanroots.wordpress.com/2017/11/23/roots-nl-s1e2-searching-for-gold/
The source you posted come as a great supporting evidence :D, which explains very much the minor Mali we see among many Akan….however, I am really surprised by the fact that as early as the 15th century slaves were also imported from regions as far as the Congo in Akan territories, thank you for the information, I ll try to dig further and will notify you if I find some interesting info/articles.
Concerning the Guinea Bissau Fula, you are probably right on trading connection with Hausa-Fulanis. Does he have some minor Benin/TG and/or Cameroon as well? Because if he does, I think another possibility could be disembarked slaves coming from Bight of Biafra and Bight of Benin during the TST. Based on Slavevoyages again, the Senegambia and Offshore Atlantic (Guinee Bissau and Cape Verde included) received a bit more than 250 disembarked slaves from the Bight of Benin and 900 from the Bight of Biafra between 1657 and 1828…I can send you the spreadsheet that I queried from their database if you want, which shows the number of African disembarked to other African regions between 1514 and 1900. Based on this same website the number of disembarked slaves in the Gold coast is estimated at 145 between 1794 and 1823 coming from the Bight of Biafra and Gulf of Guinea Islands (specifically Calabar and Gabon). In the windward coast the disembarkations occurred pretty late between 1845 and 1861 which made it easy for them to conserve their original names (Congo) and assimilate to Americo-Liberians who arrived somewhat during the same period. However I think other regions which received disembarked slaves (in earlier periods) who were sold to natives of these regions assimilated to the locals (which is probably the case with the 145 Biafran disembarked in the Gold Coast).
LikeLiked by 1 person
The person from Guiné Bissau doesn’t have any other unexpected regional scores, at least not in substantial amounts. He’s 55% “Senegal”, 21% “Mali”, 19% “Nigeria”, 2% “Africa North”, 2% “Ivory Coast/Ghana” and <1% “Benin Togo”. I’m going to look into his DNA matches to see if i can uncover any connections with (northern) Nigeria. I will have more details when I finish the follow-up to this page.
It’s very fascinating though what you found in the Slavevoyages database. I have a feeling these people were being settled in Gambia especially where a small Krio population (also called Aku) still lives. I actually have one Gambian result in my survey whom i suspect has partial Aku lineage (aside from Wolof and Fula) she has 12% ” Benin/Togo” and also 7% “Southeast Bantu”! She made a Youtube video you might already have seen, it seems to be down now though.
LikeLike
So Ivory Coast/Ghana is pretty much indicating Akan, Kru, & Southern Mande right ?
Ivory coast/Ghana is pretty much indicating Liberia, Sierra Leone, & Guinea.
My third highest African genetic make-up is Ivory Coast/Ghana.
I’m 10% Ivory coast/Ghana
So how many generations would that be of Ghana, Ivory Coast, Liberia, Sierra Leone, & Guinea ?
LikeLike
Yes. Based only on your ethnicity estimates it is not possible though to find out the more detailed questions you’re asking. This will require follow-up research (historical context, genealogy, African DNA matches etc.). Do also keep in mind that after Ancestry’s update in September 2018 many “Ivory Coast/Ghana” scores have been decreased. So your own 10% score could be an underestimation.
See also:
https://tracingafricanroots.com/2018/09/22/did-ancestry-kill-their-african-breakdown-part-1/
LikeLiked by 1 person
Alright brother
LikeLiked by 1 person
So I’m pretty much mix with Ghanaian, Ivorian, Liberian, & Sierra Leonian 😁
And I’m Anglo Carribean 😁😎
LikeLike
My 10% Ivory coast/Ghana is a underestimation, what does that mean ????
LikeLike
It means you will have to followup research: african dna matches, relevant historical context, genealogy etc.
LikeLike