
In 2013 AncestryDNA updated their Ethnicity Estimates to include a very detailed breakdown of West African ancestry (see this article). Soon afterwards I started collecting AncestryDNA results in an online spreadsheet in order to conduct a survey of the African regions being reported by AncestryDNA, among both African Americans as well as other Afro-descended nationalities. Attempting to establish how much the AncestryDNA results on an aggregated group level can already (despite limitations of sample size) be correlated with whatever is known about the documented regional African roots for each nationality.
Rumour has it that AncestryDNA will shortly start rolling out a new update of their Ethnicity Estimates. So it seems the time is right to finalize my survey. The sample size for most groups appears to be suffciently robust now to allow a meaningful intercomparison. In the AncestryDNA section of my blog (see the menubar) you can find a detailed summary of my survey findings based on 707 results for 7 nationalities:
Gathering all the results was a great learning experience. It has been a very satisfactory project! My survey report merely represents my personal attempt at identifying generalized, preliminary and indicative patterns on a group level inspite of individual variation. Everyone has a unique family tree of course first of all.
I would like to thank again all my survey participants for sharing their results with me. I am truly grateful for it!
____________________
“This frequency of regions being ranked #1 (regions with the highest amount in the African breakdown) is perhaps the best indicator of which distinct African lineages may have been preserved the most among my sample groups.”
____________________

***
Ethnicity Estimates not “just for fun”
Judging from online musings some people tend to react dismissively when finding out about the inconsistencies of AncestryDNA’s socalled “Ethnicity Estimates”. For example when comparing siblings results or when contrasting their ethnicity estimates with known family history or with results by other DNA testing companies/websites. Seemingly as an ongoing mantra DNA matches are being praised for their informational value while admixture test results are being derided. While I do indeed agree that a critical stance should always be maintained when dealing with the claims of DNA testing companies. I still find it unwise (to say the least) to let the current imperfections of AncestryDNA’s Ethnicity Estimates lead to an absolute rejection of any potential informational insights to be gained.
It seems obvious that AncestryDNA’s Ethnicity Estimates should not be expected to be 100% accurate. Given the inherent limitations of DNA testing in general and more specifically the restricted availability of African reference populations. Certainly there will be room for future improvement as this is still a science in its infancy stage. But quite possibly socalled admixture analyses might never truly deliver what many consumers (unrealistically) seem to demand: ethnic/racial “blood quanta” which correspond exactly with known genealogy. Generally speaking ethnicity does indeed correlate with genetics or shared descent. But certainly not perfectly so as afterall ethnicity is also a socio-cultural construct, fluid across timeperiods and subject to migrations (also very ancient ones!) and inter-marriage. It appears that especially the genetic overlap between neighbouring ethnic groups is often underestimated or even severely misunderstood by the general public.
On the contrary i would argue that AncestryDNA can still offer valuable clues about where your African ancestors were located in a regional framework. Admittedly quite sketchy but still not to be discarded either provided you are aware of the following:
- Inherent limitations of DNA testing (see disclaimers in AncestryDNA & AncestryDNA Regions)
- Correct interpretation starts with not taking everything at face value. For example the labeling of ancestral categories (not only by AncestryDNA but also by other DNA testing companies/websites) is bound to be a complex affair and might never be 100% satisfactory. Due to inter-ethnic and bordercrossing genetic connections, both recent and ancient ones.
- Population averages, or any kind of aggregated test result data, may improve a deeper understanding of your own personal results by providing benchmarks. Especially when based on the results from people of verifiable backgrounds.
- Plausible inferences based on your admixture results can be made on not only a continental level (usually very reliably even) but certainly also on a subcontinental level. Especially when dealing with distinct ancestral clusters (such as the East African category on 23andme or arguably the “Senegal” region on AncestryDNA). It is true that many of AncestryDNA’s regions seem to be overlapping with neighbouring ones but evenso this seems to occur in a cluster-like fashion. For example generic Northwest European ancestry may be captured by a composite of any of the following regions: “Great Britain”, “Ireland“, “Scandinavia“, “Europe West“. While for generic Southwestern European ancestry in addition it would be: “Iberian Peninsula”, “Italy/Greece” and to a minor degree “Africa North”. This is one of the reasons i have chosen to also include an additional breakdown of my own making into Upper Guinea, Lower Guinea and Central Africa.
- Additional context. Combining admixture test results with other informational sources may reveal plausible ancestral scenarios beyond even a mere regional level. The truth has many angles and we should explore them all. One of my main research goals was to contrast the historical information we have on slave trade patterns with the group averages of AncestryDNA results among Afro-descended nationalities. The outcomes of my research, even when only a modest attempt, suggest that AncestryDNA’s Ethnicity Estimates are not to be belittled as “just for fun” but can indeed provide valuable ancestral information. In fact not since the pioneering African Ancestry Project by Razib Khan in 2011 have i personally seen such potentially insightful DNA test results for Afro-descendants (see also this thread on the 23andme Community).
Main Outcomes
My main survey findings are discussed in much greater detail in the link i already provided. Below follows a short summary:
- Multiregional origins within Africa, also for Cape Verdeans
- African regions not tied to just one single nationality
- Hispanic Americans show higher degree of Upper Guinean roots than African Americans
- Jamaicans show greatest degree of Lower Guinean ancestry
- Central African regions less prevailing than West African regions, also for Haitians
- Dominicans most evenly mixed in their African regions
- Documented African origins mostly confirmed on group level
These charts below reflect my main research outcomes. It should be noted they are in part based on minimal sample size and their interpretation is restricted by the limitations of DNA testing itself. Therefore they are not intended for easy generalizations 😉
____________________
” This chart features an additional breakdown of my own making into 3 greater African zones: “Upper Guinea”, “Lower Guinea” and “Central Africa”. Bantu speaking ancestry from Southeast Africa also to be included in “Central Africa”. […] I find this distinction useful because it allows certain regional patterns to show up more clearly and it conforms with common nomenclature in slave trade literature. For ethnolinguistical and historical maps from these 3 main regions of provenance see:
____________________

____________________
“In order to research the least diluted regional lineages across the Diaspora i am focusing however on the maximum scores for each region. Results which feature one region in extra pronounced degree. “
____________________

***
“Average” Results Across the Diaspora
____________________
“These results below show the greatest similarity to the regional group averages i have calculated for each of the seven nationalities i have been comparing on this page. This selection is based on the limited amount of results that were available to me, so it will not always correspond perfectly. Still they seem to be reasonably representative for each sample group. Especially with regards to their total African amounts and the ranking of the main African regions. “
____________________
*** (click to enlarge)

*** (click to enlarge)

*** (click to enlarge)

***
Distinctive Results Across the Diaspora
Below screenshots have been selected to illustrate seemingly distinctive regional compositions among my sample groups for persons of an identical or comparable level of African descent. The first three results are from people with verified African backgrounds. Eventhough merely individuals I have selected them to showcase the potential predictive accuracy of each African AncestryDNA region (for a more detailed assessment see: AncestryDNA Regions).
*** (click to enlarge)

***
The results below are rather special in that they belong to people who are of 100% African descent, unlike the vast majority of my survey participants who also showed non-African admixture. In sharp contrast with the three African results above these three Afro-Diasporeans below show a much higher degree of regional diversity. As can be verified by the number of regions above trace level as well as the wider geographical range.
The high “Mali” and considerable “Senegal” scores for the African American (with South Carolina origins) stand out among the three. Based on what i have observed during my survey and in line with documented slave trade patterns i would say this type of heavily Upper Guinean influenced profile is likely to be more typical for African Americans than for either Haitians or Jamaicans. The predominant combination of “Benin/Togo” with the two Central African regions of “Cameroon/Congo” and “Southeastern Bantu” seems to be fittingly characteristical for the Haitian. Even when this combination might not be unique for Haitians. The relatively restricted range of 3 regions above tracelevel is perhaps what singles out the Jamaican result the most, even when this particular combination might very well also be reported for an African American.
*** (click to enlarge)

***
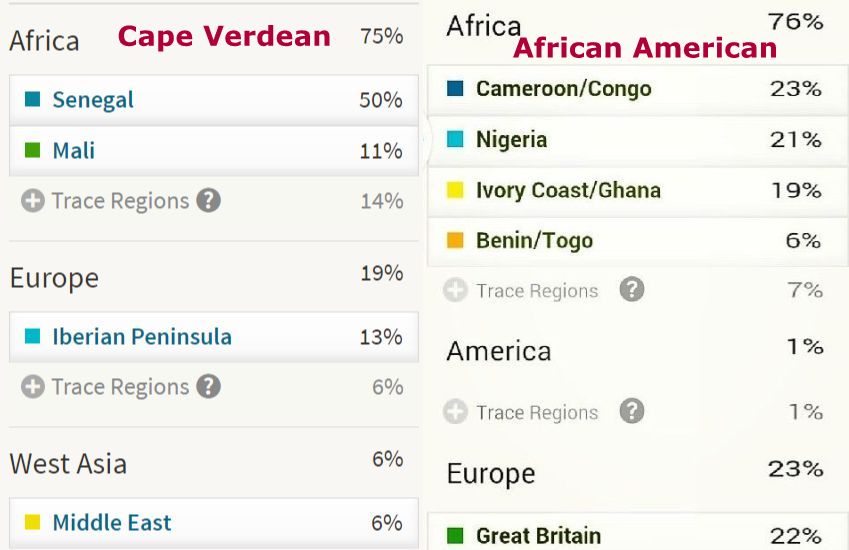
Both the Cape Verdean and the African American results below are featuring the most significant regions detected among their respective sample groups.
*** (click to enlarge)
***
My Cape Verdean sample group showed the most consistent regional profiles in my survey, with “Senegal” nearly always (36/40) being predominant and “Mali” often coming in second place. While for Hispanic Caribbeans a much more regionally diverse and variable composition was the outcome. Inspite of a significant Upper Guinean founding effect among Hispanic Americans it can be seen below that in many cases Dominican and Puerto Rican results can easily be distinguished from Cape Verdean ones. Even when they do share the exact same African amount and comparable Iberian scores. Of course their minor but above trace level Amerindian component also already gives away that we are dealing with triracial New World populations.
*** (click to enlarge)

***
Another instance of an African American and Cape Verdean result displaying their most frequently seen regions. It will be very fascinating to see if perhaps among Louisiana Creoles a more Cape Verdean like result might be obtained. However from what i have seen sofar this might still be uncommon.
*** (click to enlarge)

***
The Jamaican result below is perhaps most typical from the three as it features a more narrow regional focus. Hispanic Caribbean results in my survey were usually more evenly divided and also featuring a higher degree of Upper Guinean regions. Even when they did also exhibit a great deal of shared Lower Guinean origins with Jamaicans.
*** (click to enlarge)

***
Similar results across the Diaspora
____________________
“Still it is possible that people of two different nationalities but with the same total African amount will obtain the exact same African breakdown or nearly so. Also for individuals of two different nationalities and with different levels of total African ancestry the regional scores in their African breakdown might still come very close, both proportionally speaking and in ranking. Implying that in such cases it will actually be the non-African regions which might prove to be most useful then to identify each separate Afro-descended group based on their DNA results.”
____________________
Nearly identical African breakdowns for people of different nationalities can be seen below. Highlighting the shared African regional roots across the Diaspora. Even when the underlying ethnic origins might still be more differentiated. Side by side and juxtaposed it looks very striking! Again individual results were selected with equal or comparable total African amounts.
***
It seems only the total amounts of Amerindian ancestry reveal the nationalities of the results below.
*** (click to enlarge)

***
A similar combination of “Mali” & “Africa North” and also again for persons of only minor African descent. Such results appeared quite frequently among my Puerto Rican and especially Mexican sample groups. For Cape Verdeans this outcome was however very uncommon. Because of the shared slave trade history between Cape Verde and the Hispanic Americas possibly the very same ethnic African lineage might be implied or at least closely related ones. This time the absence of any additional Amerindian component clearly marks out the Cape Verdean as an “Old Worlder”.
*** (click to enlarge)

***
The exact same ranking of two African regional lineages which were most likely also among the founding populations (Upper Guinean and Angolan) of the Hispanic Caribbean in the 1500’s/1600’s. And in addition also similar North African percentages and even the Amerindian scores are quite comparable. Even when from my survey on average Dominicans tend to score about half of what Puerto Ricans receive for their Native American region. Very remarkable that both early waves of African origins among Hispanics have been well detected by AncestryDNA. Especially since these regions are located on opposite ends of the continent.
*** (click to enlarge)

***
Similar proportions of “Senegal” and “Mali” are being shown. Even when the total African amount is higher for the Cape Verdean than for the Dominican (which would be in line with their group averages). Because of the high regional diversity among Dominicans such close parallels are not really that common, but interestingly they do exist! Also notice again how the Amerindian component can be used to safely distinguish between both results. The additional “Middle East” score for the Cape Verdean is also noteworthy even when it is not unique for Cape Verdeans.
*** (click to enlarge)

***
Very close equivalent results both above and below trace level. The European breakdown is not included, but actually again likely to be similar because of a predominant “Great Britain” or otherwise Northwestern European score. One might almost say that genetically speaking these persons seem to be interchangeable. Highlighting the great degree of shared regional roots between African Americans and Jamaicans. Generally speaking what seems to distinguish African American results from Jamaican ones (if at all) is a greater occurence of Amerindian scores (even if usually only around trace level). And also it may perhaps be expected that African Americans will usually show higher “Senegal” scores (even if not consistently so) and a more balanced range of their African regions.
*** (click to enlarge)

***
The very same amount of “Nigeria” is being reported for the African American and the Haitian below. Also otherwise the same top 5 regions are being shown even if not in exact same order. When comparing Haitian results with African American ones such similarities can regularly be seen. Again the slightly more noticeable Amerindian component and more pronounced “Senegal” scores for African Americans might often serve as a distinguishing aspect, but not in all cases. Quite possibly however the “Nigeria” scores for Haitians might much more frequently be referring to western or northern Nigerian origins rather than southeastern ones. Even when Igbo’s also have been documented in considerable numbers for Haiti. And therefore should not be discounted as an ancestral option.
*** (click to enlarge)

***
Identical amounts of “Cameroon/Congo” as well as total African on display below. I have already seen quite a few Jamaican and Haitian results strongly resembling each other. Even when their sample groups were the smallest in number during my survey. However quite possibly different ethnic implications apply for regions such as “Cameroon/Congo” and “Benin/Togo”. With Haitians pulling more towards Congo and Jamaicans moreso towards Togo on average. Also interesting and probably counter-intuitive for many people how the Haitian result shows more “Ivory Coast/Ghana” than the Jamaican result.
*** (click to enlarge)

***

EXCELLENT! I’m with you. AncestryDNA test results are not simply entertainment. They point to real hints of African ancestral lineages within a regional context. “More than just fun” is evident when you analyze the Nigerian pie graph. The regional scores Nigeria (75%) and Benin/Togo (25%) make a lot of sense. It is a fact that a sizable number of Yorubas were located in eastern aeas of what would become the colonial geopolitical unit “Benin”. Plus, the Fon and Yoruba, for instance, share strong cultural ties (Ile-Ife in Nigeria & Ifa/Afa divination system). So quite a bit of spiritual syncretism occured let alone ethnic admixture. Additionally, The Ga ethnic group in Ghana and Togo reportedly originally came from the Kingdom on Benin (in Nigeria); but because of some conflict, they eventually pushed westward, trekking through today’s Nigeria, Benin, Togo and finally terminating in Southeast Ghana. And certainly, Cape Verdeans consistently top ranked regional scores of Senegal/Mali conform with documented and historical events. From what i understand, Balantas, Fulas, Mandinkas, Wolofs and others from the greater Senegambian region formed a significant part of the African ethnic composition of Cape Verdeans (of course, you would know more on this subject matter than i). I think there’s very little 100% accuracy wth any phenomenon. However, one can observe patterns and trends that can lead to reasonably accurate conclusions or generalizations. This work is invaluable. Thanks a mil! Karim
LikeLiked by 1 person
excellent post, very informative. I ponder why the other specialists of this sector do not
realize this. You should continue your writing. I’m sure, you’ve a great readers’ base already!
LikeLiked by 1 person
Thanks so much for your comment & the encouragement!
LikeLike