
Trinidad Slave Census of 1813
SUMMARY
Number of slaves 25,696
Creole (i.e born in the West Indies) 11,633 (45% of total)
African 13,984 (54% of total)
African specified ethnically/regionally 13,391 (52% of total)BREAKDOWN OF AFRICAN BORN SLAVES
Ibo (Nigeria) 2,861 – 21% of African specified
Congo (Congo) 2,449 – 18% of African specified
Moco (Nigeria/Cameroon) 2,234 – 17% of African specified
Source***(click to enlarge picture)

***
The 1813 slave census of Trinidad is probably the most detailed and also providing the biggest coverage of African ethnic roots existing for Afro-Diasporeans anywhere in the Americas! Quite possibly the census describes the African ethnic origins for about 40% of the population at that time, 13,391 persons out of a total population (incl. free persons) of 35,270. Trinidad had one of the largest African-born percentages in the Americas at that time (54% of total slave population) and slaves were a big majority of total population (75%) (Higman 1984). Also the total number of people included in the census provides one of the highest sample size of Slave Ethnicity Data anywhere (Nunn 2004). Which is simply amazing given the lack of such ethnically detailed information in this format and such numbers for many other Afro-descended populations! At times these ethnic origins are being described by proxy, using only geographical designations but at times also very specificly based on replies of the slaves themselves. Some ethnonyms have not yet been identified even! In total 115 ethnic/regional names were mentioned.
This 1813 census is of course first of all of the highest importance for those who want to explore the African ethnic origins of Trinidadians. However also for other Afro-Diasporeans this census can be very relevant and helpful! It can be valuable in showing the possible ethnic backgrounds hiding behind any regional breakdown according to slave trade statistics. Plus it will also provide a useful example of the relative frequencies of particular ethnic groups. Given the very large sample size and the fact that most of these slaves were brought to Trinidad by English slave traders it could very well be representative to some degree for African Americans and Jamaicans as well. Of course keeping in mind its inherent limitations, firstmost being that it can only be reflective of slave trade patterns in the relatively late period 1790’s-1810’s.
N.B. these charts below are adaptations from the original census charts in Higman 1984. There’s some differences in the regional breakdown given as well as how some ethnic groups have been identified (see Paul Lovejoy 2003).
***(click to enlarge picture)


***
Some brief observations:
- For the Senegambia region the Mandingo are shown as absolutely dominant. However it is known that this term could yet be hiding much underlying ethnic diversity as it was often used as a lumping category. Strictly Senegalese ethnic groups (Wolof, Senegal, Diola, Gorée) are very minor in comparison.The Fula (“Fulbe”) are shown in notable numbers, however many could have been from Guinea Conakry (Futa Jallon) instead. Indeed in Higman 1984 they were assigned to the “Sierra Leone” region.
- For the Sierra Leone region the smallest overall % is given, but a remarkable number of specified ethnicities is given. Again many of the Fula and also some of the Mandingo assigned to Senegambia (by Paul Lovejoy) could have been from Guinea/Sierra Leone instead. Otherwise almost equal presence of the Susu and Temne. The Mende from southern Sierra Leone being quite minor, it is known they would get caught up in the slave trade to a greater degree in later periods of illegal slave trade.
- For the Windward Coast aside from the generic Kwakwa designation almost equal shares for Cape Mesurado (which is in modernday Liberia) and Cape Lahou (located in the Ivory Coast). Overall a region of only minor importance.
- For the Gold Coast a lower share is shown than would have been the case in earlier decades of UK slave trade. Ghana probably offers the least specific ethnic details as most names given only refer to slave ports. Only very few slaves mentioned as being Fanti, Abron, Akan etc.
- The Bight of Benin shows a combination of explicit ethnic details (Adangme, Gbe, Hausa, Yoruba) and the more generic slave port references (Allada, Popo). The Chamba refer to Gur speakers from the interior and might as well have been transported via the Gold Coast/Ghana. Notice how the Yoruba presence at this time is quite minimal. This would change in later decades because of the collapse of the Oyo empire.
- The Bight of Biafra is very clearly the most numerous region overall and showing an almost equal share of “Eboe” and “Moco”, also the Ibibio are quite significant. Highlighting how southeast Nigeria/west Cameroon was home to ethnically varied people and not just the modernday Igbo, although they very well could have been a plurality/majority and also culturally dominant. Only 4 persons from Gabon, indicative of this very thinly populated country playing a very minor role in the slave trade, relatively speaking.
- Central Africa is the second most important region and in this overview only the Kongo are being shown as hailing from that area. In Higman 1984 actually some other groups are mentioned as well, incl. 59 “Angola’s” and 1 “Cabinda”, but indeed by far (2449/2555) most people from this area were labeled (or eventually selfidentified) as “Congo’s”. Many “Congos” perhaps even most could have been ethnically Bakongo but undoubtedly also other ethnic groups are hiding under this umbrella term (see the map section).
____________________
“The enslaved that are recorded in these registers are the ancestors of the vast majority of Afro-Caribbean people in Trinidad and are therefore of immense social significance.”
____________________
When it comes to answering the intitial question posed by this blog post probably only future finegrained DNA research into the regional African autosomal origins of Trinidadians might prove to be conclusive (see Anglo-Caribbean AncestryDNA results). Afterall nobody can claim to have any certainty about the approximate genetic legacy of the people mentioned in the census as we don’t know their life stories after they were registered. Undoubtedly the 1813 census provides very valuable and solid data from which we can deduce significant ancestral information. However it can only be a snapshot of the ethnic composition in this particular period and for the estimated 40% of the population at that particular time. Despite the impressive numbers and scope of the census there’s still additional vital information to be taken into consideration as many slaves and African contract labourers kept entering Trinidad after 1813 and also the African origins of the “Creole” (Caribbean born) slaves and freedmen are left unspecified. Again Trinidad is “lucky” in this regard that plenty of documentation helping to fill in the gaps has survived (see Trotman 2003 for a more detailed overview):
- At the time the census was held about 45% of the slave population was termed “Creole” i.e., born in the New World. Also about 17% of Trinidad’s population was no longer enslaved in 1813 but still Afro-descended (Higman 1984). Most of these people would originally have come from the French Caribbean (Grenada, Martinique, Guadeloupe). According to Trotman (2003, p.229) “we can assume that their ethnic origins reflected the contours of the trade to the French Caribbean. We know that for the French colonies for 1715—1792, the Bight of Benin and the Congo plus Angola were the two dominant regions of origin.”
- Also free blacks were arriving and settling in their hundreds in Trinidad after 1813. They were mostly demobilized soldiers and their families sent to Trinidad for their retirement. They had served for the British either in the war of 1812 against the USA (the socalled Black Loyalists or Black Refugees) or were ex-members of the West-Indian regiments. In the first case they were often USA born and former slaves, otherwise they were often African born and according to Trotman (2003, p.233) “with the Igbo and Congo dominating numerically“.
- After slavery got abolished in 1834 it is estimated that about 8000 socalled recaptives were sent to Trinidad from Sierra Leone and St. Helena up till 1869. It is known that the Congo and the Yoruba easily made up the biggest majority among them. When it comes to a speculative Top 5 African ethnic origins for Trinidad the Yoruba should therefore perhaps also be included and possibly the “Congo” might have been the most numerous group over all.
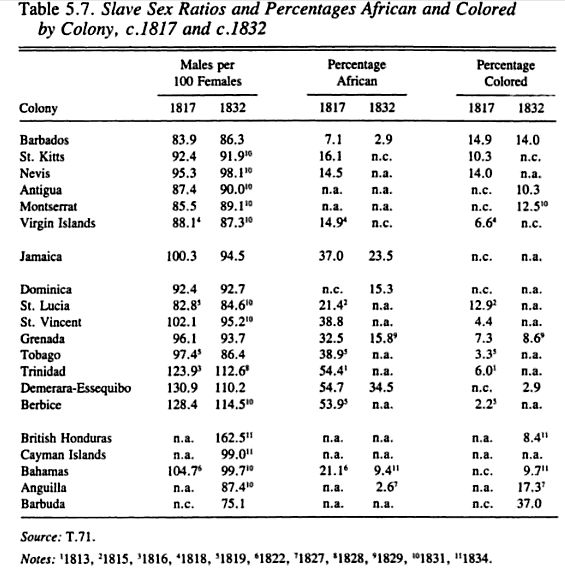
The population history of Trinidad is quite peculiar for the Caribbean context because most of its slaves only arrived after 1780. In this way it’s more comparable with Cuba than the Anglo-Caribbean because it resulted in a higher share of African born slaves in the 1800’s (see also this previous blogpost). English rule over the island only started in 1797. It had been in Spanish hands before but in the preceding two decades a veritable influx of French planters and their slaves had taken place. They were arriving on invitation of the Spanish (1783 Cedula) who were hoping to finally spark off the stagnating economy of the island, which indeed happened. Trinidad continued to be one of the fastest growing plantation economies in the 1800’s, requiring large numbers of first enslaved labour and later on also contract labourers not only from South Asia but also from Sierra Leone as mentioned earlier.
These charts below (taken from the Slave Voyages Database and Higman 1984) demonstrate how Trinidad’s slave trade only got started in a major way in the 1780’s and also how Trinidad’s share of African born slaves was unrivalled among other English ruled colonies, except for Demerara and Berbice in Guyana. The last chart is showing how the regional breakdown of (direct) slave trade to Trinidad compares pretty well with the breakdown according to the census, with the Bight of Biafra & West-Central Africa being dominant. In comparison with the (formerly) French ruled islands it seems that especially the relatively high Bight of Benin and again high West-Central Africa of Martinique might have been influential for the ethnic composition of Creole slaves in Trinidad.
***(click to enlarge picture)

Trans-Atlantic Slave Trade Database (2010) (http://www.slavevoyages.org/)
***(click to enlarge picture)
***(click to enlarge picture)

Trans-Atlantic Slave Trade Database (2010) http://www.slavevoyages.org/)
***
Trinidad is well known for its ethnically & racially diverse population nowadays but already the birth places shown in the 1813 census depict a story of widespread (forced) migration within the Caribbean region as well as directly from many different places within Africa. Focusing now on the Creole slaves, we can see that most of them (7088 out of a total of 11,633 =61%) were born in Trinidad. But given that in 1782 there had only been 382 slaves on the entire island (!), it can be assumed that almost all of them either had parents born in French Caribbean islands or African born parents imported by French Caribbean settlers (Trotman 2003, p.220). Next follow Martinique, Grenada and St. Vincent as most frequently mentioned birth place. All originally French settled although the last two islands had been placed under English rule after 1783. Lastly also from the English settled Caribbean islands many slaves were eventually transferred to Trinidad, especially after 1807 when direct slave trade from Africa officially got banned.
***(click to enlarge picture)

___________________________________________________________________________-
Sources:
– Higman, B. W. (1984). Slave populations of the British Caribbean, 1807-1834.
– Lovejoy, P.E.(2003). Ethnic designations of the slave trade and the reconstruction of the history of Trans-Atlantic slavery, in Paul E. Lovejoy and David V. Trotman, eds. Trans-Atlantic Dimensions of Ethnicity in the African Diaspora, 9-42.
– Trotman, D.V. (2003). Africanizing and Creolizing the Plantation Frontier of Trinidad, 1787-1834, in Paul E. Lovejoy and David V. Trotman, eds. Trans-Atlantic Dimensions of Ethnicity in the African Diaspora, 218-239.

Hi
as a Caribbean person and would like to achieve some aspect of the origin of my African paternal genes.
Have you got such a DNA enquiring service ?
LikeLike
Hello Salaa, i myself have tested with 23andme as well as AncestryDNA. I can recommend both companies. For more details on AncestryDNA, which currently provides the greatest degree of detail on regional African origins, have a look at this page:
Anglo-Caribbean AncestryDNA results (incl. several from Trinidad)
LikeLike
Hello. Are you Fonte Felipe from the ancestry boards? I have a question regarding a post I made from earlier this year.
LikeLike
Yes i am, please feel free to ask your question over here in the comment section.
LikeLike