
Introduction
On this page I will be posting the AncestryDNA results for North and East Africans with confirmed ethnic background(s). Unlike for Afro-Diasporans in the Americas these results can therefore be verified with known genealogy. This should be helpful to determine how reliable/predictive the various African AncestryDNA regions might be and also how they should be interpreted. For other African AncestryDNA results see these pages:
- African AncestryDNA results
- Central & Southern African results
- Nigerian AncestryDNA results
- West African AncestryDNA results (part 1)
- West African AncestryDNA results (part 2)
***
UPDATE 09-08-2019: this page was first published on 20 November 2016 when I had only 58 North & East African AncestryDNA results available for my analysis (see this overview). As my survey has been ongoing I have managed to collect a sample group which has now more than doubled in sample size. Consisting of no less than 135 AncestryDNA results of North & East African persons! Additional screenshots and new group averages have been added therefore. Also a few textual changes have been made (see this link for original version).
For a short recap of my final survey findings follow this link:
Please also keep in mind that AncestryDNA’s ethnicity estimates have been updated several times now! On this page I am dealing exclusively with AncestryDNA version 2 which was current between September 2013 and September 2018. All matters being discussed on this page are therefore not pertaining to updated results (Sept. 2018 up till now). In my opinion this new version 3 regrettably has been a downgrade rather than providing meaningful improvement, overall speaking. Which is why I have discontinued my AncestryDNA survey. For more details see:
- Did Ancestry kill their African breakdown? (part 1)
- Did Ancestry kill their African breakdown? (part 2)
- Did Ancestry kill their African breakdown? (part 3)
***
Chart 1a (click to enlarge)

***
Chart 1b (click to enlarge)

***
In my personal estimation AncestryDNA can report valuable information about your ancestral origins as long as you correctly interpret the data and are also aware of the relevant context and inherent limitations. Still these results might appear to be “off” at first look for those not accustomed to how AncestryDNA or DNA testing in general works. Therefore please keep in mind the following disclaimers (for a more detailed discussion see the AncestryDNA and AncestryDNA Regions pages):
- Don’t take the geographical labeling of the regions too literally. The regional percentages firstmost signal close genetic similarity to samples taken from the areas and/or countries after which the regions have been named by AncestryDNA. Actual origins from neighbouring areas should not be ruled out.
- Especially for North & East Africans it seems often that (very) ancient admixture rather than any recent lineage is suggested by these AncestryDNA estimates. And in this way many of these regional scores might perhaps best be seen as genetic echoes from a (very) distant past. Beyond family tales, historical knowledge or even ethnic origin traditions.
- Ethnicity is a construct which evolves across time due to ethnogenesis. Generally speaking therefore ethnic groups do not possess unique DNA markers. Especially in comparison with neighbouring ethnic groups or from within the same wider region. The most common scenario being a genetic gradient which causes ancestral components to gradually fan out. As can be verified from chart 1 above.
- However by closely studying the regional combinations being reported for North and East Africans we can still learn a great deal. Inspite of individual variation, group averages do tend to provide more solid ground to make meaningful inferences when specifying someone’s ancestral origins. Also finding out where a specific region is most prominent or rather most subdued holds valuable lessons.
Chart 2 (click to enlarge)

***
The above statistical data is based on a limited sample size. Although most countries are being covered now. Which should contribute to a more robust dataset when compared with my initial findings in 2016 (n=58, see this overview). It can be expected that individual variation will be much greater. Correlating with the ethnic diversity to be found in these countries. See for example the finer distinctions I was able to make for Kenya, Ruanda/Burundi and Somalia. Which demonstrate that the continental breakdown beyond Africa is also of importance in some cases.
Eventhough only preliminary statements should be allowed at this stage I highly suspect that these group averages are otherwise already a reasonably good approximation of the main regional components to be found within the North and East African genepool. Atleast according to AncestryDNA’s reference panel (version 2) .
In the very last section of this page I will briefly discuss the implications these results might have for Afro-Diasporans. The individual results behind these group averages can be viewed via this link:
I like to thank all these North and East Africans for having tested on AncestryDNA and sharing their results online so that it may benefit other people as well!
Disclaimer:
I am aware that ethnicity can be a sensitive topic. My motivation to research these so-called Ethnicity Estimates is purely scholarly. It stems from a deep fascination with African history as well as its many connections with the Afro-Diaspora. I do not condone the misuse of my research for identity politics! I am in full support of democratizing knowledge. However when parts of my work are being copied I do expect that a proper referral to my blog and the additional context it provides will be made. Please also keep in mind that DNA testing can be very educational and may have many positive effects. However in some cases it may also be abused by people with bad intentions.
- Can DNA Ancestry Testing Make You More Racist? (Scientific American)
______________________________________________________________________________
East African Results
As shown in chart 2 above and also as will be seen in the screenshots below socalled “Southeastern Bantu” is the most characteristic AncestryDNA region appearing for East Africans generally speaking. One immediate observation is that the socalled “Southeastern Bantu” region is a misnomer for Northeast Africans. The reporting of this region is rather due to the lack of a separate AncestryDNA region based on Nilotic or Cushitic samples within AncestryDNA’s version 2 (2013-2018). [A new “Eastern Africa” region was introduced in 2018, see this link for my assessment].
A great contrast with 23andme which does use Sudanese, Somali, Ethiopian and Eritrean samples, enabling a much finer detection of Northeast African DNA. This produces rather different results that seem to reflect a much more recent timeframe than on AncestryDNA. After 23andme’s update of their Ancestry Composition in 2018/2019 they have actually also been able to include a separate “Southern East African” category based on mostly Kenyan samples but also customer samples from surrounding countries, such as Uganda, Tanzania, Ruanda and Burundi. See also this page:
However there is no need for an overhasty dismissal because as a second-best option this admittedly inappropriately labeled region of “Southeastern Bantu” can still provide meaningful information. I have ranked these East African results based on the amount of highest to lowest score for “Southeastern Bantu”. And despite the obviously limited number of samples an insightful pattern seems to arise already:
- “Southeastern Bantu” peaks among Ugandans & Tanzanians
- Next in line are Kenyans and Rwandans/Burundians
- Followed by Somali, Ethiopian and Eritrean results
- The (South)-Sudanese results in my survey are somewhat intermediate. They would probably show the greatest degree of variation with increased samplesize.
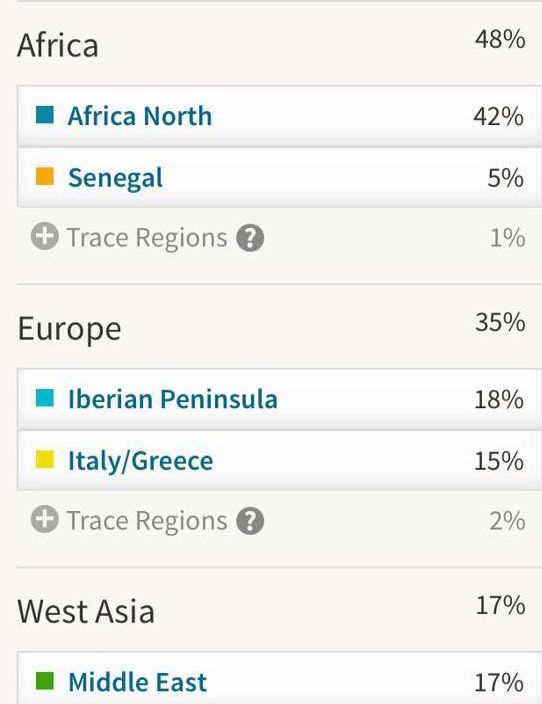
For Northeast Africans a.k.a. Horners “Southeastern Bantu” scores are combined with nearly equally high amounts of “Middle Eastern” and also considerable “Africa North” scores. While – depending on ethnic background – “Cameroon/Congo” will at times also be reported with high amounts for Kenyans and even more so for Tanzanians as well as people from Ruanda and Burundi (see this video). For many East Africans “Cameroon/Congo” will often be a more closer proxy of their genuine Bantu lineage most likely (see also this page). For a subset of East Africans, in particular Sudanese and Uganda, also “Nigeria” might attain considerable scores. Possibly as a proxy of Chadic-related DNA.
The reporting of the so-called “Africa North” region should not be taken as suggestive of recent ancestry from that area for East Africans. Rather it seems to be indicating that East Africans may partially have shared origins in common with the North African Berbers. This ancestral component possibly is derived from one of the most ancient socalled admixture events in Northeast Africa. Probably dating from many thousands years ago. While the socalled “Middle East” portion may in fact also be quite ancient for the greater part but probably was reinforced during recent historical time periods as well.
Also noteworthy that sofar several Kenyans did too receive both “Africa North” and “Middle East” scores. Even when obviously more diluted than for the Horners. For most Kenyans this will in all likelihood represent Cushitic geneflow from ancient times. Unless your family history tells you otherwise. This finding is likely to correspond strongly with ethnic background within Kenya. Actually this ancient Cushitic component has been reported already in the Tishkoff study of 2009, for their 22 Kikuyu samples it showed up as high as 31,5%! See also the supplement Table S9 of this article (p.105):
***
UGANDA (?)
***

***
UGANDA (Northern)
***

***
UGANDA (Aringa, Kakwa)
***

***
These 3 Ugandan results above show an AMAZING degree of regional homogeneity, atleast when applying the AncestryDNA format. Basically their DNA shows up as practically 100% genetically most similar to the samples being used to underpin the socalled “Southeastern Bantu” region. I highly suspect that the 18 samples being used for the socalled “Southeastern Bantu” region are actually consisting of 3 subsets of Bantu-speaking people. One group from South Africa, the second one from Namibia and the third one from Kenya (see AncestryDNA Regions and this chart for more details). Obviously given their Ugandan background, it will be genetic similarity to the Kenyan subset which is causing these extraordinary breakdowns. As will also be the case for all other results shown on this page.
Seen from this perspective these results above are not surprising and actually in support of the prediction accuracy of the socalled “Southeastern Bantu” region. There are however other circumstances to consider. In particular when taking into account the ethnic background of the third result for which I have most details. Notably this person’s family is not linked to any Bantu speaking ethnicity but rather to Nilo-Saharan ones (Aringa & Kakwa), located in the West-Nile Region of Uganda.
Strictly geographically speaking Uganda is clearly within the area described by AncestryDNA for their socalled “Southeastern Bantu” region. So in this way it would be a good fit. Admittedly “Southeastern Bantu” is misleading as this person is actually of Nilotic background. But on the other hand when deciding on an appropriate name for DNA categories there will probably always be some compromise to be made. Possibly a good lesson to take away from all this: don’t fixate too much on the labeling of DNA categories. Rather pay attention to the samples being used as reference populations.
Furthermore useful information can be obtained by comparing with other results of people of verified backgrounds. In this regard it is very interesting to contrast these Ugandan results with the other East African results posted further below. As it seems that this particular outcome is indicating that the “Southeastern Bantu” component identified for Horners is in all likelihood actually related to Nilotic(-like) DNA, as it is also for this Ugandan. Again by proxy of course 😉
***
UGANDA (Northern?)
***
***
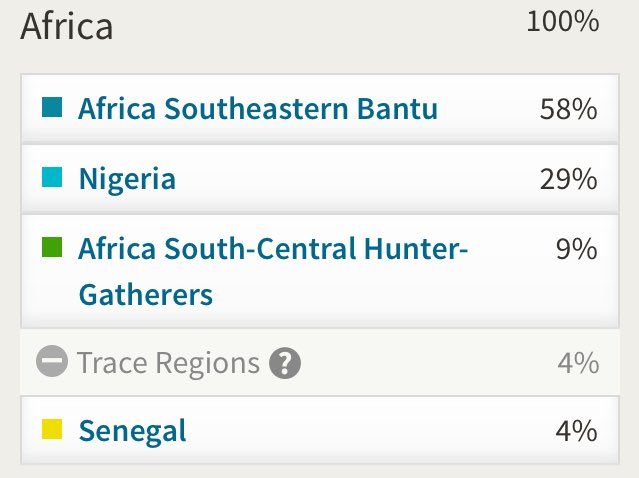
This fourth result from Uganda demonstrates how one should never underestimate the genetic variation within African countries. Especially not such ethnically and linguistically diverse ones as Uganda. Therefore it is inevitable that a single AncestryDNA region will often not suffice. Compared with the first 3 Ugandan results above the major discrepancy lies in the astonishingly high socalled “Nigeria” score. The area in between Nigeria and Uganda is vast and characterized by plentiful genetic differentiation. However due to a lack of relevant samples AncestryDNA can only apply 9 clusters of samples to describe sometimes very localized patterns of DNA. In this case it appears that (given the lack of more fitting samples) a strong similarity was detected with AncestryDNA’s Nigerian samples.
I suspect these results belong to a person with origins from northern Uganda, quite likely Acholi because of the civil war and this persons refugee history. But I do not have any certainty about his background so therefore I can really only speculate. A recent Nigerian connection seems farfetched though as it was not mentioned by this person himself. And also I am only aware of substantial Nigerian migration into northern Sudan (because of the Hajj to Mecca). A more plausible explanation to me seems that possibly a very ancient (Proto?) Chadic affiliation is being detected. Although other theories might also be valid (such as an early split-off of Bantu migrations from Nigeria). With more Ugandan results one could possibly establish if this secondary region acts as some kind of distinctive marker. Only showing up in considerable amounts among certain ethnic groups. See also this video for a South Sudanese with a similarly impressive 21% “Nigeria” score. For more details see also:
The 9% socalled “Hunter-Gatherer” score is equally noteworthy. It seems to be a very solid marker of possibly even relatively recent Pygmy origins. Actually the Ugandan person of Aringa/Kakwa descent also receives Pygmy scores when performing other DNA tests, but it is likely to be much more ancient for him. Lastly the 4% “Senegal” might represent the smallest amount but it is still interesting as this trace region appears for many other Northeast Africans as well.
***
TANZANIA (northern) & UGANDA
***

***
TANZANIA (northern: Jita & Kuria)
***

***
TANZANIA (northern: Kuria)
***

***
Very illuminating these 3 (partially) Tanzanian results shown above. Again nearly 100% genetic similarity with “Southeastern Bantu” is being detected. Actually in this video a Tanzanian is even sharing his 100% “Southeastern Bantu” score! Very similar to the previous Ugandan results therefore. Although this time at least three of the results do indeed also belong to people with a Bantu-speaking background! So this region definitely can also pick up on genuine Bantu lineage from East Africa. Which goes in line with the fact that Ancestry used Bantu-speaking HGDP samples from Kenya (see this overview). However because of language replacement, cultural assimilation and ethnic inter-marriage across the generations there might still also be some significant Nilo-Saharan component involved.
A common aspect for these 3 results seems to be their northwestern Tanzanian locations, nearby Lake Victoria. The Mara region being home to the Jita and Kuria people. While the video results belong to a person of mixed Zanaki & Sukoma background. These ethnic groups again also being located in Mara region and surrounding areas of northwestern Tanzania. I have admittedly only very limited knowledge about the ethnogenesis of these people. However it pays reading some of the Wikipedia articles listed below. As most of them mention a complex history of interaction with neighbouring pastoral groups who were often Nilotic. Also migrations and connections with neighbouring Kenya and Uganda seem very plausible. Making this broader area around Lake Victoria a likely place where “Southeastern Bantu” might peak (at least among East Africans).
In spite of this seemingly genetic homogeneity of course when compared against different sets of reference samples their results might very well show more diversity. As can be seen in the link below where the 100% “Southeastern Bantu” Tanzanian also takes a 23andme test.
- Sukuma people (biggest ethnicity in Tanzania) (Wikipedia)
- Zanaki people (Wikipedia)
- Kuria people (Wikipedia)
- Jita people (Wikipedia)
- Tanzanian 23andme results (Sukuma & Zanaki)
***
TANZANIA (?)
***

***
TANZANIA (western: Ha & Hangaza)
***

***
The two Tanzanian results directly above are featuring a prominent “Cameroon/Congo” score. For the last person it is even primary! This seems like a significant marker to distinguish with the previous northern Tanzanian results. Both “Southeastern Bantu” and “Cameroon/Congo” regions implying Bantu lineage. But the actual balance being determined by geographical location, ethnic background and possibly also recent migrations. Regrettably I do not have any further info on the first result showing 38% “Cameroon/Congo”. However for the breakdown directly above I do have many insightful details which were kindly shared with me by the person who took the test.
She told me that her family’s immediate background is a mixture of Ha and Hangaza. Both ethnic groups being located in western Tanzania, directly bordering Ruanda and Burundi. Her breakdown being particularly reminiscent of the one single Hutu result in my survey from Burundi (see this video). Very interestingly she also mentioned that:
“We also have mixes from Rwanda and Burundi because when Tanzania was divided by the German and English colonisers, they divided up the country and it split up parts of my father’s family. As a result, I have recently realised I have a lot of links to Rwanda based on my father’s (and my) surname. I have spotted many surnames on social media, all from Rwanda and which sound a lot like mine”
***
TANZANIA (1/2 Tanzanian & 1/2 Russian)
***

***
This person is only half Tanzanian and i do not know her ethnic background within Tanzania. Still it’s very illuminating to see this breakdown. Her Russian side is described very accurately by AncestryDNA. As her European amount is nearly 50% we can deduce that most likely the trace amounts of West Asian as well as Asia are inherited by way of her Tanzanian father. And this might hint at a (partial) Swahili background or perhaps also a Cushitic-influenced ethnic group. We can furthermore observe again that indeed also for Tanzanians it seems that “Cameroon/Congo” can show up in significant proportions. Even when as expected “Southeastern Bantu” is primary. Also very interesting to see the 3% “South-Central Hunter-Gatherers” which is most likely an ancient Pygmy component but possibly also related with the intriguing Sandawe people as well as Hadza people of Tanzania. Both of these groups speak a socalled click language and also because of other reasons they are sometimes assumed to be (distantly) connected to the Khoi-San people from Southern Africa. Eventhough it seems that genetically speaking all of these groups are quite distinctive in their own right. For more details see:
- The Sandawe: after the demographic flood
- The Hadza, last of the first
- Hadza portaits by Martin Schoeller (see also this link)
***
KENYA
***

***
Impressive score for “Southeastern Bantu”. Again suggesting a strong genetic similarity to the quite likely Kenyan samples being used by AncestryDNA to determine their estimates. Actually within my survey is also another Kenyan result with a “perfect” 100% “Southeastern Bantu” score. These results being reported for nobody less than Lupita when she was a guest on the Finding Your Roots TV show! Her family being Luo, a Nilotic people, it again confirms the peaking of the “Southeastern Bantu” region around the Lake Victoria area.
Regrettably I do not know the ethnic background for the person behind the testresults above. However the breakdown seems rather similar to the Kikuyu results shown below. Especially in regards with the additional “Africa North” and “Middle East” scores. As already mentioned these components most likely represent ancient admixture from Cushitic speaking populations. Not per se even the ones nowadays living in Kenya but possibly also from the now extinct southern Cushitic groups which are assumed to have been absorbed by Bantu speaking people when they gradually migrated into Kenya, thousands of years ago already. See also this insightful article:
***
KENYA (Kikuyu)
***

***
KENYA (Kikuyu)
***

***
KENYA (Kikuyu)
***

***
KENYA (Kikuyu)
***

***
These results above belong to a person who also made an excellent video sharing her results (regrettably it cannot be seen anymore). As mentioned by herself especially the 11% “Middle East” seems very noticeable. However it might not be that surprising afterall. The Kikuyu have already been featured in several DNA studies and a socalled Cushitic ancestral component has been identified for them. See also the supplement Table S9 of this article (p.105):
Given that AncestryDNA is describing Cushitic speaking Somali as a combination of “Southeastern Bantu” + “Middle East’ + “Africa North”, it is to be expected that the Kikuyu will show the same combination. But of course in diluted proportions. All of this may very well be quite ancient as it seems to be widespread among the Kikuyu. As can be seen from the other Kikuyu results as well. Which also may explain the phenotypical similarity at times noted between Horners and Kikuyu individuals. However this person also mentions a rather recent ancestral connection with Ethiopia on her father’s side. Also she talks about the frequent intermarriages between the Kikuyu and the Maasai. So one generalizing ancestral scenario will not rule out any additional ones from known family history but rather work mutually reinforcing.
***
KENYA (?)
***

***
Notable “Nigeria” score which also shows up above trace level for a few other Kenyan results in my survey. Similar to the Ugandan result posted earlier I am guessing this result is mainly caused by the lack of fitting samples within AncestryDNA’s Reference Panel to describe ancient DNA shared with people living in currentday Chad/northern Nigeria. Although other explanations might also be possible.
KENYA (Kikuyu)
***

***
This breakdown is mostly in line with the other Kikuyu results in my survey. However a very fascinating aspect is the prominent secondary score for “Mali”, no less than 18%! As always the country name labeling should not be taken literally ;-). And as already mentioned AncestryDNA’s Reference Panel may be assumed to be rather inadequate to describe the full range of complex genetic variety found in Northeast Africa. However this finding does seem to suggest some very ancient ancestral connections across the Sahel between West and East Africa. Intriguingly this person also tested with National Geographic Genographic Project to learn about her maternal haplogroup. Which turned out to be L3f. Again indicative of possibly Chadic connections! See also:
KENYA (?)
***

***
KENYA (Taita )
***
***
KENYA (1/2 Taita, 1/4 Kikiyu, 1/4 Kisii)
***

***
The two results shown directly above belong to a mother (fully Taita) and her ethnically mixed daughter. Very illustrative of the variation among Kenyan results. And also indicative of the extent of inter-ethnic unions among Kenyans and Africans in general. Which I am guessing may have increased in more recent generations because of urbanization. But which would have been a common occurrence throughout (pre)- history, due to migrations, cultural assimilation etc..
Very nice as well to see how recombination worked out. Especially in regards to the increased level of “Cameroon/Congo”. But do notice also the most likely Cushitic markers of “Middle East” and “Africa North” as well as considerable “Senegal”. For more details read this insightful discussion I had with the person who kindly provided these results:
KENYA (1/2 Kikuyu, 1/2 Swahili )
***

***
Very illuminating to compare this result with my other Northeast African survey participants, in particular the fully Kikuyu ones. The main distinction in the African breakdown seems to lie in the 42% “Cameroon/Congo”. Which is the second biggest amount in my survey, only a western Tanzanian (Ha & Hangaza) scoring higher (49%). While also a person from Burundi (most likely Hutu) and another Tanzanian scored in a similar range (38%).
However “Cameroon/Congo” is practically not reported at all for Kikuyu! Similar to Horners and Ugandans their group average is around 0%. Therefore this region seems to function as a more genuine (Central African) Bantu proxy than “Southeast Bantu”, at least in this East African context. This might imply that this person’s ethnic background (Kikuyu and Swahili) is not a perfect match to the quite likely Kenyan samples utilized by Ancestry.com. Instead practically half of his ancestry seems to fall more in line with the samples being used for the “Cameroon/Congo” region.
Of course this doesn’t signal any recent origins from those countries per se as it’s first of all a genetic affinity. Again the country name labeling of the AncestryDNA regions shouldn’t be taken too literally 😉 But still it seems quite meaningful that this outcome was obtained. As it seems to indicate some shift to the west for this person’s ancestral background. Possibly dating back to the Bantu expansion from Cameroon/Nigeria several thousands years ago already! But perhaps more likely also to be connected with his Swahili side? The Swahili slave trade routes are known to have reached the deep interior of the Congo and also involved captives from southern countries such as Zambia, and Tanzania which were transported overland to northern Swahili ports.
Intriguingly the 3% “Middle East” might on the one hand represent some ancient affiliation as it is also for Kikuyu as well as Horners. On the other hand it could also be connected with his Swahili side, by way of Arab traders who settled and intermarried on the Swahili coast. In this case it could be pretty recent and deriving from within a genealogical timeframe of about 100/1000 years.
***
KENYA (Swahili/Bajuni)
***

***
KENYA or Tanzania (Swahili)
***

***
Very fascinating to see these two Swahili results featured above. They are naturally only individual breakdowns. The Swahili of course are known for their distinctive history involving trading connections and intermarriage among various people from not only across Eastern & Central Africa but also the Middle East, South Asia and even Southeast Asia. So therefore a much greater variation might be expected. Still very nice to already see these various components clearly reflected. I am not aware of any major genetic study done about the Kenyan or Tanzanian Swahili. But these studies for the related Comorians should be quite relevant:
- The Comoros Show the Earliest Austronesian Gene Flow into the Swahili Corridor (2018)
- Genetic diversity on the Comoros Islands shows early seafaring as major determinant of human biocultural evolution in the Western Indian Ocean (2011)
Just as a reminder one should always distinguish between the language Swahili and the actual Swahili ethnicity. The Swahili language being widely used across East Africa, into Uganda and the eastern half of DRC Congo. But the Swahili as an ethnic group are much more restricted to the coastal areas of East Africa. Sometimes therefore also called the Swahili Coast. See maps and Wikipedia articles below:
- Swahili people (Wikipedia)
- Swahili language (Wikipedia)
- Map of Swahili City states
- Map of Swahili language distribution
***
BURUNDI & RUANDA (Tutsi)
***

***
RUANDA (Tutsi)
***

***
Fascinating to see both quite similar Tutsi results featured above and compare with the one most likely Hutu result from Burundi in my survey (see this video). All results have a primary “Southeastern Bantu” score in common (~60%-70%). But “Cameroon/Congo” is practically absent in the Tutsi results while it is a prominent component for the most likely Hutu result (38%). On the other hand the seemingly Cushitic markers of “Middle East” and “Africa North” are very clearly observable for the Tutsi results but not showing up at all for the Burundi sample. Naturally these are only a few individual results to go by (the Tanzanian Ha/Hangaza results might also be relevant). But I am inclined to think with greater sample size you would see a continuation of these patterns.
Given both colonial history and the very unfortunate events taking place in more recent times of course pointing out this differentiation (in spite of commonalities as well!) can be highly sensitive. Also politically speaking. The origins of the Hutu and Tutsi being a hotly contested issue for many decades already. I fully realize this and would like to reiterate my earlier disclaimer therefore:
“My motivation to research these so-called Ethnicity Estimates is purely scholarly. It stems from a deep fascination with African history as well as its many connections with the Afro-Diaspora. I do not condone the misuse of my research for identity politics! I am in full support of democratizing knowledge. However when parts of my work are being copied I do expect that a proper referral to my blog and the additional context it provides will be made. Please also keep in mind that DNA testing can be very educational and may have many positive effects. However in some cases it may also be abused by people with bad intentions.
From a neutral perspective DNA results from Burundi & Ruanda are however highly interesting and also insightful for understanding wider trends in African (pre)-history and genetics. See these links for more discussion:
- Tutsi probably differ genetically from the Hutu (Razib Khan, 2011)
- Tutsi genetics, ii (Razib Khan 2011)
- Tutsis Are Genetically Very Similar To Masai (Razib Khan 2019)
- Rwandan 23andme results (n=4) prior to 2018/2019 update (Tracing African Roots, 2015) (see also this comment in regards to Maasai similarity)
- Tutsi 23andme updated results (n=6) compared with 1 Hutu and various East African results (Tracing African Roots, 2019 (see also this discussion with a generous contributor of Tutsi results)
***
NORTHEAST AFRICA (Somalia, Ethiopia, Eritrea)
***
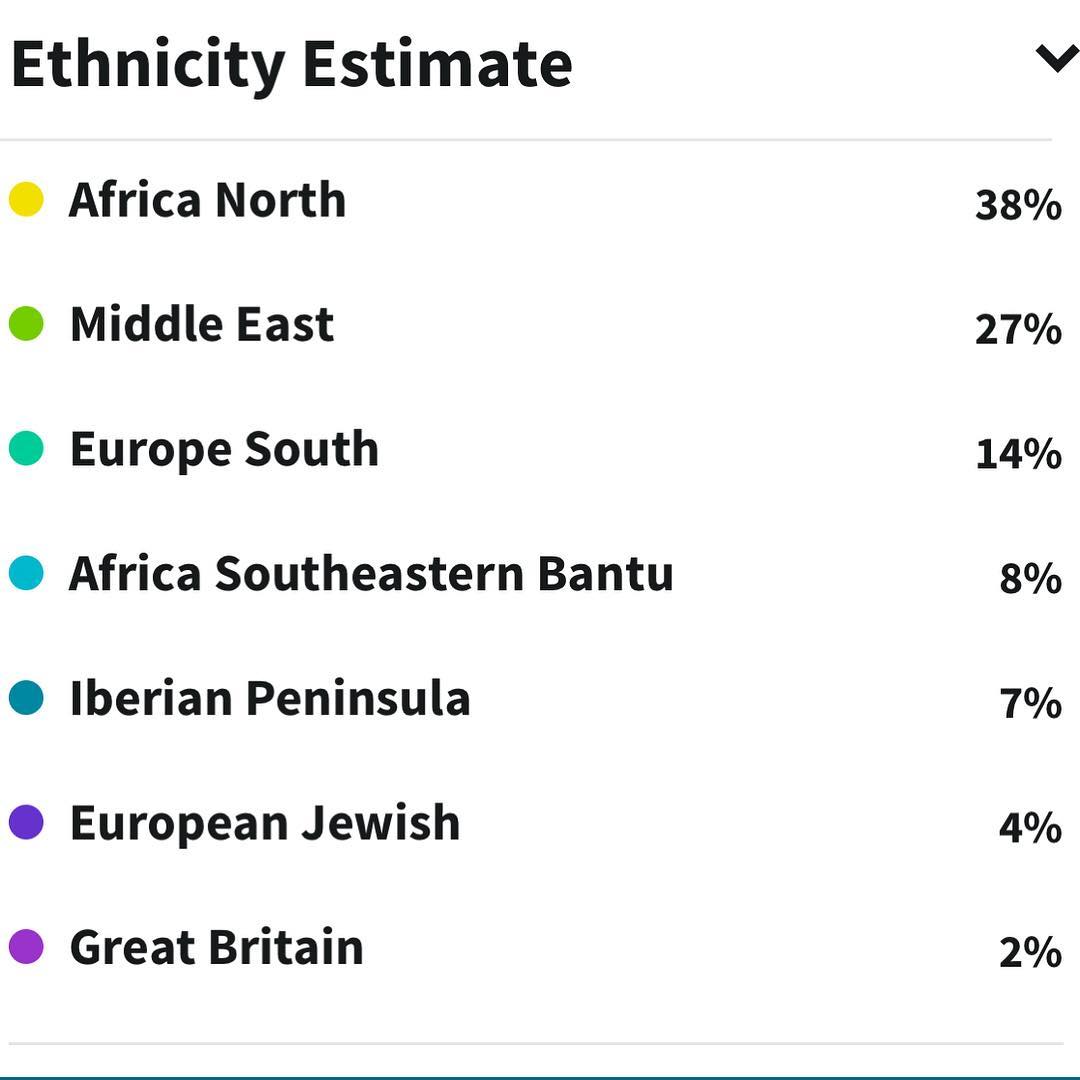
All of these following Northeast African results are basically showing a combination of “Southeastern Bantu” + “Middle East” + “Africa North”. There is no proper Northeast African category yet on Ancestry.com, (unlike on 23andme, see this page). Therefore it is good to realize that the ancestral makeup of Northeast Africans is described by proxies on Ancestry. No doubt “Southeastern Bantu” becomes the default “SSA” category for Horners because “Southeastern Bantu” represents the least genetically distant SSA cluster for Northeast Africans on AncestryDNA. As already explained this is because of an absence of Nilotic and/or Cushitic samples among the reference populations used by AncestryDNA. Generally speaking it won’t refer to actual Bantu ancestry despite the name. Even if in fact this might still be a possibility for a subset of Somalians (the socalled Somali Bantu being a minority group). Otherwise it will just be an artefact of the limited dataset used by AncestryDNA. I believe that the HGDP database was used by Ancestry.com to underpin their “Southeastern Bantu” region.
Unfortunately I am not aware of the ethnic background of the 12 Kenyan samples in the HGDP database, beyond that they are being described as “Bantu NE” (see this overview). My findings of (nearly) 100% “Southeastern Bantu” scores among several East Africans of strictly Nilotic background however already seem to indicate that not only genetic closeness with strictly Bantu speaking people is being measured. Either way it is obvious that the sampling for this region needs to be improved in order to produce “ethnicity estimates” which are better equipped to reflect a person’s most recent ancestry instead of partially also (very) ancient migrations. Even if this information in itself can actually also be valuable (when interpreted correctly).
The Trace Regions being reported are bound to have lower confidence level but might still offer helpful clues as well. Based on its group average for Somali & Ethiopians (2.4% & 2.2%, see chart 2) “Senegal” is likely to be the least distant SSA cluster after “Southeastern Bantu”. Which might hint at very ancient shared origins due to (possibly Nilo-Saharan) population movements across the entire Sahel, unrelated to any Bantu migrations. Also the occasional appearance of the socalled “Hunter Gatherers” region (maximum 4% for an Ethiopian) might possibly be hinting at very ancient Horner connections with the Khoi-San or related people (see this paper from 2012, and this one from 2014.).
For more background information on Northeast African genetics see these insightful blogs:
The following results have been ranked from highest to lowest score for the socalled “Southeastern Bantu” region. Despite some variation actually these results are quite similar. Confirming the generally high degree of homogeneity among modernday Somali despite (very) ancient admixture events.
***
SOMALIA (Somali)

***
SOMALIA (Somali)

***
SOMALIA (Somali)

***
SOMALIA (Somali)

***
SOMALIA (Somali)

***
SOMALIA (Somali)

***
SOMALIA (Somali)

***
SOMALIA (Somali)

***
SOMALIA (Somali)

***
SOMALIA (Somali)
***
Sofar only a few Somali results are showing a third African region above trace level. It seems no coincidence that it should be “Senegal”, as this region also appears frequently as trace region. Aside from some very ancient signal (yet to be determined), i suppose at this increased level it could also possibly be traced back to a modernday connection with the Fula. Although from what i know the Fula are only present in Sudan and Eritrea.
***

***
SOMALIA (Somali)
***

***
SOMALIA (Somali)
***

***
SOMALIA (Somali)
***
***
SOMALIA (Somali)
***
Not shown in the screenshot, but otherwise also 37% “Middle East” and 1% “Pacific Islander” for this person.
***

***
SOMALIA (Somali)
***

***
SOMALIA (Somali)
***
Slightly more “Middle East” than “Southeastern Bantu” in this breakdown. Which sofar is atypical in my survey. But the difference is very small.
***

***
SOMALIA (Somali)
***
Interestingly no minor “Senegal” appearing but “Nigeria & “Mali” instead.
****

***
SOMALIA (Somali)
***
Take note of the Trace Regions, not only the 4% “Mali” but also especially the 3% “South Central Hunter-Gatherers” is very fascinating.
***

***
SOMALIA (Somali?)
***
This person is on the lower range when it comes to “Southeastern Bantu” scores for ethnic Somali within my survey. However intriguingly Asian and Pacific trace amounts are appearing and rather pronounced, even if still minor. This is just speculation on my part but i would say there is a possibility of a (partial) connection to southern Somalia and the population groups living in coastal trading towns, such as the Benadiri. See also further below.
***

***
SOMALIA (Somali)
***
The result below shows the lowest amount for “Southeastern Bantu” sofar, reported for an ethnic Somali. Also it is one of only a few Somali results sofar which has “Middle East” as predominant region within the whole breakdown. It might possibly be due to some recent family connection with Yemen, but also other explanations might be valid. Amazingly the exact same regional scores are being reported for an Eritrean below!
***

***
SOMALIA (Banaadiri/Bravanese)
***
These results belong to a person who is also from Somalia but with a background of mixed ethnic minority descent. Hailing from southern coastal cities which traditionally were characterized by much more cosmopolitan demographics than the homogenous nomadic Somali clans. We can instantly recognize the Indian Ocean connections by looking at the very significant Asian proportion being reported. Socalled Pacific Islander trace amounts are to be counted as Asian DNA, as South Asians and Southeast Asians will typically also show this regions when tested by Ancestry:
Otherwise however his mix is quite similar to what would be reported for an ethnic Somali. However due to Swahili connections the socalled “Southeastern Bantu” amount is perhaps this time including genuine Bantu origins. Also the Middle East component might this time include much more recent Arab ancestry (Omani/Yemeni) than what would be usual for ethnic Somali. For whom generally speaking this component dates back mostly from a much more ancient even prehistorical timeperiod. It would be insightful to know if this person’s DNA matches are also reflecting these more recent connections with both the Arab peninsula and Bantu speaking East Africa. See also:

***
ETHIOPIA
***
As expected these following Ethiopian results are somewhat intermediate in between the Eritrean and Somali results. However Ethiopia as a whole should display a much greater range of genetic diversity. Because it is far more ethnically diverse, comprising over 80 different ethnic groups. Not only a majority of Afro-Asiatic speakers (Amhara, Oromo etc.) who will show close genetic similarity with the previous Somali results. But also Nilo-Saharan speakers who will be more closely related to neighbouring South Sudanese and Ugandans. This group being about a 1/4 of the total population according to some estimates.
- Demographics of Ethiopia (Wikipedia)
***

***
ETHIOPIA (?)
***

***
ETHIOPIA (?)
***

***
ETHIOPIA (Muslim)
***

***
Take note of the Trace Regions, not only the 8% “Senegal” but also the 4% “South Central Hunter-Gatherers” is very fascinating. Possibly indicative of very ancient Cross-Sahelian as well as Khoi-San connections with Northeast Africa (see first entry of Somali results). After Ancestry’s update in 2018 the “Hunter-Gatherer” region is actually being reported in heavily inflated proportions for Northeast Africans. At times even as primary region which clearly does not make sense when Ancestry also introduced a new “Eastern Africa” region! This misleading outcome is most likely caused by the inclusion of Tanzanian Hunter-Gathering samples from either the Hadza or Sandawe populations. See also:
ETHIOPIA (?)
***

***
ETHIOPIA (Tigray)
***

***
ETHIOPIA (Addis Abeba)
***

***
ERITREA
***
I have included two Eritrean results in my survey. On average they show a comparable level of “Southeastern Bantu” and “Middle East” as my Ethiopian survey group. The Eritrean sample size is very minimal though. While greater Ethiopian diversity is most likely not reflected in my Ethiopian sample group.
***

***
SUDAN (Arab?)
***

***
SUDAN (Arab?)
***

***
SUDAN (3/4 Nubian & 1/4 European)
***

***
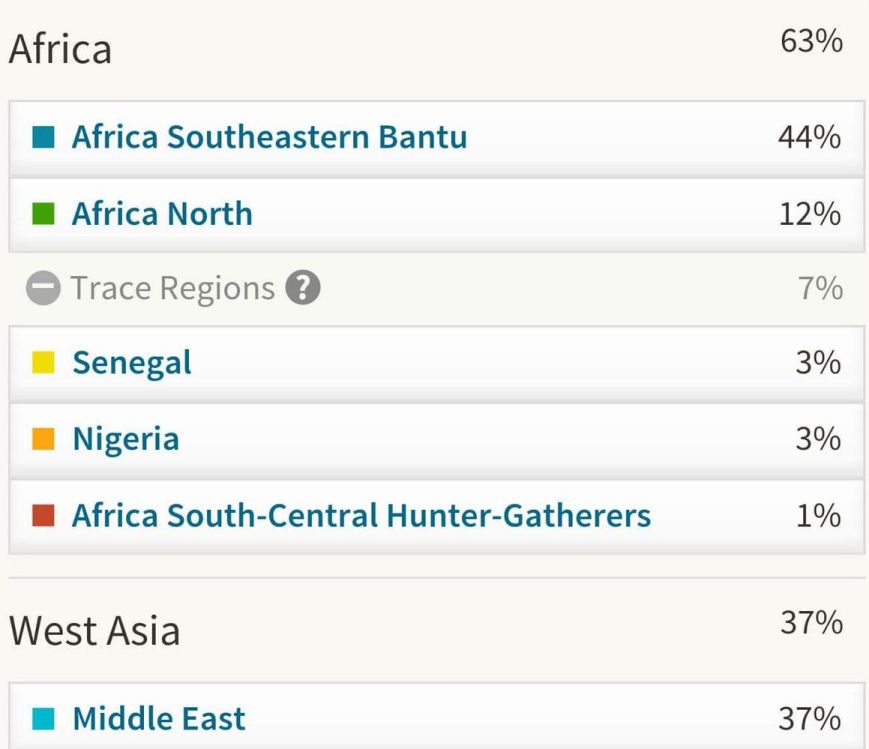
Very useful to see these three Sudanese results. As they sort of form a bridge between my East African survey group and my strictly North African survey group. Given that Sudan is still one of the biggest countries in Africa (even after South-Sudan became independent in 2011), of course much greater variation is to be expected beyond these individual results. Still the patterns on display should also be valid for many other Sudanese. In particular the predominant combination of “Middle East” and “Southeastern Bantu” scores, with somewhat less “Africa North” than among Horners.
But also noteworthy to see quite elevated scores for “Nigeria” and “Senegal”. As mentioned already possibly indicative of very ancient ancestral connections across the Sahel. See also the elevated “Nigeria” scores among one Ugandan and this South Sudanese video result. However for (northern) Sudan in fact more recent ancestral connection with West Africa might also be valid due to the Hadj route to Mecca passing through Sudan. Many West African Muslim pilgrims deciding to settle in Sudan already from the 1800’s or perhaps even earlier. It is known that most of them are either Fula or Hausa from northern Nigeria. See also :
I am only assuming btw that the first two results are Sudanese Arabs, as I have no confirmation. But see also these video results of a confirmed Sudanese Arab. Either way it is essential to be aware of the difference in culturally identifying as Arab and the genetic reality. Due to extensive Arabization, assimilation etc, in the past. The “Middle East” scores might be indicative of both ancient and more recent geneflow from West Asia (also beyond the Arab Peninsula). Therefore not always per se to be traced back to ethnically Arab ancestors. Also interesting in this regard is that 23andme has recently introduced a new “Sudanese” category. It is quite predictive as it is based on actual Sudanese customer samples. However as it is focused on describing one’s ancestry from the last 500 years or so it might be less suitable to make the distinction between underlying West Asian geneflow and preceding Northeast African DNA. See also:
- The genetics of East African populations: a Nilo-Saharan component in the African genetic landscape (2015)
- Sudanese 23andme results (after 2018/2019 update)
______________________________________________________________________________
North African Results
My North African survey group is still rather limited in number but does cover all countries right now. While in particular the Moroccan sample size is quite robust already (n=24). Allowing me to make these perhaps not conclusive but still most likely valid statements:
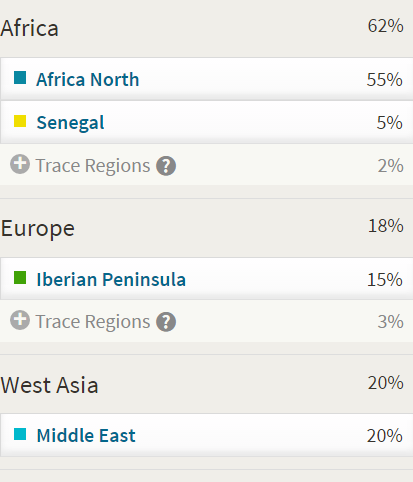
- In clear contradiction to AncestryDNA’s regional description, native North Africans do not show predominant “Africa North” scores, on average. And certainly not 100%! The highest score sofar being “only” 58%. This is most likely to do with the Mozabite samples from AncestryDNA’s reference panel not being fully representative.
- This socalled “Africa North” region should still however be a good indicator of Berber ancestry for North Africans, even when probably not covering all of it. Because as expected it peaks among Maghrebis, and especially Moroccans. While “Africa North” seems to be most subdued among Egyptians.
- The European scores being reported are likely to represent a complex mixture of both recent (within a timespan of 500 years) as well as much more ancient ancestral connections and/or genetic similarities with in particular the Iberian Peninsula but also other parts of the Mediterranean (as measured by socalled “Italy/Greece”). It would be wise to remain cautious or even sceptical about the so-called European scores of North Africans. Unless you have valid family history to back these scores up within a genealogically relevant timeframe (such as Andalusian / Morisco refugee ancestry) .
- This also goes for the socalled “Middle East” amounts being reported. Undoubtedly this region will correlate strongly with genuine Arab or rather West Asian origins. However because the Berbers themselves hail from West Asia originally, it could very well be that also very ancient (pre-Arab conquest) connections might be included in socalled “Middle East” scores as well. Although probably to a minor degree. For Tunisians also Phoenician origins will probably be described (in minor proportion) by this region.
- The prevalence of minor “Senegal” and “Mali” scores as additional African regions for Maghrebi’s is as expected given the well known historical connections between Upper Guinea as well as the Sahel region and especially Morocco. It serves as a confirmation of the predictiveness of these regions. Interestingly the southern Tunisian result shows a more complex breakdown, which however again is in line with the more diverse documented (slave) trade routes for that country. The same goes for the minor “Southeastern Bantu” scores for Egyptians which are also in line with both geography and history. Even when the labeling will be a misnomer and Nilotic speaking origins rather than Bantu speaking ones are far more plausible.
***(click to enlarge)
***
MOROCCO (?)
***

***
MOROCCO (Atlas Berber, Ouarzazate)
***
***
MOROCCO (Riff Berber (Oujda/Figuig) & Arab)
***

***
MOROCCO (?)
***

***
MOROCCO (Riff Berber: Al Hoceima)
***

***
MOROCCO
***

***
MOROCCO
***
***
MOROCCO (Casablanca)

***
MOROCCO
***

***
Interesting but also rather atypical to see “Southeastern Bantu” appear as biggest secondary African region. Reinforced by 2% “Nigeria”. While “Senegal” and “Mali” are quite minimal. For 20/24 Moroccans in my survey it was “Senegal” which was reported as secondary biggest African region (behind “Africa North”). A quite consistent and also historically plausible pattern.
***
MOROCCO (Riff Berber & Northwest: Chaouia)
***

***
MOROCCO (Casablanca)
***

***
Noteworthy “Mali” score, the second-highest in my survey. Three out 24 Moroccans had “Mali” as biggest secondary African region.
***
MOROCCO (Northwest: Chaouia)
***

***
MOROCCO
***

***
MOROCCO (Northwest: Chaouia)
***

***
MOROCCO (Riff Berber (Al Hoceima)
***

***
MOROCCO (Northwest: Doukala)
***

***
MOROCCO (Northwest: Chaouia)
***

***
MOROCCO (1/4 Sahrawi)
***

***
Very nice to see how this person’s partial Sahrawi background seems to align with his clearly elevated overall West African derived lineage (20%). His 15% “Senegal” score is the highest in my Moroccan survey. The Sahrawi people being inhabitants of the most southern part of Morocco as well as the Western Sahara territory which used to be under Spanish rule till 1975. I have also been able to include some Mauritanian results in my survey which will be featured on this page:
- West African AncestryDNA results (part 2)
***
MOROCCO (?)

***
MOROCCO (Kenitra)

***
MOROCCO (1/2 Kenitra? & 1/2 Ashkenazi Jewish?)
This is the most distinctive Moroccan result I have seen sofar. The African breakdown is dominated by the Upper Guinean regions of “Mali” and “Senegal”. A very nice illustration of the primary West African lineages to be found in the Moroccan genepool. Obviously these West African lineages will still be minor compared with North African and other West-Eurasian DNA for most Moroccans. Also interestingly this person appears to be half Jewish. Moroccan Jews used to be a rather large minority, however almost all have migrated to Israel. I have no confirmation however if this person’s Jewish side is indeed Moroccan as well. “European Jewish” being more so an indicator of Ashkenazi Jewish lineage when reported in such high amounts (see this page). The African breakdown should be inherited solely by way of a Moroccan parent though.
***

***
ALGERIA
***
The Algerian results shown below are generally speaking quite similar to the Moroccan results shown above. The African breakdown consisting of mainly “Africa North”. With minor but sizeable chunks of usually either “Senegal” or “Mali”. Also again the “Middle Eastern” and “European” scores being nearly equal. Unless based on confirmed genealogy I would assume these last two scores to mostly reflect ancient migrations of a whole range of different peoples and not any recent family ties with these regions per se.
Again to repeat myself it is counterproductive to get distracted by the country name labeling. Rather consider the AncestryDNA regions to be proxies of ancestral components which have become more frequent in certain places but still show a wide dispersal in neighbouring areas as well due to ancient migrations and inter-ethnic unions occurring probably since the dawn of mankind!
***
ALGERIA (Oran)
***

***
Highest “Africa North” score among my Algerian survey participants. Somewhat lower than the Moroccan group average of 41%. Despite probably a slightly lower degree of Berber lineage among Algerians, on average, still not that far removed. In line with self-identified Berber population shares for both countries I suppose (resp. 3/5 and 1/4 according to this source).
Interesting but also rather atypical to see “Southeastern Bantu” appear as biggest secondary African region. There actually is another result showing an equal amount (which is relatively quite big too!), see below. But for 8/15 Algerians in my survey it was rather “Senegal” which was reported as secondary biggest African region (behind “Africa North”). And for 4/15 persons it was “Mali”. A quite consistent and also historically plausible pattern, comparable to what was obtained for my Moroccan sample group.
***
ALGERIA (Constantine)
***

***
A relatively high “Africa North” score combined with the highest “Senegal” score among my Algerian survey participants.
***
ALGERIA
***

***
ALGERIA
***
***
ALGERIA (Berber? (Tipaza, Tiaret)
***

***
ALGERIA (Berber)
***

***
Again basically a breakdown very similar to the Moroccan ones. Interestingly these results belong to a person who self-identifies as Berber/Amazigh. His other African regions are: 4% “Senegal”; 4% “Benin/Togo; and <1% “Southeastern Bantu”.
***
ALGERIA
***

***
ALGERIA
***

***
ALGERIA
***

***
ALGERIA
***

***
ALGERIA
***

***
ALGERIA
***

***
ALGERIA
***

***
ALGERIA
***

***
ALGERIA (Tlemcen)
***

***
TUNISIA
***

***
Highest “Africa North” score among my 5 Tunisian survey participants. Although quite a small sample size it seems correct that there would be a declining gradient in “Africa North” scores, going from Morocco to Algeria and then Tunisia. Given known Berber self-identification. Otherwise still quite comparable. Although the secondary regions within the African breakdown for Tunisians tend to be more varied than for Moroccans and Algerians. “Nigeria”, “Southeastern Bantu” also showing up prominently aside from “Senegal”.
***
TUNISIA (Tunis)
***

***
TUNISIA
***

***
TUNISIA (Monastir & Gabes)
***

***
These results belong to a person who also made an excellent video sharing her results. It can be seen further below in the video section or by following this link. Tunisia is usually named as the most Arab influenced country within the Maghreb. Especially culturally so. However genetically speaking it might be a different story as these results seem to reflect Tunisia’s long history in all its aspects. Including the Arabization period but also going beyond into the Roman Empire as well as Carthago and the Phoenicians. And ultimately of course the still very noticeable Berber foundation. It is really striking to see how this breakdown ended up in an almost even contribution from the primary influences on how Tunisia evolved into its own mélange so to speak.
The 24% “Africa North” is really not that low when compared with the Moroccan results I have seen (group average 41%, n=24). And it’s indicative that the native bloodlines of Tunisia still live on, at least genetically so. The “Middle East” score no doubt includes ancestral connections resulting from the Arab conquest. However actually it could also (partially and in addition) be traced back to the Phoenicians from Lebanon. The European scores may likewise be hailing from both recent and much more ancient even prehistorical lineages. Especially the “Iberian Peninsula” score is intriguing as Tunisia does have a recorded history of Andalusian Morisco’s settling there after having been exciled from Spain.
The 6% Senegal is minor but also fascinating. The person who did the test was not aware of any black ancestors in her family tree. However this component might very well have been inherited through both parents or even all 4 grandparents. As minor West African admixture is likely to be widespread in the Tunisian genepool. And probably already dating back from at least the peak period of Trans-Saharan trade, around the Middle Ages. Assumptions about the nature of this admixture should be made cautiously as several ancestral scenario’s might be valid at the same time. Not only enslaved West Africans arrived in Tunisia but also traders/travelers of fully or partial West African descent (such as the Tuareg) might have introduced these bloodlines into Tunisia.
***
TUNISIA (southern region)
***

***
This result is very special as it belongs to a person with family origins from the southern parts of Tunisia and representing a minority of fellow Tunisians who are of predominant Sub Saharan African (SSA) backgrounds. Many of them (but not all!) are in some way connected to the history of Trans Saharan slave trade. And therefore can trace back (parts) of their ancestry to places further south of the Sahara. Although in fact this person’s Maghrebi background is clearly showing in the 11% “Africa North” and even more so the 26% “Middle East”. It is these two non-SSA components which make this person’s composition easily distinguishable from Afro-Diasporans in the Americas. As they will usually show minor European, Amerindian or even Asian regions in addition.
However looking only at the SSA part of the breakdown it is remarkable how the wide range of African regions is reminiscent of results of Afro-descendants in the Americas. Eventhough “Nigeria” stands out with about half of the total African amount (37/73=50%), also “Southeastern Bantu” and “Senegal” (to be combined with “Mali”) are very much present. It is tempting to imagine these regions as representing the three major known sources of African captives for North Africa:
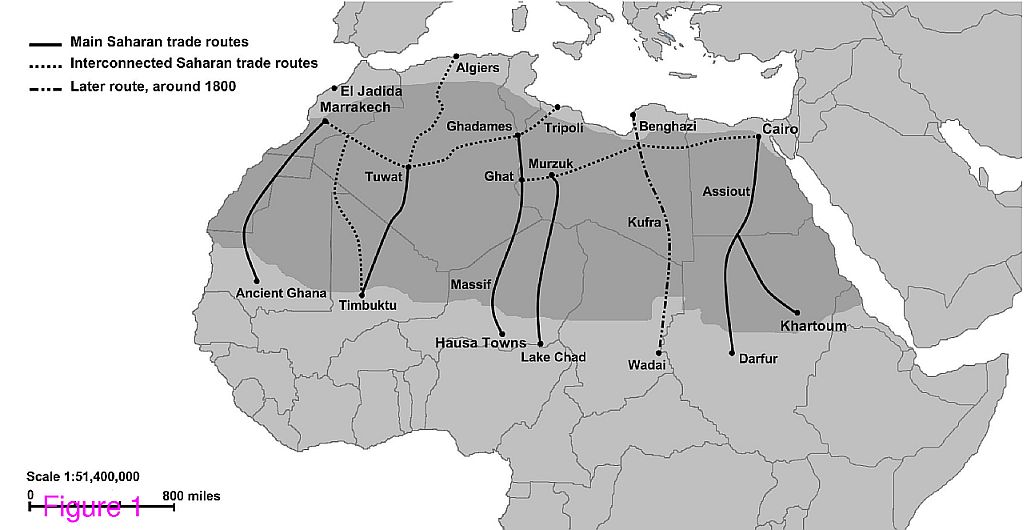
- southern Niger/northern Nigeria, including but not perse limited to Hausa speakers. The fact that “Nigeria” stands out for this Tunisian is perhaps not so surprising as geographically this region would be nearest by when following the route by way of Ghadames, towards the southernmost tip of Tunisia.
- Chad or even Sudan and other countries further east, involving mostly Nilo-Saharan speakers (who don’t have a separate region yet on AncestryDNA and therefore “Southeastern Bantu” acts as a proxy for their DNA markers, see also the Ugandan result posted earlier).
- Senegal/Mali, a.k.a. the western Soudan, both Mandé speakers and Atlantic speakers, incl. the Fula. Probably more common as a source of SSA origins among Algerians and especially Moroccans as can be seen in the results above. But still also for Tunisians apparently.
The purely Sahelian connections being implied seem to be confirmed also by the notable absence of any “Ivory Coast/Ghana”, “Benin/Togo” and “Cameroon/Congo”. These regions more likely to represent coastal origins, which are instead very much present among Afro-Diasporans in the Americas.
For more background info see also:
- Sahel/Interior Maps
- The trans-Saharan slave trade – clues from interpolation analyses and high-resolution characterization of mitochondrial DNA lineages
***(click to enlarge)

***
As a sidenote it is also interesting to mention that this person has taken numerous DNA tests: AncestryDNA, 23andme, DNA Tribes, FTDNA, DNA Land, MacDonald, Ged Match etc.. And his African regional origins were described in quite different proportions by other DNA testing companies. Serving as a warning not to take these percentages, nor the geographical labeling at facevalue! Even when it may be assumed that some of these results will be closer to the truth than others.
- SSA: 62% on AncestryDNA, 66,7% on 23andme; 67,8% on DNA Tribes; 73% on FTDNA
- North Africa (or equivalent categories): 11% on AncestryDNA, 26% on 23andme; 5% on DNA Tribes; 12% on FTDNA
- East Africa (or equivalent categories): 13% on AncestryDNA, 7,9% on 23andme (unphased); 31,2% on DNA Tribes; 29% on FTDNA
***
TUNISIA (Sephardi Jewish?)
***

***
I have no certainty about this person’s entire background but atleast partial Jewish descent was mentioned. Not directly to be verified from the breakdown. Although the rather low “Africa North” amount is noteworthy. However “European Jewish” is much more so an indicator of Ashkenazi Jewish lineage rather than Sephardic or otherwise Middle Eastern Jewish lineage (see this page). Tunisian Jews have a very long and highly interesting history. Especially the ones from the island of Djerba.
***
LIBYA (Northwest (Misrata))
***

***
Although my Libyan survey group is quite minimal (n=6) it seems that a higher “Africa North” level among western Libyans would be in line with expectations. The highest “Africa North” score I have seen among Libyans (37%) is actually pretty decent when compared with the Moroccan group average of 41%. Again testimony of how native North African lineage is still persistent among modernday North Africans, despite extensive Arabization.
LIBYA (Arab)
***

***
Very interesting breakdown of a Libyan of most likely Arab descent. The predominant score of 75% “Middle East” and the rather subdued “Africa North” amount of 13% are very similar to the Egyptian results further below. However the African breakdown is more diverse. Aside from the 4% Mali this person also received 3% Cameroon/Congo, 1% Benin Togo, 1% Senegal, 1% Africa Southeastern Hunter Gatherers and less than 1% Ivory Coast Ghana. Especially the 3% Cameroon/Congo is intriguing as this is the highest score I have seen for this region as reported for North Africans. Libya, like Tunisia, is somewhat in between the Maghreb and Egypt when it comes to Trans-Saharan trading routes (see map above) and therefore perhaps a greater Sub-Saharan African diversity should not be surprising.
EGYPT
Egyptians can be expected to show a great deal of variation, especially going from north to south. Still it is probably telling that the “Middle East ” scores are truly predominating. While the “Africa North” scores are in the same range as those reported for Horners. The minor but still consistent “Southeastern Bantu” scores are as expected and in line with Egypt’s geographical location in Northeast Africa.
***

***
EGYPT
***
Again a combination of “Africa North” and “Southeastern Bantu” scores above tracelevel. Interesting that “Senegal” and “Mali” should be mentioned as Trace regions. It might possibly be hinting at distant family origins directly from the western Sahel or by way of the Maghreb.
***

EGYPT
***
A very striking African breakdown because this time “Southeastern Bantu” is absent while “Mali” is predominant along with the expected “Africa North”. Even more so than the previous result i would say this hints at western Maghrebi connections. The minor yet more pronounced appearance of European Traceregions also would point in that direction. Although to be clear i do not have any knowledge about this person’s background besides being Egyptian. And other ancestral scenario’s might also be valid. For what it’s worth the 72% “Middle East” and the 11% “Africa North” are perfectly in line with the other Egyptian results sofar.
***

***
EGYPT
***

***
EGYPT
***

***
Noteworthy and also a bit ironic to see 8% socalled “European Jewish”. This region actually shows up quite frequently among North Africans and West Asians. But usually in smaller trace amounts. Strictly speaking it only measures genetic similarity to the Jewish samples within AncestryDNA’s reference panel (see this page). In this particular case it might be suggestive of distant Jewish origins from among Egypt’s own Jewish population. Or it may simply just be a case of genetic overlap caused by shared generic Middle Eastern origins.
EGYPT
***

***
EGYPT
***

***
EGYPT (Copt)
Very fascinating to see these two Coptic results from Egypt which are nearly identical. The African breakdown (excl. “Africa North”) is rather minimal, compared with the previous results. It should be pointed out though that Egyptians as a whole as well as the Copts themselves will display much more variation!
***

***
EGYPT (Copt)

______________________________________________________________________________
Youtube Videos
***
TANZANIA
***
***
KENYA (Kikuyu)
***
***
KENYA (Kikuyu)
***
***
SOUTH SUDAN (1/4 Sudanese Arab?)
***
***
SUDAN (Arab)
***
***
SUDAN (Arab)
***
***
SUDAN (Arab)
***
***
1/2 SUDAN (Arab) & 1/2 AFRICAN AMERICAN
***
***
SOMALIA (Somali)
***
***
SOMALIA (Somali)
***
***
SOMALIA (Somali)
***
***
ERITREA & ETHIOPIA
***
***
ETHIOPIA
***
***
ETHIOPIA (Harari)
***
***
TUNISIA
***
***
MOROCCO (Marrakech)
***
***
MOROCCO (starts at 10m:00s)
***
***
MOROCCO
***
***
MOROCCO (1/8 German Ashkenazi)
***
***
LIBYA
***
***
EGYPT
***
***
EGYPT
***
______________________________________________________________________________
Implications for Afro-Diasporans
***(click to enlarge)

Source: http://www.ancestry.com
***Chart 3 (click to enlarge)
HGDP database incl. Namibian samples (“Bantu S.W.”= Southwestern Bantu)

Source: Human Genome Diversity Project (HGDP)
***Chart 4 (click to enlarge)

***Chart 5 (click to enlarge)

Source: Trans-Atlantic Slave Trade Database 2016 (http://www.slavevoyages.org)
***
I will eventually provide a follow up to this page. I will then focus in greater detail on the implications for Afro-Diasporans looking into possible origins from either North or East Africa. Right now I will however already point out the following. Unless guided by wishful thinking or delusional ideology it is advisable to be very mindful of “false positives”. That is DNA results which on first sight seem to suggest North or East African origins to some degree. But on closer and more critical inspection they actually are referring to much widerranging origins, including also West and Central Africa or the Iberian Peninsula. Usually this occurs because of ambigious phrasing or inadequate sampling by DNA companies but it is also caused by incorrect interpretation and having insufficient knowledge about the relevant context as well as inherent limitations of DNA testing.
Various and at times mutually exclusive ancestral scenarios will be implied by AncestryDNA results. All depending on your own family history and especially the population history of the ethnic group you belong to. The socalled “Southeastern Bantu” regional score being reported for an Eritrean will trace back to an entirely different set of ancestors than for let’s say a Jamaican. Also the timeframe implied will be vastly different. For Afro-Diasporans looking to reconnect with their true African origins only a period of atmost 500 years will be relevant. While for Northeast Africans the implied admixture event from the AncestryDNA breakdowns most likely is to be traced back many thousands of years ago!
Afterall also Southwestern Bantu origins, especially from Angola, might be referred to by this socalled “Southeastern Bantu” region. As can be seen in the map above and also the fact that this region is most likely based on Bantu speaking samples from not only Kenya and South Africa but also Namibia, which is a neighbouring country for Angola! This can be verified from the overview of the HGDP database (chart 3) which according to Ancestry’s own information was utilized for their reference panel (see AncestryDNA Regions for sources).
Another strong indication of southwestern rather than southeastern Bantu origins being prevalent for Diasporans (in the Americas) has been established during my ongoing survey among Afro-descended nationalities. In which sofar socalled “Southeastern Bantu” reaches its highest average level among Brazilians followed by the Mexicans. Both countries having an undeniably well attested historical connection with Angola! Furthermore, as can be verified from chart 5, Central Africa, incl. Angola, would be much more significant as a potential place of origin than Southeast Africa for practically all parts of the Americas. While for East African countries further up north (the socalled “Swahili Coast”) barely any documented evidence seems to exist1.. See also these useful map pages:
It is good to keep all of this in mind as the DNA testing science is still in full development and personal DNA-test results will be imperfect and preliminary. Any outcomes seemingly suggestive of East African ancestry among Afro-Diasporeans should therefore be evaluated critically in order to rule out any false positives. See below claims of Kenyan ancestry by an African American politician and how they were received by Kenyans (rather similarly to the claims of Zulu ancestry by Oprah Winfrey):
***
- “Another US president from Kenya? Ben Carson claims Kenyan roots“
- ” My ancestor was a Turkana, says US presidential candidate Ben Carson“
- “Dr. BEN CARSON caught red-handed lying about his Kenyan roots“
- “Go away, you are a political CONMAN” TURKANA elders disown Ben Carson“
***
However this still doesn’t rule out the possibility that in some atypical and individual cases the ancestral connection with East Africa as detected by DNA testing might be genuine afterall. Even if greatly diluted and probably only referring to the hinterland of the socalled Swahili Coast (Kenya, Tanzania and Uganda). For an excellent research on this topic as well as refreshing discussion see:
As a final remark for now i like to mention that obviously it is a completely different story for Afro-Diasporans living in Asia. Due to slave trade routes as well as regular migrations across the Indian Ocean or the Red Sea they in fact do have meaningful and substantial ancestral connections with East Africa. See also this wonderful website:
***(click to enlarge)

Source: www.ancestry.com
***Chart 5 (click to enlarge)


AncestryDNA results for a person of Fula descent
***
Based on DNA results as well as supported by actual historical evidence minor amounts of North African ancestry seem to be somewhat more plausible for Afro-Diasporans in the Americas than East African ancestry (to the north of Mozambique). Although often only trivial amounts are being reported, if at all. And actually it is only Cape Verdeans and Hispanic Americans who tend to get the most noticeable socalled North African scores. As can be seen in the above chart taken from my Diaspora Comparison survey.
Again it is vital to understand that the genetic relationship between the Iberian Peninusula and North Africa is extremely complex and goes far beyond the usual sensationalist Moorish conquest stories. In many cases any “North African” percentage might actually have been inherited from a person who considered himself fully Spanish or Portuguese.
In addition there’s also a second ancestral scenario which involves Sahelian populations, and in particular the Fula, who also carry socalled North African genes in minor proportion. And in this way may have been the direct African ancestor behind any minimal North African score for an Afro-Diasporan. Although generally speaking this Sahelian scenario will most likely be much less relevant than the Iberian scenario. See also:
___________________________________________________________________________
Notes
- Based on the records available in the standard reference database of the Slave Voyages website this East African share in Trans-Atlantic Slave Trade might be less than 0.1% (=6324/6709327). Comparing the total number (6,324) of disembarked captives for Kilwa, Zanzibar and Mombasa, all Swahili ports to the north of Mozambique, with the total number of disembarked captives from Southeast Africa (308,775, overwhelmingly from Mozambican ports with main destination being Brazil) and all of Africa (6,709,327). Naturally all of this is according to what has been documented and excluding voyages with unknown itineraries, obviously the estimates will be higher.
***(click to enlarge)

Source: Trans-Atlantic Slave Trade Database 2016 (http://www.slavevoyages.org)

I’d agree more so with your idea of an uncommon “Nigerian” affinity being found outside of the Ancestry DNA reference populations used for “South-Eastern Bantu”. This seems more likely since the Nigerian affinity is so exclusively substantial without any accompanying traces of Cameroon/Congo/Togo/Benin clusters that we’ve observed with others of Bantu descent. The lack of these aforementioned typical Bantu clusters in contrast to the detection of a Senegalese affinity, might sway in favour of a northern sahelian connection.
Perhaps there shouldn’t be surprise of contrasting Nilotic-Ugandan results, here’s a Ugandan ethnographic map which might be foretelling of the diversity and variations to be found in the results of other future Ugandan participants.
Regarding the surprisingly higher than average Hunter Gatherer %, I think this affinity might be related to the presence of Eastern Hunter Gatherers like the Benet more so than one of a Pygmy Hunter Gatherer(*it would do DNA companies justice to have separate clusters for these different HG affinities). The Benet can be found in North-eastern Uganda and apparently have been considered a marginalized population; I found a paper regarding their displacement from ancestral forests being chopped down. I wouldn’t doubt the range of these forest borders were continuously encroached for centuries since Bantu and later Nilotic migrations first arrived in Uganda. I didn’t know pockets of EHGs still existed in Uganda, let alone that we had indigenous resettlement issues akin to native communities in the Americas.
Moreover, seeing as you mentioned the person’s family being recent refugees, the North would be a natural choice given the LRA uprisals within the ethnic Acholi/Luo areas.
Thanks again for all your hard work on the blog, it’s been a great source of research for me.
LikeLiked by 1 person
Thanks a lot for taking the time to write down your thoughtful comment! I am truly glad that my blog can be useful and also be instrumental in piquing people’s interest to do their own additional research. I had never heard about the Benet people before! Very fascinating.
LikeLike
Hi Ben,
You might be interested to know that i have added two Sudanese results in the video section. Intriguingly the South Sudanese breakdown has yet again a hefty socalled “Nigeria” score of 21%, as well as some minimal but still detectable 3% “Senegal”. But like you mentioned for the Ugandan she likewise doesn’t score any additional “Benin/Togo” or “Cameroon/Congo” amounts, Which makes any genuine Nigerian affinity unlikely (as their DNA, atleast for southerners, is usually described as a combination of these two regions + “Nigeria”, see Nigerian AncestryDNA results). I am inclined to think this outcome is rather reflecting some sort of Chadic pull but only additional sampling from this area might clarify.
In contrast the Sudanese Arab does not seem to score any “Nigeria” with the mislabeled “Southeastern Bantu” being predominant on her African side as well as some secondary “Africa North”. In fact it looks like a Horner breakdown. The South Sudanese also has some minor Middle East + Africa North btw, but i am not sure if this represents a widelyspread ancestral element for the South Sudanese in general or rather that it is to be traced back to one particular recent ancestor in her familytree (she mentions a grandfather).
LikeLike
My ancestry: First of all my ancestors were somali from the somali region of Ethiopia. My results:
42% South eastern bantu
38% Middle eastern
12% North African
1% Melanesian
LikeLiked by 1 person
Thank you for sharing! Your results are perfectly in line with the groupaverages i have calculated for 18 ethnic Somali sofar. See also chart 2
LikeLike
Hi,
To add to your Kenyan DNA results:
I’m kikuyu with all four grand parents ancestry known as kikuyu.
My Ancestry.com DNA results are as follows:
Africa Southeastern Bantu 75%
Middle-east 14%
Senegal 5%
Africa North 4%
Nigeria 2%
These results confirm those you have posted above.
Great work!
LikeLiked by 1 person
Thanks a lot Wangari! I have added your breakdown into my spreadsheet (right now it’s in row 142)
African AncestryDNA Results
Your results indeed fall right in line with the group averages sofar. I have 11 Kenyans right now. Most of them being Kikuyu like yourself. The combination of about 70-75% socalled “Southeastern Bantu” with about 15-20% West Asia and Africa North and 5-10% West African trace regions being quite consistent. The reasons for this being so have to do with the formation of the Kikuyu as an ethnic group, which can go back many hundreds if not thousands of years.
As soon as i get more results in from other Kenyan ethnic groups the Kenyan group averages might very well change though. I have recently also added the results of Lupita, by way of a reliable source i learnt that she scores 100% “Southeastern Bantu”! Which is very insightful given that she is Luo. And the Luo are of course a Nilotic people and not a Bantu speaking people. Which illustrates yet again how the labeling of these ancestral regions should not be taken too literally. It’s still useful to know though. Because just like the first Ugandan result (also with Nilotic background) i posted on this page it seems that the Luo are also a very close match to the samples Ancestry uses in their reference panel to calculate any socalled “Southeastern Bantu” score by comparing your own DNA to their dataset.
LikeLike
Hi,
I just found your website and I really enjoy seeing other results. I’m Kenyan (2 grandparents are Taita , 1 grandparent is Kikuyu and 1 grandparent is Kisii) and I took an AncestryDNA test in 2016. Here are my results:
ETHNICITY ESTIMATE:
57% Africa Southeastern Bantu
14% Cameroon/Congo
7% North Africa
7% Middle East
Low Confidence:
6% Senegal
4% Nigeria
3% Mali
2% Africa South-Central Hunter Gatherers
LikeLiked by 1 person
Hi Ashley, thank you for sharing your results! Very interesting given your background! Sofar most of my Kenyan samples have been Kikuyu, and your breakdown does look similar to theirs, broadly speaking. However especially the 14% socalled “Cameroon/Congo” is striking. It is the second highest such score i have seen among 12 Kenyan results. The highest score (42%) belonging to a person of mostly Swahili descent. The group average for Kikuyu however only being 0,4%.
As i argue on this blog continiously the country name labeling of AncestryDNA’s regions is not to be taken too literally but it can still be insightful if just considered as a proxy of something in your DNA which is uncommon among my Kikuyu samples sofar. It’s intriguing to speculate which side of your family may have contributed to this score. I must confess i only have ” Wikipedia knowledge” in this regard 😉 but it seems to me that your Taita side could be a likely candidate. I am reading that they originally migrated from further south in Tanzania?
The wikipedia article on the Kisii is also very fascinating. Again i have not verified any of its content by further reading so please correct me if i’m making any wrong statements! However these quotes below seem very enlighting, given that your 7% North Africa & 7% Middle East is about equal to what you might expect for a person of fully Kikuyu descent. but you are only 1/4 Kikuyu so *possibly* some of these genetic components were also inherited by way of your other grandparents. This is merely speculation on my part though as my survey is still very limited in number and recombination can often be quirky!
“The Kisii ended up in a geographical location unique among Bantu speaking groups in that they were surrounded on all sides by initially, and later sporadically hostile Nilotic communities of the Luo, Kipsigis, Nandi, and Maasai.”
“There’s strong evidence, however, that periods of peace with neighbouring communities must have led to intermarriages and consequent consanguinity. This is evident in the greatly varied complexion and physique between Abagusii from different subregions of Gusii. Some clans of the Suba (Abasoba in ekegusii) are said to have been completely absorbed by the Luos(Abagere in ekegusii). “
LikeLike
Hi FonteFelipe,
Thank you for replying to my comment! Yes, I have not seen many Kenyan results that have a strong Cameroon/Congo percentage as well. Actually, my mother (who is fully Taita) took the ancestry results shortly after me with ancestryDNA. Her results are:
ETHNICITY ESTIMATE
Africa 91%
-Africa Southeastern Bantu 57%
-Cameroon/Congo 22%
-Senegal 6%
Low Confidence:
-Africa North 3%
-Africa South-Central Hunter-Gatherers 1%
-Benin/Togo < 1%
-Mali < 1%
West Asia 9%
-Middle East 9%
She has a higher percentage of Cameroon/Congo than I do. Possibly this can be attributed to her tribe? The Taita tribe are on the border between Kenya and Tanzania and are near the coast of Kenya, near the Swahili tribes like you mentioned. Also, her 3% North Africa percentage leads me to believe that my father also carries it as well.
Hopefully, my father can also take the test so we can also see his results 🙂
LikeLiked by 1 person
Wonderful! Thanks a lot for sharing these results as well! This is very illustrative of the variation among Kenyan results. But also very nice to see how recombination worked out. As indeed it seems you got (most of?) your “Cameroon/Congo” by way of your mother. Which probably is in line with her ethnic background. I have just now added a new Tanzanian result whose family is from near the border with Ruanda/Burundi. And this breakdown shows an even higher “Cameroon/Congo” score of 49%.
Intriguing also to see the 3% “Africa North” and especially the 9% “Middle East”. I was already assuming that these ancestral components in your own breakdown were inherited through more than just 1 grandparent (besides your Kikuyu one). But i was expecting that your Kisii grandparent might have contributed most. But it seems your Taita side is also having this type of DNA. It will be very interesting indeed to see your father’s results! Please feel free to share them over here as i would love to include them in my ongoing survey.
LikeLike
Can some one tell me why and how we have middle eastern dna? Cause last I check kikuyus resisted Arab slave traders and they would not even dare come in our land but yet we have there blood. Plus tell me how.
LikeLiked by 1 person
Hello Daniel, as described on this page the labeling of ancestral regions in DNA testing is not always to be taken too literally. Furthermore you should keep in mind that the implied timeframe will sometimes be going back much farther back in time than you might assume at first.
In regards to the socalled “Middle East” as well as “Africa North” scores being reported for Northeast Africans, generally speaking this is to be traced back thousands of years rather than hundreds years ago! Unless your family history tells you otherwise, any meaningful Arab geneflow from the last 5 centuries or so will be unlikely therefore. I suppose that given the time that has passed already these ancestral components can arguably be considered “native” to local genepools even. But this is all relative and a matter of perspective.
Several DNA studies have described these more appropriately labeled West-Eurasian ancestral components among Africans already. More research is needed but for Kenyans these socalled “Middle East and “Africa North” scores most likely represent ancient admixture from Cushitic speaking populations. Not per se even the ones nowadays living in Kenya but possibly also from the now extinct southern Cushitic groups which are assumed to have been absorbed by Bantu speaking people when they gradually migrated into Kenya, thousands of years ago already. See also this insightful article:
South Cushitic Admixture in Southeast Africa
http://anthromadness.blogspot.com/2015/05/south-cushitic-admixture-in-southeast.html
LikeLike
Thank you for your help just one question though. How come Horn Africans and Kenyans have cushion and middle eastern ancestry while Ugandans and Tanzanian do not? And I would
Not be surprised if my ancestry had a mix cause my mother is kikuyu and told me one of her ancestors had mixed features and curly hair, can’t wait till I do my test.
LikeLike
It correlates with ethnic background. My survey is still quite limited so it doesn’t cover all of the ethnic diversity to be found in those countries.
LikeLike
FonteFelipe , I apologize for coming on here and asking about things that might already be obvious or that you have already explained, but do you have any idea why Sudanese people sometimes get a little Indian and European dna as well? It might be only under 23andme. I will try to find the video I saw where a Sudanese lady got those odd results but there were two people commenting underneath her video who said they got the same. Sounds like it might be a recurring pattern but it doesn’t make much sense. The Indian and European usually add to 5 % about I think. Thanks! Oh and do 23andme and ancestry have public databases for their average findings? Thanks!
LikeLiked by 1 person
Hi Courtney,
No problem! That’s a legit question. Was this before or after 23andme’s 2018/219 update? As you may know 23andme introduced a new “Sudanese” category, which from my experience is quite predictive. I would only take into account such updated results as the previous version might contain misleading estimates due to a lack of Sudanese reference samples. You can see updated Sudanese 23andme results on this page:
https://tracingafricanroots.com/north-east-africa/
I have not seen any such distinctive Indian or European scores for Sudanese myself. At least not amounts of around 5% as you mention. With trace amounts of around 1% you do run the risk that you are merely looking at some misleading “noise” admixture. An inevitable outcome of DNA testing not being a 100% perfect science but rather providing estimates on a best-effort basis. As I said in an earlier blog post of mine about such minimal trace %’s:
LikeLike
That’s a great question! I have performed extensive surveys in the past as I found such information to be essential for greater understanding. As regrettably neither Ancestry or 23andme does offer such detailed information. At least not for all nationalities I have been surveying. However at times they do publish papers or blog posts on their websites where they reveal some of their average findings based on their customer databases. For a general idea it is also always recommendable to look into their so-called “white papers” and see how they describe the predictive accuracy of each regional category. If you do a search for it in their FAQ sections or within your results you should find it.
LikeLike
It appears that they have changed a few things. For east and horn Africans it no longer says “middle east” instead “Ethiopia and Eritrea”.
LikeLike
True, this page was first published on 20 November 2016 and it is based on the original AncestryDNA version current during 2013-2018. In Ancestry’s latest 2019 update the new regions of “Ethiopia & Eritrea” and “Somalia” were introduced. Also a category called “Eastern Bantu” has been created. See blog post below for my assessment how this worked out for a few Northeast Africans I am sharing profiles with:
https://tracingafricanroots.wordpress.com/2019/11/27/ancestrys-2019-update-back-on-track-again/
LikeLike
Dear Sir,
I find your work not only excellent and most helpful, it is also ‘fortuitous’ for those of us searching for our past. It is very commendable and thoughtful of you to have started your blog.
As a Kikuyu from Kenya living in Namibia I am naturally curious about the exact Y-Haplogroups to which the Kikuyu belong. Especially the Cushitic, Bantu, Nilotic and West African haplogroups which dominate Kikuyu male genetics.
I would appreciate it if you would let me know what they are if you have them available.
Warm Regards
Mwangi C wa Kamau
LikeLiked by 1 person
Hello Mwangi,
Thank you so much for your very kind comment. I truly appreciate your readership, all the way from Namibia even!
To be frank my knowledge on haplogroups is rather limited. Because I focus mostly on autosomal/regional admixture, as reported by personal DNA testing companies such as Ancestry and 23andme. I do however have a separate section on my blog for it:
https://tracingafricanroots.wordpress.com/dna-studies/haplogroups-africa/
Unfortunately I am not aware of any recent studies being done on Y-Haplogroups for Kenyans. Aside from this study from 2011:
Y-chromosomal variation in Sub-Saharan Africa: insights into the history of Niger-Congo groups
In case you are interested in reading more in-depth discussions about East African genetics I would recommend the Anthrogenica forum which has several members who are quite well-read in this subject. Including Kenyans and Ugandans. See for example this thread:
PCA G25_scaled – Africans only (Users & Ancients/Modern Avgs)
LikeLike