
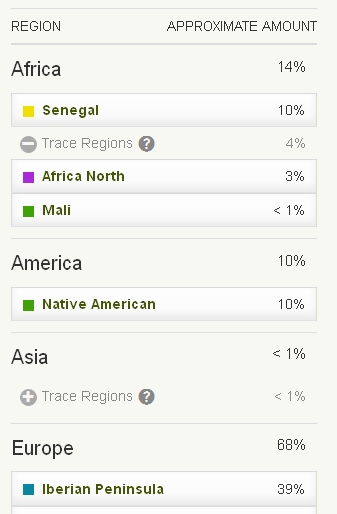
On this page i will attempt to provide some analysis for the Dominican AncestryDNA results which have kindly been shared with me. If you want to skip the discussion just scroll to the bottom of the page to see a selection of Dominican Ethnicity Estimates. I will restrict myself to the African part of their results as it’s in line with the theme of this blog. However i have also calculated some statistics for their Native American scores (see first screenshot). In order to enable easy comparison i have scaled the African breakdown to 100% for all, leaving aside any non-African admixture. For more details on my research methodology see the front page of this AncestryDNA section. Follow the link below for an overview of all the Dominican results (see columns N, O, P, Q for additional info on Amerindian, North African & West Asian %’s plus regional origins within the Dominican Republic):
Spreadsheet with Dominican results
As far as i was able to verify all of these Dominican results are from persons who are either born themselves in the Dominican Republic or have two Dominican-born parents. These are obviously first of all individual results reflecting unique family trees. Furthermore DNA testing at this stage cannot be expected to be 100% accurate in estimating regional origins from within Africa. See this page for more disclaimers, especially on how the country name labeling of the AncestryDNA regions should not always be taken at face value. Even when limited in number the samplesize (n=68) of my spreadsheet is larger than the ones from published DNA studies, Moreno-Estrada et al. (2013) has 34 Dominicans for example while Montinaro et al. (2015) has only 27. There might however be a regional bias towards results from the socalled Cibao area, in the north of the Dominican Republic. Out of 41 persons who stated their regional origins within the Dominican Republic or which i was able to verify myself 30 were from the Cibao while 7 others had partial origins from the Cibao. Only 4 persons stated their origins as being solely from the eastern or southern part of the Dominican Republic.
Undoubtedly with more Dominican testresults available you might also see additional or different patterns. Still i think the screenshots i will post in the last section of this page might be representative to a large degree for how many other Dominicans would score hypothetically speaking and particularly from the Cibao. I will now proceed with discussing the main patterns i’m able to pick up on from the data. Of course merely expressing my personal opinions & thoughts and not meant to be conclusive in any way.
***
UPDATE
This article was first published on 24 Oct. 2015, when I had only 68 Dominican AncestryDNA results available for my analysis. As my survey has been ongoing I eventually managed to collect a sample group comprising of 161 Dominican AncestryDNA results in 2018. In 2020 I also published my survey findings based on 100 Dominican 23andme results.
Follow these links below for more recent analysis of Dominican genetics. Including preliminary substructure results based on making a distinction for the total level of African admixture being either greater or lower than 50%. And also making a regional distinction for results from Cibao, Este and Sur regions. Furthermore I also provide evenhanded comparison with other Afro-descended populations in the Americas.
- Update: Afro-Diasporan AncestryDNA Survey (part 1) (2018)
- Update: Afro-Diasporan AncestryDNA Survey (part 2) (2018)
- Dominican 23andme results (2020)
p.s. keep in mind that AncestryDNA’s ethnicity estimates have been updated several times now! On this page I am dealing exclusively with AncestryDNA version 2 which was current between September 2013 and September 2018. All matters being discussed on this page are therefore not pertaining to updated results (2018 and onwards). See this page for an overview of all the updates Ancestry has performed in the last couple of years.
_____________________________________________________________________________
1) Summary of Findings
***(click to enlarge)

***(click to enlarge)

***
When reviewing the statistics i calculated above based on the data entered in the spreadsheet, it’s good to be aware that averages tend to hide underlying variation. That’s why it’s always advisable to also take into account other measures such as the median and also the minimum & maximum values to get a sense of the range of the scores.
The first chart is based on “unscaled” data, that is the original percentages provided by AncestryDNA while the second one is based on regional ratio’s of total African ancestry which together add up to 100%.
***(click to enlarge)

***
This third chart features an additional macro-regional breakdown into “Upper Guinea”, “Lower Guinea” and “Central Africa” which is of my own making. In order to get a strictly “SSA” comparison i have excluded the region “North Africa” and corrected the other averages accordingly. Making this distinction is admittedly arbitrary and can only produce a rough proxy, given the limitations of AncestryDNA. Still I find it useful because you get to see some tendencies more clearly and it conforms with what’s common in slave trade literature. For ethnolinguistical and historical maps from these 3 main regions of provenance see: Upper Guinea, Lower Guinea, Central Africa.
_____________________________
Observations
• The overall impression is of wideranging diversity in surprisingly balanced proportions. With only “Senegal” standing out somewhat, based on its median especially. Implying it might be the most consistent region even when certainly not always the largest one. Most of the regional statistics are quite close in fact, with almost all of the “SSA” regions having averages in between 10-20%. Also the frequency of number 1 spots is telling a story of unpredictable heterogeneity. It seems to be indicating that Dominicans could be among the most evenly mixed Afro-descendants in the Americas (see also Afro-Diaspora AncestryDNA results: A Comparison). Despite having a low average degree of total African ancestry still most results show almost all of the nine African AncestryDNA regions, even if usually also designated as Trace regions.
• Combining the average scores for “Senegal” with “Mali” this AncestryDNA analysis seems to provide convincing confirmation of the Upper Guinean founder effect for Dominicans. Basically a disproportionate genetic legacy of the first Africans to arrive in Hispaniola, whose regional origins are known to have been overwhelmingly from Senegambia, Guinea Bissau/Conakry and Sierra Leone. See also Documented African Roots of Dominicans. This outcome has been obtained in other studies as well, however not before to such extent. This is probably due to the additional “Mali” region on AncestryDNA. See also:
- Reconstructing the Population Genetic History of the Caribbean (Moreno-Estrada et al., 2013)
- Unravelling the hidden ancestry of American admixed populations. (Montinaro et al. (2015)
• The “Nigeria”, “Benin/Togo” and “Ivory Coast/Ghana” regions are all well represented in Dominican results. To be combined as “Lower Guinea” it’s the biggest source of African origins for my samplegroup. Even if below 50% of the total and with “Upper Guinea” and “Central Africa” also having sizeable shares. The ethnic origins being implied by these 3 Lower Guinean regions are likely to be shared with people across the Americas, incl. the Anglo-Caribbean, Franco-Caribbean and the USA. Which indicates a great deal of overlap in African origins and it might be only the proportions which will be more distinct for each nationality.
• The ancestral contribution from Central Africa is also solidly present but a bit subdued, compared with the other regions. And also perhaps less prominent based on what you might expect going by cultural retention. The region “Cameroon/Congo” has a lower average than “Nigeria” for example and also it gets reported less frequently as number 1 main region. However the median score for “Cameroon/Congo” (12,1%) is second only to “Senegal” (15,6%) suggesting it’s widely spread and a rather consistent ancestral component among my sample results. “Southeastern Bantu” might in particular point to origins from Angola, dating mostly from the early 1600’s. It’s remarkable that sofar it’s only showing up in higher amounts for people with lower than average total African ancestry (<35%). It seems to suggest an additional founding effect reinforced perhaps by relative endogamy along social/regional/racial lines. Only a larger samplesize might confirm this however. The “South Central Hunter Gatherer” scores are only at trace level but it might be meaningful still that the average sofar for Dominicans is noticeably higher than for most other Afro-descendants.
• The noticeable “North African” scores for Dominicans are in line with other Hispanic results i’ve seen (see Afro-Diaspora AncestryDNA results: A Comparison). It seems to be negatively correlated with total African ancestry. Meaning that people of minor African descent will usually score highest for it. As i am scaling everyone’s African breakdown to 100% the “North African” proportions might appear inflated for people with little African ancestry otherwise. Based on the original percentages as provided by AncestryDNA, the average “North African” score would rather be 2,6% (see first screenshot above). For most people i imagine it might originate either from the Canaries (¡Guanches!) or indirectly via Spain, possibly a Morisco legacy or perhaps even dating from prehistorical times. In addition to these main ancestral scenarios a West African explanation (by way of the Sahel region) could still also be possible i suppose in individual cases. Especially when supported by additional clues. See also section 4 of this page for more detailed discussion.
_________________________________________________________________________
2) “Senegal”+ “Mali” = Upper Guinean founder effect?
***
Upper Guinean origins of free black campesinos in 1606
Red arrows are indicating persons from Guinean Bissau origin, “Bran”, “Biafara” and Sierra Leone ,”Cape”.
***(click to enlarge)

Source: “THE AFRO-PORTUGUESE MARITIME WORLD AND THE FOUNDATIONS OF SPANISH CARIBBEAN SOCIETY, 1570-1640“, (D. Wheat 2009).
***
Upper Guinean origins circa 1547-1606
Red stars are indicating ethnic groups from Upper Guinea.
***(click to enlarge)

Source: “La esclavitud del negro en Santo Domingo: (1492-1844)” (Deive, 1980).
***
Dominican population circa 1606 & 1681
Keep in mind these are just rough estimates for a subset of the population within and nearby official Spanish settlements. Also racial classification would have been dependent on local perception.
***(click to enlarge)

Source: “General History of the Caribbean. Volume IV: The Long Nineteenth Century: Nineteenth Century Transformations”, (ed. K.O. Laurence, 2011).
***
Dominican AncestryDNA averages in comparison with others
***(click to enlarge)

***
____________________
“In addition, more than 30% of the total slaves arriving in mainland Spanish America up to the 1630s came from Senegambia, and we accordingly find that the relative contribution from the Mandenka is higher in all areas historically under the Spanish rule.“(Montinaro et al., 2015, p.4)
____________________
One of the most intriguing results of my AncestryDNA survey for me personally has been the seemingly resounding confirmation of what might be called a founding effect from the earliest victims of Trans Atlantic Slave Trade (1500’s). A clear majority of these persons arrived in the Hispanic Americas from the Upper Guinea region, often by way of Cape Verde. It is astonishing to find out that the genetic legacy of these African pioneering co-builders of Hispanic colonial societies is still highly detectable and persistent. It seems to be a testimony to their survival skills and also their early integration in colonial populations. We can verify this by reviewing the last chart above. The combined average scores of “Senegal” and “Mali” are significantly higher for all Hispanic nationalities when compared with African Americans and West Indians. This goes especially for “Senegal” which peaks for my Cape Verdean samples, corroborating its ultimate Upper Guinean origins. A similar finding was also reported by:
- Reconstructing the Population Genetic History of the Caribbean (Moreno-Estrada et al., 2013)
- Unravelling the hidden ancestry of American admixed populations. (Montinaro et al. (2015)
Lest i be misconstrued let me repeat that overall the AncestryDNA results for Dominicans suggest a very high and proportionally balanced degree of diversity in African origins! Even while showing a considerable share of Upper Guinean origins other regions are also significant for Dominicans. As i am of Cape Verdean descent myself i have naturally been fascinated to discover the various historical connections and parallels existing between Cape Verde and the Dominican Republic. But obviously they are both unique countries to be placed in their own context. From my perspective and also supported by the genetic data it is apparent that the Dominican Republic is primarily a triracially mixed Hispanic country. With an African composition that is practically the same as the one for Puerto Rico when considering its regional distribution (see chart above). Aside from Puerto Rico it’s first of all also other Hispanic countries which will resemble the Dominican Republic in its particular mix of African origins. Still many of the ethnic origins being implied by especially the “Senegal” region will be shared in between Cape Verde and the Dominican Republic. And at times also prominently so by Dominican individuals with a higher degree of total African ancestry (see first 2 screenshots in last section below). Which might perhaps be rather uniquely so within the wider Hispanic context.
Interestingly the widespread preservation of Upper Guinean lineages in Dominicans seems very similar to the survival of their Amerindian genes. As it might be correlated to the same dynamics of early ethnogenesis and a common initial genepool which gave rise to the formation of currentday Dominicans. Ethnic/racial elements present at the very start of colonial society are known to have engaged in a great deal of intermixing which resulted in a growing segment of locally born and racially hybrid Dominicans. Through this proces the genes of the people who were absorbed were at the same times also preserved and spread around as the Dominican population slowly grew bigger. Eventhough not the subject of my research it’s still noteworthy that each Dominican result in my spreadsheet showed some degree of Amerindian ancestry. The range going from 4% to 12%. With an average of 7%, the genealogical equivalent of having one single Native American great-great grandparent. Even when in reality of course these genes date back from a much earlier timeperiod and were inherited on all lines by constant “recycling”. This recombination model might have operated in pretty much the same way for early Upper Guinean DNA markers.
Not many specifics have been recorded about the early ethnogenesis of Dominicans taking place outside of the (biased) view of Spanish authorities in Santo Domingo. Still it is known that the rural interior attracted both runaway and manumitted Africans as well as socially marginalized people of already mixed African background. They would most likely continue to mix in with a developing rural population carrying a strong additional Taino and European/Canarian imprint (aside from various Dominican historians see also insightful works by Lynne Guitar and David Wheat). It is therefore all the more valuable that surviving historical records are suggesting not only a predominance of Upper Guinean captives in the 1500’s but also a remarkable early presence of free black farmers of Upper Guinean origin (see first two charts above). It is often underestimated that free black people, many of Upper Guinean origin, played a significant role in the formation of early Hispanic populations. Due to widespread miscegenation, marronage and manumission the share of free people of (partial) African descent was a majority from at least the late 1600’s in the Dominican Republic (see third chart above). Which might imply that when exploring their African roots Dominicans must trace back many more generations on average than most other Afro-descendants (see also From African to Creole).
The Upper Guinean roots of Dominicans are not known in exact full detail or proportion however many valuable indications have been historically documented. See for example:
- Documented African Roots of Dominicans
- Hispanic Americas
- Shared Upper Guinean roots between Cape Verdeans and Latin Americans
- Cape Verdean AncestryDNA results (sections 2 & 3)
The country name labeling of the AncestryDNA regions should not distract from the very real possibility that especially origins from Guinea Bissau and Sierra Leone might be signalled by “Senegal” and “Mali”. As can be seen in the above charts and also to be verified from the links above the socalled “Bram” (= modernday Papel) and Biafara (a.k.a. Biafada) from Guinea Bissau and the “Zape” from Sierra Leone seem to have been very numerous. Of course there might be various other explanations for scoring high “Senegal” or “Mali” %’s on AncestryDNA. Genuine origins from especially Senegal (Wolof and Ladino’s) and in a later timeperiod also from Mali (“Bambara”) have also been historically documented. Also Upper Guinean lineages can still be traced to any given point of time within the entire slave trade period, that is up till the late 1700’s in individual cases (see screenshot of Ramon Bautista Pular in next section). But given that the greater majority of Dominican population was racially mixed and no longer enslaved in the 1700’s i suppose statistically the odds will be much greater for Upper Guinean roots to be dating from the 1500’s/1600’s.
______________________________________________________________________________
3) Ghana/Benin/Nigeria origins greater than Congo/Angola?
***
(click to enlarge)

***
(click to enlarge)

Source: “Reconstructing the Population Genetic History of the Caribbean”, (Moreno-Estrada et al., 2013).
***
Rare example of African-born Domincans in the early 1800’s
Ramon Bautista Pular, seems to have been a Fula while his wife would have been from southeastern Nigeria, likely Igbo or Efik, judging from their last names: “Pular” and “Carabali”.
***(click to enlarge)

Source: Familysearch.org
____________________
“We find that populations from the insular Caribbean are best modeled as mixtures absorbing two independent waves of African migrants. Assuming a 30-year generation time, the estimated average of 15 generations ago for the first pulse (circa 1550) agrees with the introduction of African slaves soon after European contact in the New World” [..]
“the second (and stronger) pulse of African tracts according to our model(e.g., 7 generations ago in Dominicans),pointing to the late 18th century.” (Moreno-Estrada et al., 2013, p.13)
“In the eighteenth century, the variety of African ethnic groups identified in the earlier period disappeared. This may be due to a general streamlining of the administrative process that reduced the available identifiers for this category to more common or generic ones. In the baptismal and marital registers the most utilized ones were definitely regional in nature, such as Congo, Angola, and Guinea. Identification by ethnic grouping was recorded less often but the most recurrent ones were Carabali (Hispanicized of Calabar), Mandinga and Mina.” (Rivas, 2008, p.253)
“It is likely that for 150 years after 1640, three out of four Africans arriving in the Spanish Americas left from the coast between Elmina in Ghana and the Cross River in Nigeria.”(Borucki et al, 2015, p.446)
“La ley segunda del capitulo primero del Codigo Negro Carolino de 1784 cita entre los esclavos existentes en la Espanola a los Minas y Carabalies y dice que son los mas numerosos“ (Deive, 1980, p.234)
____________________
This section is just meant to briefly mention some possible explanations for one of my main findings that sofar the average “Benin/Togo”, “Ghana/Ivory Coast” and “Nigeria” scores for Dominicans seem to be higher than those from “Cameroon/Congo” and “Southeastern Bantu”. Given cultural retention (Palo music) and slave trade statistics from the Slave Voyages Database you might have expected it to be otherwise. Much more detailed discussion as well as complete references for citations can be found in Documented African Roots of Dominicans. One of the main conclusions in that blogpost being that the documented slave trade records for the Dominican Republic are highly incomplete, especially because of widespread contraband trade with the English, Dutch and French. It is therefore misleading to only go by those records if you want to get an approximate understanding of how significant each African region of provenance might possible have been for the Dominican genepool.
As confirmed also by DNA studies (Moreno-Estrada et al., 2013, see chart and quote above) it seems that the Dominican Republic received a major second geneflow from Africa especially around the late 1700’s when its economy was finally recovering somewhat after more than a century of stagnation. This in addition to the primary waves of mostly Upper Guinean captives in the 1500’s and Angolan ones in the early 1600’s. The documentary evidence for the Dominican Republic is not plentiful but judging from whatever has been recorded (see quotes above) it seems that origins from Nigeria (“Carabali”) and Ghana/Benin (“Mina”) might indeed have been predominant in later timeperiods. Which would be in line with the results i’ve collected sofar.
It’s probably too premature to make any further assessment. However the following factor might also partially account for the somewhat subdued Central African presence in the Dominican results i’ve collected. My samplegroup is likely to be very strongly reflecting the African origins of the Cibao region especially. Due to possibly different contraband tendencies (more so from Curacao perhaps in the south?) it could be that in other regions (Sur, Sureste) of the Dominican Republic we might see different patterns.
______________________________________________________________________________
4) Dominican Results
As far as has been confirmed to me all of these screenshots below are from persons who were themselves born in the Dominican Republic or else had two Dominican-born parents. Meant to illustrate the individual variation among Dominicans in the first place. Despite the limited samplesize these results should already be quite representative, especially for people from the Cibao area. I like to thank again all the persons who kindly agreed to share their results with me!
For more information on what type of ethnic origins could possibly be implied by these regional breakdowns, see also Documented African Roots of Dominicans or this overview of ethnic groups mentioned in documentation across Latin America.
High Senegal
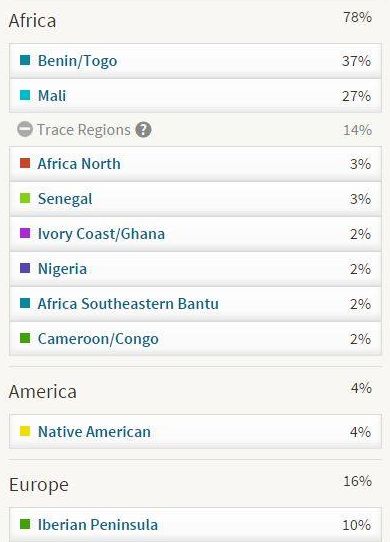
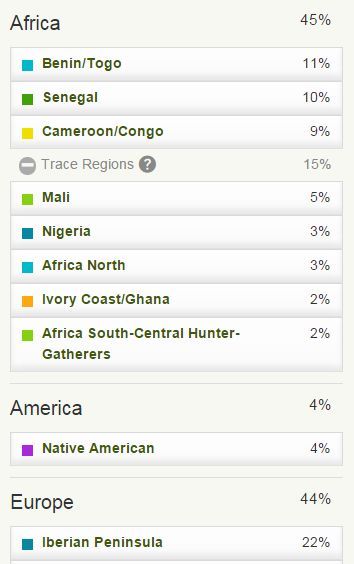
Unlike what i’ve observed for Puerto Rican results the “Senegal” region is also appearing regularly as number 1 region for Dominicans of close to 50% total African ancestry. In some cases it might possibly indicate additional Upper Guinean origins from later timeperiods (1700’s). But otherwise it will be a remarkable testimony of the preservation of the earliest African component in the Dominican Republic. The first two results show some of the highest “Senegal” ratio’s i’ve observed. In between 40-50% of total African ancestry (20/50 & 18/39) it’s pretty close to the average “Senegal” ratio for Cape Verdeans which is about 60%. Still it’s apparent other regions are also showing up with significant percentages.
***

***

***
Notice also the relatively high “North African” %.
***

***
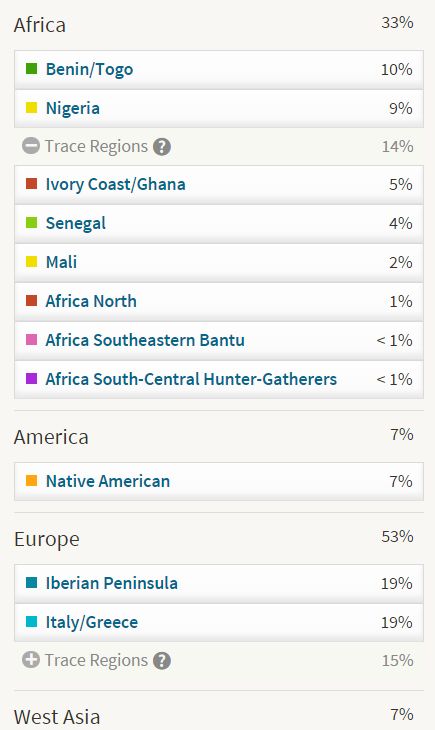
Also an above average amount of Native American being shown, in fact the highest Amerindian % i have observed myself among Dominicans was 12%.
.***

***
A rather evenly split top 4 being shown in this breakdown.
***

***

***
This result looks very similar to many Puerto Rican results i’ve seen. That is a minor degree of total African ancestry which is mostly showing up as a “Senegal” score. It seems likely that a very early Upper Guinean lineage is being detected. Which got preserved due to relative endogamy after initial dilution.
***
***
Same scenario as above might apply for these next two results but it is reinforced by the relatively high “Southeastern Bantu”, which possibly indicates Angolan ancestry from the 1600’s.
***
 ***
***

***
Combining “Senegal” with “Mali” this person’s African breakdown is practically 2/3 (20/30) Upper Guinean.
***

***

***

***
High Mali
***
“Mali” is more difficult to interpret than “Senegal” (see AncestryDNA Regions). But it’s noteworthy that just like i’ve observed for Puerto Rican results, high “Mali scores appear for people of both relatively high and low degrees of total African ancestry.
***

***
The highest relative “Mali” contributions i have seen sofar (15/31=48%) but also just as an amount it is among the highest scores among my Dominican sample group. Another exceptional aspect of this breakdown is the 9% “Middle East”.
***

***
Very distinct breakdown, combining “Mali” with “Senegal” this person’s African origins would be about half Upper Guinean.
***

***
Another distinct compostion with about half of it traceable to Upper Guinea, if you add in the 7% ” Senegal”, but even more so characterised by a high “Mali” score . Also the 6% “North Africa” is very notable.
***

***
Also notable Jewish % being shown.
***

***
A rather uncommon combination of top 2 main regions being shown because of the 11% “Southeastern Bantu”. Adding the 7% “Senegal” to the 13% “Mali” this person’s African origins are practically 50% Upper Guinean.
***

***

***
Perhaps no coincidence that for these people with lower degrees of total African ancestry “Southeastern Bantu” is appearing as second biggest region. Their Amerindian scores are also among the highest, indicating early colonial roots.
***

***

***
High “Ivory Coast/Ghana”
***
Aside from Ghana & Ivory Coast this region also potentially covers ancestry from Liberia and parts of Sierra Leone (see African Results). Very high relative ratio shown for the first result, 21/33=63% of total African ancestry.
***

***

***

***

***

***

***
For a great blogpost detailing the family origins of this person and her siblings & uncle see:

***

***
High “Benin/Togo”
***
Perhaps only by coincidence but this region has appeared prominently for the two results who also show the highest degree of total African ancestry. Especially the first result has a very high “Benin/Togo” ratio of about 62% of total African ancestry (43/69). The second result also shows a remarkable “Mali” score. In both cases the “Native American” scores are noteworthy as well, it’s highlighting that no matter the degree of African ancestry all Dominicans in my samplegroup have Amerindian ancestry too.
***

***
***

***
Next two results looking rather similar with “Senegal” in second place and “Cameroon/Congo” ranked third.
***

***
***

***

***
***

***

***
High “Nigeria”
***
This region also appears prominently for people of higher than average African descent. Which might imply relatively more recent origins for these lineages. However it’s also regularly showing up for people of minor African descent.
***

***
The highest “Nigerian” score i have observed sofar among Dominicans. The North African score is also very noticeable.
***

***

***

***
Notice also the relatively high “North African” and “South Central Hunter-Gatherers” which might indicate that the “Cameroon/Congo” percentage is more so Congolese than Biafran.
***

***
This result showed the second highest relative “Nigeria” score sofar , as a ratio of total African it’s 65% (19/29). Interestingly there is a connection to the socalled Samana Americans, also known as Cococlos. Who are the descendants of African Americans who migrated to the Dominican Republic in the 1800’s. Possibly it might account for the extra high level of “Nigeria” although in fact other Dominicans can also score high “Nigeria” levels as seen above.
For more details read also this very interesting blogpost by the person behind these results:
Getting To Know Myself Through DNA Testing
***

***

***

***

***

***

***
One of the lowest amounts of total African amounts but also the highest relative “Nigerian” contribution (13/18=72%).

***
High “Cameroon/Congo”
***
Might be just a coincidence but sofar i haven’t really observed expectionally high ratio’s for this region. The maxium score being just below 40% of total African ancestry, while for the other regions i have seen maximum scores of above 60% of total African ancestry.
***

***

***

***

***

***
High “Southeastern Bantu”
***
This region is quite likely to be picking up on Angolan origins from the early 1600’s in particular. Even when other ancestral options are also still possible. It’s remarkable how sofar only people of relatively minor African descent (<35%) show the highest scores for this region. It seems to suggest an additional founding effect reinforced perhaps by relative endogamy. Only a larger samplesize might confirm this however.
Notice also how relatively high “Senegal” scores are reported as well for the first two results. It’s quite a striking combination as these two regions are on opposite ends of the African continent.
***

***

***

***

***
This result below is a bit atypical in that it’s only showing one single Trace region. Most Dominican results showing nearly all African regions in their breakdown.
***

***
High “North Africa”
***
This is the only result to show “North Africa” as number 1 region and it’s also the highest absolute score for this category. It happens more regularly with other Hispanic results i’ve seen, but these results tend to show a much lower total African percentage. Curiously this person still has a good amount of African ancestry, but her “North African” just happens to be predominant. It’s likely to be Canarian at such an elevated level but other options also still remain possible.
***

***
YouTube Results
***
Interesting discussion of both 23andme and AncestryDNA results (starts @14m:25s)
***
***
***
***
***
***
***
***
***
***
***
***
***
***
***
***
***
***
***

Nice to see all these Dominicans results. Thanks for sharing my video. I also saw my dna results here. Interesting to see such nice information without bias or racial attack on Dominicans.
I appreciate your time..
LikeLiked by 1 person
Thanks a lot for your comment Danny! Also thanks for making that video! I completely agree with what you said about each country having its own experience and history when it comes to self-identification. And i fully respect that! I think your own results – with Senegal being the biggest African region and Native American being 11% – are very illustrative for one of the main patterns i’ve described on this page. Which is a founding effect of early colonial ancestry (1500’s):on the African side from Senegambia & Guinea Bissau/Conakry combined with a preservation of native Taino lineage, all blended in with Spanish bloodlines as well. I suppose it’s a testimony of a very long established presence of your family in the DR, which makes you very Dominican indeed! Although of course on some family lines you might have ancestors who arrived in later time periods as well.
LikeLike
Hey, interesting research. I’m Dominican as well. Feel free to share my video:
😉
LikeLiked by 1 person
Thanks for letting me know! I have added your video plus i also entered your results into my research spreadsheet.
Overall your results are perfectly in line with the variation i have seen with 125 Dominican AncestryDNA results right now. However there are a couple of standout aspects about your breakdown. Keep in mind that i am comparing you with group averages but Dominicans are very much a mixed people so diversity is to be expected 😉
1) your total amount of African (19%) is the second lowest i have seen up till now, the group average being around 39% and most people (88/125) scoring inbetween 25% and 50% African.
2) your Native American score (14%) is the highest amount i have observed among my survey group. The group average being about 7% and each single Dominican result which i have seen in its entirety had at least 2% Native American. Which goes to show the widespread, practically universal, preservation of Amerindian lineage among Dominicans (even if diluted).
3) proportionally speaking your biggest African region Mali is almost 50% of your African DNA (9/19), this is among the 5 highest relative Mali contributions i have seen for 125 Dominicans. So this means your African lineage is strongly Upper Guinean derived , especially when you combine with the 3% Senegal. Such a Upper Guinean flavoured profile can actually be detected among many other Dominicans, even if not always to this pronounced degree. This socalled Upper Guinean founding effect was one of my main research findings which i describe in greater detail in section 2 of this page.
Also putting your above average 14% Native American score into the equation it all seems to indicate that many of your family origins in the DR might go back to the very earliest settlement period (1500’s).
About your European breakdown i believe that your 21% socalled “Italy/Greece” as well the 4% socalled Ireland” and 1% socalled “Great Britain” could very well still be DNA which you inherited by way of Spanish ancestors. You have to understand that when a Spanish person takes an AncestryDNA test he will not receive a 100% “Iberian Peninsula” result. Rather his breakdown will be composed of several European regions. Which mostly reflect very ancient migrations and shared ancestry across Southern and Western Europe (going back thousands of years). Unless you have concrete evidence of non-Spanish lineage i would not take the regional labeling of these estimates too literally. Socalled “Italy/Greece” for most Hispanics and Iberians merely seems to describe a generic Mediterranean ancestral component. Possibly in part due to the Romans but likely also predating the Roman Empire. Socalled “Ireland” and “Great Britain” will in most cases be a genetic legacy of Celtic migrations or even pre- Celtic presence in Spain.
LikeLike
This research is not empirically reviewed. People don’t even know how to read the reliability of the research and also see if that reliability has been empirically reviewed and published in a good journal. This has not been. Lo siento.
LikeLike
My research has indeed not been published in a journal nor has it been peer-reviewed. In it self this does not say anything about the quality of my research a priori. Throughout my blog i clearly outline any relevant limitations which should be kept in mind when reading my posts. The history, motivation and research goals of my AncestryDNA survey are described in greater detail on this page:
AncestryDNA Survey
I have also explicitly stated on this very page that my survey findings are in no way presented as conclusive or fully representative. Constructive criticism is always welcome (when done in a respectful manner). But anyone who seeks to judge the merits of my research should atleast first carefully read these disclaimers…
In fact my AncestryDNA survey is very much based on empirical data, all of which can easily be verified in my online spreadsheet:
Link to online spreadsheet with Dominican results
On this page i feature the screenshots of nearly all the Dominican results which are also appearing in that spreadsheet. They are the underlying basis for the group statistics i discuss on this page. Therefore my data-entry & calculations can be counterchecked by anyone who feels the need to do so. In addition the more than a dozen Youtube videos by self-identified Dominicans independently corroborate the main variation i describe on this page.
I will eventually provide a follow-up as my survey has been ongoing. I can already say that many of the findings i have presented on this page still remain valid even with increased sample size (right now n=142). However additional patterns seem to arise as well.
This survey may be deemed a mere layman’s effort however my findings are not out of line with any of the published papers on Dominican genetics i have read sofar. And unike many published studies (which are often restricted in scope) i do make an extra effort to provide as much detail and context as possible. In order to avoid oversummarization and also highlight individual variation whenever i can. Recently the admixture proportions of 779 Dominican AncestryDNA samples have been published in the supplement (p.38 and onwards) of a very interesting paper by a researchteam of Ancestry.com:
Clustering of 770,000 genomes reveals post-colonial population structure of North America
Unfortunately the 6 West African regions (“Senegal”, “Mali”, “Ivory Coast/Ghana”, “Benin/Togo”, “Nigeria”, “Cameroon/Congo”) were combined into just one single category. Which doesn’t allow for the kind of finegrained analysis i have been attempting to pursue on this page. Also regrettably bar charts were chosen to depict the admixture proportions instead of providing the complete statistics, as done on this page.
LikeLike
Yep, I agree Fontefelipe. Your research is in line with nearly every peer-reviewed study that I’ve seen, and in fact, your study actually lends MORE credit to the more organic claims of Taino culture in the region
LikeLiked by 1 person
I Felipe this is Elliott again, I have a question. Is it common that people throughout the diaspora to be closely related? I have noticed i have a substantial amount of people mainly from Puerto Rico and Dominican Republic as DNA matches, and the CM of my matches range from 9cm-30cm. Where most range from 21-26.9 cm. Mind you, There is no record of any of my family members living in the Caribbean nor having relatives there. I ask relatives from my father side, where these matches are connected to, and they are clueless. Question, what you think is the possible scenario or your hypothesis?
LikeLiked by 1 person
Hi Elliot, interesting question! Yes people from the Diaspora may be related in several ways. Firstly of course due to common shared African ancestors. Although actually also shared European and even shared Native American or Asian lineage might be possible. And furthermore also due to later migrations between various parts of the Afro-Diaspora. These migrations can sometimes be rather surprising. For example everyone knows substantial numbers of West Indians have been settling in the US for several generations already. But actually during some periods in the 1800’s also African Americans settled in parts of the West Indies, such as the Bahamas, Trinidad, Haiti and also the Dominican Republic. See this link for the DR:
https://en.wikipedia.org/wiki/Saman%C3%A1_Americans.
So even if these Puerto Rican and Dominican matches of yours happen to be “100%” from their respective countries it may still be that the geneflow is reversed. And your MRCA could actually be African American! As another scenario you could for example also have a West Indian ancestor in common, for Puerto Rico especially Virgin Islanders might be likely. And again also Dominican Republic has absorbed some West Indian migrants, sometimes known as Cocolo’s:
https://en.wikipedia.org/wiki/Cocolo
If you happen to have a very recent connection to the Hispanic Caribbean (from within the last 4 generations or so) you are very likely to get assigned to either the Puerto Rican, Dominican or Cuban migrations aka genetic communities on Ancestry. If you only got a migration associated with your African American background then I suppose it’s more likely that these matches are caused by some connection which is to be traced back further in time.
My advise would be to contact some of these closer Hispanic matches to find out more details. Also by first scanning and then sorting on ethnic region you might zoom into even more Hispanic matches (see step 4 of this tutorial and apply appropriate text filters like “EuropeIb” = “Iberian Peninsula” and “America” = “Native American”)
https://tracingafricanroots.wordpress.com/2017/05/10/how-to-find-those-elusive-african-dna-matches-on-ancestry-com/
LikeLike
Hello I am dominican and these are my results, I’m quite confused about some genetic stuff that I’ve got : Mainly the east african dna ,because most of the slaves taken to the americas were from west Africa, so how is it possible? Also I have doubts about the north and west Europe, cause Dominican republic was conquered by the Spaniards so how did come up? Btw I heard that My heritage is not realiable but I upload my raw dna data to Dna land and I hope you can help me to interpret my results
LikeLiked by 1 person
Hi Juan, I have not done any detailed analysis of My Heritage. But basically you will need to learn more about their African sample database as well as how each African region they have in place is defined by these samples. After all your admixture results are a reflection of how your own DNA compares with these samples according to MyHeritage’s algorithm. It is not meant to be a conclusive report on your true ancestry!
Frankly I am not a big fan of the admixture analysis performed by both My Heritage and DNA Land as I find them lacking in informational value when compared with both AncestryDNA and 23andme. Their West African resolution is quite limited and therefore often not consistent across the board or in line with what we know from history. For example that socalled East African score you mentioned on My Heritage is very likely to be overstated and just based on genetic similarity with Bantu people across Central and Southern Africa. If they had Angolan or Congolese samples in place this socalled East African score might very well not have appeared.
LikeLike
Hello, these are my Dominican dna results from ancestry
Here the breakdown :
36% Cameroon Congo and southern bantu peoples
20% Benin and Togo
12% Mali
8 % Portugal
5% Spain
4% Ivory coast and Ghana
3% Nigeria
3% England Wales and northwestern Europe
2% Native American Andean
2% Basque
1% Senegal
1% France
1% Sweden
1% Baltic states
1% Native American North, South and Central
I’m pretty happy with my results except from the cameroon congo and southern bantu peoples because I think is quite general and pretty vague, it includes a lot of countries, besides that I have encountered some surprises that might be noise but they are part of my dna which are Sweden and the baltic states, how did these regions show up, from where have I inherited that dna? And also I don’t know why but I knew that I would have some British in me, I dont know if this means that I had a British ancestor or if it was inherited randomly, I suppose my ancestor was mainly Portuguese, because I have 8% from Portugal, I hope that you could help me cause maybe I’m misinterpreting my results
LikeLiked by 1 person
I forgot to say also that is quite strange that I don’t have any migrations or genetic communities, if you could explain that to me I would be very grateful
LikeLiked by 1 person
Hi Juan, thanks for sharing your very interesting results! Don’t get too attached to these “estimates” though. Ancestry is about to roll out a new update this year and perhaps even already this month. So your results are likely to change! Perhaps even drastically so. Even when the basic elements should stay about the same.
Although you would expect any update to bring major improvement this is unfortunately not always the case… I have blogged about the last update Ancestry did last year in September 2018. You might want to read it to see why your “Nigeria” is so low for example.
https://tracingafricanroots.wordpress.com/2018/09/22/did-ancestry-kill-their-african-breakdown-part-1/
Also check out my view on DNA testing in general + FAQ’s over here:
https://tracingafricanroots.wordpress.com/2018/10/10/did-ancestry-kill-their-african-breakdown-part-3/
About the missing genetic community. From what I ‘ve seen this does not happen often with Dominicans indeed. But perhaps it is to do with your family background. Which parts of the DR are they from? It might be that your matching strength with your Dominican DNA matches (which is the basis for getting assigned to a “migration”) is not sufficient. Perhaps because not that many people of the particular region your family is from have tested with Ancestry. Then again it might also just be a mistake on Ancestry’s part. Doesn’t happen often, but I have seen it as well with for example Cape Verdeans.
In case you’re looking for more detailed information about your “Cameroon, Congo, South Bantu” score and also the “Portugal” score it might be very helpful to have a systematic look into your DNA matches. I can do a full scan of your DNA matches on Ancestry to see if you have any African DNA matches as well as Portuguese DNA matches which I can filter out. Furthermore I will provide you with an analysis of how it corresponds with your regional results. See this page for my African DNA Matches Service:
https://tracingafricanroots.com/african-dna-matches/
Btw whenever you have your 23andme results in I would love to hear about!
LikeLike
Hello, thanks for your reply, I can’t tell you where my family in the Dominican Republic came from because I was adopted at a very early age but based on my matches and their family trees my relatives more likely came from the southern part of the Dominican Republic, Neyba, Villa Jaragua and so on, yeah someone told me that ancestry is updated very regularly the results and they might change drastically so let’s see what happens, I have matches from people in Africa as well but most of my matches are from the Dominican Republic
LikeLiked by 1 person
I’d add that the I’ve seen for a lot of hispanic people with the current update a conflation of Spain and Portugal. It might simply be that they are so close, but a lot of hispanic/Latino people who more accurately had Spain or the Iberian Peninsula, before, are now showing significant and outsized “Portugal” scores. It’d be unusual, for instance, for someone from the DR to have Portuguese scores that match or surpass their Spanish score, and most shouldn’t have any Portugese scores at all. Portugal had some very specific/narrow areas – particularly later – that they settled in the New World, so all over these people in places settled by the Spainards showing “Portugal” is likely a false positive.
LikeLike
I agree with your overall comment as after all Portuguese & Spanish DNA is very similar and therefore not always easy to distinguish. Quite likely genetic similarity with Galicians and southern Spain is now mostly being picked up by “Portugal”.
The “Portugal” region has however been quite predictive for Cape Verdeans and Brazilians. Also I would say that genuine Portuguese lineage (to some degree) is still plausible for some Latin American countries because of both colonial (1500’s/1600’s) and post-colonial migrations (Venezuela!). Keep in mind that Portugal & Spain used to be a unified empire from 1580-1640 because of the so-called Iberian Union. But also previously and afterwards Portuguese settlers may have come to live in Spanish ruled Latin American colonies. Also incl. Sephardi/Converso Jews.
I actually have a Dominican friend who is adamant about “Portugal” being genuine for a great extent for Dominicans. I have not researched this myself. But apparently especially in the Cibao and also noticeable in local dialect. This would go back to early colonial history (1500’s/1600’s). And in fact I myself have come across historical documentation of Portuguese settlers in the DR during that period. At times actually also moving there by way of Cape Verde!
LikeLike
It would be very interesting if you are able to check the Mitochondrial Dna and the Paternal Dna of Dominicans as well even though I know is not exactly an easy task. Thanks in advance for your excellent job.
LikeLiked by 1 person
Thanks for your comment! I am not aware of any recent studies done on Dominican haplogroups. Most research nowadays seems focused on autosomal analysis instead. However I do know about some references being made in older studies which I have reviewed in the past. You might find it useful:
The Origins of the African Ancestry in the Puerto Rican Population According to Restriction Analysis of the Mitochondrial DNA (Viero-Vera, 2006)
The African Diaspora: Mitochondrial DNA and the Atlantic Slave Trade (Salas et al., 2004)
LikeLike
Perhaps you’ve already came across this paper, but in case you haven’t, D’Atanasio et al. just published this: “Y haplogroup diversity of the Dominican Republic: reconstructing the effect of the European colonisation and the trans-Atlantic slave trades”
https://academic.oup.com/gbe/advance-article/doi/10.1093/gbe/evaa176/5896526
Highlights from the paper:
182 males were sampled from 3 locations in the Dominican Republic: Santo Domingo (N = 50), San Juan de la Maguana (N = 76) and Las Galeras (N = 56).
The Dominican Y haplogroup composition was characterised by an excess of northern African/European lineages (59%), followed by the African clades (38%), while the Native-American lineages were rare (3%).
(83%) of the African lineages observed in Santo Domingo have a central African ancestry, suggesting that most of the slaves were deported from regions.
Maternal lineages show a high proportion of Native-American (30-60%) or African (20-40%) haplogroups, while the European lineages are less frequent (~ 10%).
It seems that the Upper Guinean founder effect that you found, which was also corroborated by other studies, may have been retained principally via autosomal DNA and mtDNA lineages (Fig. Page 30). E-Z15939 (equivalent to E-CTS9883) would be the main Y lineage of the Senegambian region (30-50%) among western Africans and Fulbe people, according to D’Atanasio et al. Its epicenter is in Senegambia, with some NW African offshoot branches. The authors concluded that this lineage isn’t commonly found in Dominican groups.
For more info, figure 2 is a compilation (data from the literature) of Y haplogroup distribution of main haplogroups in the Greater Antilles.
LikeLiked by 1 person
Thanks! I was not aware of this paper yet. This is by the same Italian team which also published several papers on Fula genetics right?
It is certainly surprising that this particular study based solely on Y-haplogroups found a relatively minor Upper Guinean impact of around 17% (“Western Africa”). While they found a quite staggering share of 83% so-called “Central African” lineages. The first thing to be noted though is that within this study only a limited range of African samples was available. When I looked into their supplementary data it turns out that their so-called “Western Africa” grouping only includes samples (both Fula and non-Fula) from Senegal, Gambia and Sierra Leone. Within itself this makes for quite a good approximation of the Upper Guinean macro-region as I have been using in my research.
However their so-called “Central Africa” group also includes samples from Niger & Nigeria! Aside from Chad, the Central African Republic, Cameroon and the DRC Congo. Again including eastern Fula or rather Fulani samples, and intially even Tuareg ones…(see supplementary table 2, although it seems they were left out of further analysis, p.13). So given this rather peculiar grouping it follows that their so-called “Central Africa” outcomes also cover Lower Guinea in fact! Also taking into account the absence of samples from Ghana, Benin and Togo etc.. While curiously Fula/Fulani samples have been used for both “Western Africa ” and “Central Africa”! It is a pity that the authors of this study did not elaborate on the reasons behind their sample selection. The labeling of their “Central African” grouping does seem quite inappropriate not to say downright misleading given also the wider implications they attach to it.
Previous studies based on maternal haplogroups did indeed find a greater share of Upper Guinean or more broadly West African haplogroups for both Puerto Ricans and Dominicans. See for example Viero-Vera (p.30, 2006) from which the quote below is taken:
Arguably haplogroup studies will not give a complete picture of course. For that you would need to investigate autosomal/regional admixture as well. Naturally this approach also has several shortcomings however from my findings regional admixture is already often in line with historical expectations. Going by my survey based on Ancestry’s Ethnicity Estimates Upper Guinean lineage represents a considerable share of around 30% for Dominicans (African breakdown scaled to 100%). As measured by proxy by the regions “Senegal” and “Mali” combined.
I first blogged about this in 2015 (this page) based on a sample size of n=68. In 2018 my findings remained quite consistent even when based on a greater sample size of n=162. When taking into account substructure based on total amounts of African admixture this Upper Guinean founding effect seems to be even more pronounced for the subgroup of Dominicans with relatively low total amounts of African admixture (<25%).
See also:
Update: Afro-Diasporan AncestryDNA Survey (2018)
In fact this Upper Guinean founding effect is also apparent in my ongoing 23andme survey (see this online spreadsheet). With a share of around 25% for the “Senegambian & Guinean” region. Which is notable in itself but also distinctive when compared with other nationalities, especially African Americans. Although I have not yet read it in full detail I believe this was also quite recently noted in 23andme’s study “Genetic Consequences of the Transatlantic Slave Trade in the Americas”.
It is too bad the authors of this study based on Y-haplogroups did not mention these discrepancies with their own findings themselves. Instead on page 17 they claim that their findings are in line with data from both mtDNA as well as from genome-wide studies. However it appears to me that this claim stems from an incomplete coverage of the literature as well as an overgeneralization of “the Caribbean”. Bypassing the context-specific aspects for the Dominican republic. Either way their inappropriately grouped data leads them to make this factually incorrect statement:
To their credit the authors do refer to the standard reference database for slave trade: TAST. However they do this in a frankly misguiding manner: combining the data for both Haiti and Dominican Republic by quoting only the total number (1 million) of slave imports into the entire Hispaniola island on page 16. However there are substantial differences between the Dominican Republic and Haiti when it comes to slave trade patterns (despite considerable overlap as well) and also general engagement with slavery. If you do not take these differences into account you are bound to make clearly unfounded assumptions! The historical demographics of the Dominican Republic are quite singular even within a strictly Hispanic Caribbean context. Instead of a simplistic 2-wave model of African slave imports I would argue for a more detailed analysis of slave trade into the Dominican Republic. As well as taking into account post-Slavery incoming migrations of Haitians, Anglo-Caribbeans (“Cocolos”) and any resulting geneflow. See also:
Documented African Roots of Dominicans
African origins of Hispanic Caribbeans according to DNA studies (scroll down to “Two waves of African geneflow?”)
And this is really one of my main qualms about many DNA studies in which too often I am finding that the historical context is either not given at all or seriously misrepresented. See below for a chart taken from the SlaveVoyages/TAST website. Slave trade into the modernday country of Haiti is measured by “Saint Domingue”, while slave trade into the Spanish ruled part of the island is measured by “Hispaniola”. Mind you this chart is only depicting documented and Trans-Atlantic slave voyages, which is bound to give an incomplete picture. Especially because of illegal Inter-Colonial slave trade by the English and the French. As can be seen the degree of Central African slave trade is indeed very significant for both parts of the island. However the general tendency of greater Senegambian slave trade for the Dominican Republic (mostly taking place in the 1500’s) is clearly distinctive.
Then again this study might still be valuable or make sense when realizing that this so-called “Central African” predominance of male lineages (which is actually also based on similarity with samples from Nigeria and Niger!) only might be valid for a sub-group of Dominicans. It does seem that the Dominican samples for this study were taken from reasonably representative locations within the country.
However it might also be that this study’s sample group is characterized by substructure going by total amounts of African admixture. Similar to what I have myself described for my Dominican survey findings in 2018 (see chart posted above). I am merely speculating here but it seems to me that the odds of having an actual African Y-haplogroup for Dominicans (38% in this study, see p.13) is going to be correlated with their total amount of African admixture. In other words “black” Dominicans or those Dominicans with above average amounts of African admixture are more likely to be descended from likewise “black” Dominicans or Dominicans with above average African ancestry in their direct paternal line. And ultimately from Africa or perhaps also by way of Haiti. While Dominicans with a greater degree of European admixture might more often have a European (incl. North African) Y-haplogroup. As was the case for 59% of this study’s samplegroup. I suspect for this subgroup of people their minor African admixture will date back further back in time, on average than for the first subgroup with greater African ancestry which might be traced back to relatively more recent timeperiods (1700’s instead of 1500’s/1600’s). It would have been really insightful if this study had delved some more into this issue by also looking into the autosomal admixture of their samples (although it seems the sampling took place quite a long time ago already: twenty years!, see p.6).
Now again I do think this study’s overall claim of so-called Central African predominance is incorrect (because of flawed sample selection/grouping). But I do also think that a relatively lower Upper Guinean imprint for a subgroup of Dominicans would make sense. And therefore implying a relatively higher combined Lower Guinean + Central African genetic inheritance for the same subgroup. As I have already blogged about in 2018 this would have to be explained by:
Still even for Dominicans with above average African DNA substantial Upper Guinean ancestry is often reported as shown in the screenshot below. This person was tested on 23andme and is showing a quite regionally balanced African breakdown in fact. Something which I have found to be true for most Dominicans in all my surveys sofar, also compared with other nationalities. So again I strongly disagree with this study’s proposition of so-called Central African predominance among Dominicans. Even when making allowance for the possibility that it might only apply for a subgroup of Dominicans their statement seems really exaggarated. I do agree though that the likelihood of substantial Central African lineage might be greater for Dominicans with higher total amounts of African admixture who in turn might also be more likely to have African Y-haplogroups. However the possibility of relatively early Angolan lineage from the 1600’s showing up in a pronounced manner might also still be valid for a subgroup of Dominicans with minor African admixture. Really given the complex history of multiple incoming waves of Africans and resulting geneflow the situation in the Dominican Republic defies easy generalization.
LikeLiked by 1 person
Yes, that’s the same team, but they still haven’t published anything on Fula genetics as far as I know. Also, thanks for your input!
Couple of things:
They reused data from the paper that they published 2 years ago on: “The peopling of the last Green Sahara revealed by high-coverage resequencing of trans-Saharan patrilineages.”
The additional files (file 1: table S5) contain Y-DNA data for 7955 individuals in 145 populations from Africa, Europe, West Asia and America. This paper is the most significant compilation of African Y-haplogroups as of today. For both Western and Central Africa, it had 1073 African samples. However, not all of them were NGS (next generation sequencing) tested. In the paper that I just mentioned, the Fulani samples from Nigeria (North), Niger and Cameroon (North)/Chad were actually grouped as part of Western Africa/Central Sahel. The Tuareg samples from Niger were grouped as part of Northwestern Africa/Central Sahel.
The grouping selection for the new paper does seem to be odd. I would agree that many areas within West Africa, but also throughout the continent, haven’t been sampled for Y-haplogroups. It’s an observation I myself always make when discussing haplogroups. However, I think I may have an idea as to why they grouped the data that way. In the D’Atanasio et al. (2018) paper, E-Z15939 was found at low frequencies for the aforementioned groups from Niger and Cameroon, in spite of the fact that they are Fulanis and Tuaregs. I have noticed over the years that my Eastern Fula matches throughout the Sahelian corridor, all the way to Sudan and beyond in Saudi Arabia, usually carry non-West African Y-haplogroups that are much more common within their respective local geographic areas. There is a possibility that the authors chose to classify these ethnic groups based on the dominant haplogroup or subclade matching the regional geographic location.
Regarding the Fulani samples from Nigeria, as you had stated, the Fula migrations into Northern Nigeria may have possibly started already in the 1600’s or even 1500’s, culminating later during the Sokoto Caliphate of the 1800’s. Additionally, this subclade is 000s of years old, so I also suspect that the authors, who conflated lower Guinea with Central Africa, may have assumed that these subclades could’ve already been present in this area as a result of a Sahelian movement from West Africa early on (D’Atanasio et al., 2018).
Dominant haplogroups or major subclades are useful to focus on macro-regional and continental geographic areas for groups, but they miss uncommon or minority cases. The difficulty with the manipulation of haplogroups as genealogical tools for relatively recent historical events, I think, is also due to the lack of NGS tested data from many groups located in various countries and regions in Africa.
In any case, I would trust your judgment as I am not knowledgeable about the complexity of the Dominican historical context.
LikeLiked by 1 person
PS – Lastly, something I forgot to mention. Many people may not be interested in delving into DNA studies, pulling out spreadsheets of data etc., but may still be interested in glancing over the distribution of haplogroups or specific branches. A quick trick would be to look them up on the YFull tree: https://www.yfull.com/tree/. It’s a valuable resource because data from both DNA testing companies and academic papers are continuously added to it. It also provides an interesting, graphic, general view of how branches are distributed across geographic areas.
The advantage of haplogroups and their respective mutations is that they don’t change. The data itself (mutations or corresponding branches) is ready to be analyzed and compared with other samples from other sources and databases which use the same nomenclature system. For those interested in tracing their direct male line, of course, they can still extract some valuable information with correct interpretation of the available data, independent of DNA studies and their shortcomings.
LikeLiked by 1 person
Thank you for the clarification and the link!
Yes very regrettable. Potentially it could have been so much more illuminating if they made another selection and also refrained from making such a far reaching assumption about “Central African” lineage among Dominicans being predominant. Because this is simply incorrect, both going from autosomal data as well as historical plausibility. In fact even their own findings do not seem to really support it. The study identifies E1b1a-U174 as the most frequent African haplogroup among their Dominican samples. And this finding seems to have been key for them in grouping most Dominican haplogroups as Central African (whenever actually African). They make the following statement:
However if you look into their supplement (2nd tab) it appears that despite being designated as “Central African” actually this E1b1a-U174 haplogroup has its highest frequency (45.7%) among 105 Nigerian samples (I am assuming Yoruba ones)! So again it is very misleading to only highlight Central Africa when really these Dominican YDNA-findings are also including Nigeria and therefore also Lower Guinea!
Yes I understand that given their previous in-depth research of Eastern Fulani they would also want to include those samples. However really for the Dominican context such samples are historically speaking irrelevant. Because practically all of the documented Fula captives arriving in the Dominican Republic came directly from Upper Guinea. And mostly in earlier timeperiods (1500’s/1600’s). There has been documentation also of later Fula arrivals in the Dominican Republic (1700’s). Again mostly by way of Guinea Conakry and Sierra Leone (previously it may have been more by way of Senegambia/Cape Verde). Theoretically speaking I suppose a few of them might have been shipped from the Bight of Benin/Nigeria (by way of Yoruba intermediaries). But frankly I think the odds of such a scenario are very slim because Fulani-Hausa wars took place mostly in the 1800’s. And even so the Fulani were then of course usually on the winning side, culminating in the creation of the Sokoto Caliphate. Therefore again the odds of Eastern Fulani ending up as captives to be transported to the Americas were very small. And should not have been taken into consideration in the first place.
Which is why I also find this statement by the authors a bit odd as it is really self-evident that Dominicans would not have any significant degree of Fulani ancestry from the eastern/central Sahel. But this does not rule out their genuine Fula ancestry from Upper Guinea!:
“A stronger clue is represented by the American distribution of the R1b-V88 haplogroup, which is very frequent in the lake Chad basin and sharply decreases moving west and south (Cruciani et al. 2010; D’Atanasio et al. 2018). This haplogroup has not been observed in our Dominican sample and has been rarely reported from other Caribbean locations (Mendizabal et al. 2008; Bryc et al. 2010; Simms et al. 2012; Vilar et al. 2014; Benn Torres et al. 2015; Poznik et al. 2016; Mendisco et al. 2019), in line with a coastal origin of slaves rather than Sahelian.”
I have been discussing this study with a Dominican friend of mine who has actually done some research on his Fula DNA matches:
Confirming African Matches: Abuelo’s Peul(Fula) Relatives
He pointed out to me that another more extensive study on Dominican genetics will soon be published by a team of National Geographic researchers. It will be based on about 1000 samples from all over the country. It is supposed to include both mtDNA, Y-DNA as well as genome-wide analysis. So that should be interesting to compare when it comes out. Because the sampling took place in 2015 I am assuming this aspect will also be more in tune with current standards as the sampling for this Y-DNA study apparently took place more than twenty years ago. Link below is for a short summary of their mtDNA findings:
Genetic Diversity in the Dominican Republic: Implications for the Population and Demographic History of Hispaniola
Another very useful comment by my Dominican friend is about how Upper Guinean lineage for Dominicans is most likely to have been passed down along a maternal line rather than a paternal line. This harks back to what I already discussed previously about Dominican ethnogenesis in the 1500’s & 1600’s. Resulting in a heavily admixed population among whom European Y-DNA is usally prevalent because of sex-biased admixture. However due to founding effects both Amerindian and Upper Guinean lineage has still been preserved, especially autosomally. On the other hand African Y-DNA might possibly then be more frequent among Dominicans with above average African admixture and/or more recent African ancestry (on average or at least along the paternal line, possibly also correlated with distant Maroon/Haitian ancestry?).
Either way he mentioned how the recent 23andme study on “Genetic Consequences of the Transatlantic Slave Trade in the Americas” also includes very insightful data on regional admixture for the X-chromosome! This study by 23andme also covers Dominicans. And as I myself had already established in my 2015 Ancestry survey they find that Upper Guinean DNA, measured in proxy by socalled “Senegambian & Guinean” is a significant component within the African breakdown of their Dominican samples. And very intriguingly more so prominent on the X-chromosome than on other chromosomes! 10.2% “Senegambian & Guinean” out of 39.35% total African on the X-chromosome. And 5.1% “Senegambian & Guinean” out of 30.3% total African, otherwise autosomal. I need to read this 23andme study more closely myself. And I will eventually also review it here on my blog as it is very akin to my research based on AncestryDNA results. But really this observation already seems to be in line with the Upper Guinean founding effect I blogged about in 2015. Screenshot below from Table S10. Mean Ancestry Estimates for (A) Autosomal Chromosomes versus (B) X Chromosome in Research-Participants Representing the Americas
A great reminder that we should always look into this from several angles. Haplogroups are naturally of course very informative, with correct interpretation. But for a complete overview also to be combined with other genome-wide data in relation with regional admixture as well as autosomal DNA matches. I actually hope to soon publish my findings about the African DNA matches I found for at least 10 Dominicans.
LikeLiked by 1 person
The title of the study clearly indicates that the focus of their analysis was on the Y chromosome diversity of the Dominican Republic. The lineages that are referenced are Y haplogroups and, to a much lesser extent, mtDNA.
I get your points. Objectively, they could have made more efforts with the labeling or the grouping. To be fair though, they made several statements clarifying, cautioning and nuancing some aspects of the analysis. They actually did specify quickly what their description of “Central Africa” suggests (between Cameroon and Nigeria).
From the paper:
Reading between the lines, one could still get a better idea of the targeted countries or regions. The so-called contrast between Western Africa & Central Africa is actually more of a contrast between Senegambia and the rest of West and Central Africa for Dominicans as it relates to their African Y haplogroups. The samples weren’t NGS tested but already-observed patterns inferred from basal Y-SNP (corresponding to subclades) provide interesting info. Naturally, the more samples, the better.
https://www.yfull.com/tree/E-CTS9883/
https://www.yfull.com/tree/E-U174/
You say: “And should not have been taken into consideration in the first place “
I would respectfully disagree. These haplogroups and subclades are several thousands of years old, sometimes even overlapping across different regions. When trying to investigate male lineages, I fear that unexpected results (due to unknown or under reported population movement) may be missed if the sample size is only restricted to historically suited, known areas. The split between these “male lineages” predates the historical time frames you referenced. There is a lot that we still don’t know about African genetics, particularly for uniparental markers. Afro-descendants, to varying degrees, still carry with them pieces of this complex genetic puzzle. It would be a loss to narrow the scope of haplogroup analyses. At worst, it would serve to discount other hypotheses from other open-ended projects.
Hardly any ethnic groups have a frequency of 100% for a haplogroup or even a particular subclade. The dominant haplogroup of a given area doesn’t include all the diversity or minority effects. While found at high frequencies in the Central Sahel, R1b-V88 isn’t the only lineage present in this area. In the case of nomadic Fulbe groups, varying frequencies are a constant across haplogroups & branches, and more so as we move East. E-Z15939 is primarily found in Senegambia among various groups, especially the Fulbe, but it is also found at a similar frequency (~50%) among Nigerian Fulbe, due to the recent historical events you mentioned. However, none of those Fula samples have been NGS tested so far. That was also specified in this paper.
Considering how old E-Z15939 is (10,000-5,000 years ago), it’s likely that there may be paternal lineages that are yet to be discovered that are actually closer to more recent historical time periods. I think that we cannot completely rule out that some Afro-descendants, including a minority of Dominicans (3% in this study) who are positive for E-Z15939, may belong to undiscovered branches (dating back thousands or even hundreds of years ago) which may not be present in Senegambia or Upper Guinea anymore (or at least not in significant frequencies), but could still be found in subsets of those Eastern Fulani populations or with other groups.
As for R1b-V88 and other source regions outside of western and central Africa, the authors’ statement was actually nuanced:
Ultimately, DNA studies in general may never completely align themselves with particular (still relevant and much needed) research agendas, although there is certainly room for improvement and more clarity.
LikeLiked by 1 person
Indeed. And when it had been phrased that way it would also have been more immediately clear that a share of 17% Upper Guinean male haplogroups among Dominicans who happen to have African Y-DNA (a subset of 38% of this study’s samplegroup) is actually quite considerable.
To be fair the authors also included a map in their supplement on how their “Central African” macro-region is to be interpreted. My main issue is that the authors then also proceed to attach wider implications to their findings in relation with Trans Atlantic Slave Trade. Maintaining the misleading labeling of “Central African”. Even when slave trade historians tend to have a more or less well defined area in mind whenever referring to Central Africa. And naturally this would not include Nigeria! I imagine this would also go for any casual layman reading this study btw. See also this page for several maps showing how slave trade areas are conventionally demarcated.
https://tracingafricanroots.wordpress.com/maps/slave-trade/
Lol, well maybe that came out a bit too strong indeed. For a more evenhanded analysis ideally I would have wished this study had also included Y-DNA samples from other West African countries, such as Ghana, Benin and Togo. And in order to establish whether African captives brought over to Hispaniola had either a coastal origin or Sahelian origin I imagine samples from the western Sahel (Mali, Burkina Faso etc.) would have been more relevant. Given that I am not aware of any historical sources contradicting that the lake Chad basin was at best a marginal source for Trans-Atlantic slave trade (but not so for Trans-Saharan trade). And so this could have been anticipated already. Also bringing it back to genuine Central African origins for Dominicans I imagine that a greater number as well as greater diversity of Congolese, Angolan or even Zambian and Mozambican Y-DNA samples would have been more appropriate. But of course I understand that availability of such samples may have been problematic.
This was a very interesting study indeed albeit that it was focused on a somewhat atypical finding. I have actually reviewed that study five years ago:
https://tracingafricanroots.wordpress.com/2015/06/06/specifying-the-african-origins-of-the-afro-diasporan-genome-part-2/
LikeLiked by 1 person