
In May 2016 I published the first summary of my Afro-Diasporan survey findings based on 707 results for 7 nationalities (see this blog page). My survey has been ongoing ever since. Right now an update of AncestryDNA Ethnicity Estimates seems even more imminent than it was in 2016 (when it was canceled in the beta phase). So that’s why I will yet again provide a “final” overview of my survey findings 😉 See this link for the first part of my findings which is focused solely on the African breakdown:
In order to provide a broader perspective on the complete DNA make-up of Afro-Diasporans I have this time also analyzed the non-African regional scores on AncestryDNA. Enabling a continental breakdown for my 8 sample groups. Mainly based on 860 results for people from 8 nationalities1. Although the total number of results and nationalities in my survey is even greater.
Generally speaking also the non-African group averages seem to be reasonably in line with historical plausibility. Amerindian, Asian and Pacific trace-amounts are not being left out. These scores are often labeled as low confidence regions and dismissed as just “noise”. Rightfully so in some cases. But given correct interpretation and proper follow-up research at times these scores can still potentially lead you to distinctive ancestors. Furthermore my survey results are now also allowing for a more detailed discussion of the European breakdown as being reported for Afro-Diasporans.
I would like to underline right from the start that my findings are not intended to represent any fictional national averages! The group averages I have calculated for my sample groups are neither absolute or conclusive but rather to be seen as indicative. Obviously several shortcomings may apply. One main aspect to take to heart is that there will always be individual variation around the mean. Given correct interpretation I do believe these group averages suggest insightful tendencies though for each of my 8 sample groups. They also mostly comply with the findings of admixture studies published in peer reviewed journals, or at least the ones I am aware of.2
Chart 1 (click to enlarge)

***
***
Given the theme of this blog my survey has naturally been focused on Tracing the African Roots of my sample groups. However most Afro-descendants are not exclusively of African descent. As shown in chart 1 they show variable amounts of non-African admixture as well. Amerindian lineage is significantly present for practically all of my Hispanic American as well as Brazilian survey participants. But Native American DNA was usually absent or greatly diluted (<1%) for my African American, Haitian, Jamaican and Cape Verdean sample groups. Asian ancestry is again usually only reported in trace amounts for almost all my sample groups. Jamaica being a notable exception. Minor but still substantial amounts (>5%) of “Asia South” and “Asia East” are frequently appearing for my Jamaican survey participants. Even if many other Jamaicans may not show any Asian admixture at all. I will discuss these continental scores as well as from West Asia & the Pacific further below.
However by far the most common type of non-African admixture involves European DNA. For several of my sample groups it even represents the biggest part of their ancestry. I fully understand and respect that given the brutal history of the Slavery Period as well as continued racism afterwards many Afro-Diasporans might not be inclined to learn more about their minor European origins. Even if the possibility of this European ancestry (partially) dating from the Post-Slavery Period cannot be ruled out in advance. Muhammad Ali’s Irish great-grandfather makes for an intriguing example.
Still other Afro-Diasporans will be more curious about their complete genetic make-up and how this might define them. Despite shared experiences one must also be careful to respect the localized context and different historical trajectories across the Afro-Diaspora. Instead of just letting one single perspective on inter-racial relationships overcloud things. In fact there can be several valid reasons to also explore the European origins of Afro-Diasporans in a pragmatic and open-minded manner. Ironically in the process you might often also acquire valuable details about African ancestors linked to your European ancestors as well as their biracial offspring.
European Breakdown (scaled to 100%)
Chart 2 (click to enlarge)

***
Many people are confused and often also mislead by their European DNA results. This happens because they tend to take the country name labeling too literally. Ignoring the geographical & genetic overlap of AncestryDNA’s regions. However in most cases receiving a multitude of European (trace) regions does not imply that you have a confusingly diverse European background! Rather it suggests that your European ancestors were themselves genetically diverse. But still these ancestors could have been from just one or two ethnic groups only.
Because of ancient migrations and ongoing ethnogenesis it can be said that European DNA is also a melting pot if you go back far enough in time. For correct interpretation it is essential to be aware of how native Europeans themselves are described by AncestryDNA. The same principle is valid of course for a better understanding of African and other continental scores as well. Unlike other DNA testing companies AncestryDDA actually provides very useful information in this regard (see this link). However I have chosen to also insert my own findings from a survey among actual Europeans which I have been conducting specifically for this purpose. For more details see:
In chart 2 I have calculated how the scaled3 European breakdowns of each of my 8 Afro-descended sample groups compare with the group averages of several European sample groups. The European countries I selected in chart 2 represent the most likely source candidates for the European DNA detected among my survey participants. Based on the colonial history for each of my sample groups. Of course this is not to deny or rule out any additional and also post-colonial European migrant lineage from other countries. In individual and documented cases this may be very relevant even. I am however principally concerned with finding more generalized tendencies.4
Despite obvious sample size limitations I find it remarkable how closely my Afro-Diasporan sample groups resemble their historically plausible European source populations already. The following is mostly (informed) speculation from my side. But based on this (preliminary) data I would assume that for my Brazilian, Cape Verdean and Hispanic survey participants for the most part the “Europe South” (a.k.a. “Italy/Greece”) scores are being inherited from either Portuguese or Spanish ancestors. In fact this also goes for much of the “Great Britain”, “Ireland” and “Europe West” scores. Unless reported in an atypically high degree or in accordance with known family history involving non-Iberian lineage. For more details see:
Likewise for my Haitian sample group I strongly suspect that despite their European composition seemingly being very diverse it is still mostly French DNA which is being reported for them on AncestryDNA. However only by mislabeled proxies because of a lack of fitting French samples as well as probably a great deal of genetic diversity to be found within France. Therefore French DNA is compatible with several regions on AncestryDNA, incl. “Iberian Peninsula” and “Great Britain”. But also “Ireland”, “Europe South” and even “Scandinavia”. Aside from “Europe West” which is probably only designed to pick up on the Germanic parts of French genetics. It is however well known that the ancestral make-up of France also includes strong Celtic and Mediterranean influences. For more discussion see:
For my African American and Jamaican sample groups it must be kept in mind that in the current version of AncestryDNA British ancestry is being described as a composite of “Great Britain”, “Ireland”, “Europe West” and “Scandinavia”. This may be confusing when the regional labeling is taken at face value. However these are all still basically Northwest European regions and given Great Britain’s more ancient history not really surprising at all. For more information on how to correctly interpret these regional scores associated with British DNA:
- Recent University of Oxford study sheds light on estimating Great Britain ethnicity (ancestry.com, 2015)
- What does our DNA tell us about being Irish? (ancestry.com, 2015)
- AncestryDNA – The Viking in the room (ancestry.com, 2015)
- How British are YOU? Genetic study reveals Yorkshire is most Anglo-Saxon part of UK, while East Midlands is most Scandinavian (Daily Mail, 2016)
Chart 3 (click to enlarge)
***

***
As I have been proposing also for my African survey (see this chart) it seems to be worthwhile to focus on the primary regions for my sample groups. As an extra pronounced indicator if you like. In chart 3 this is measured by the frequency of regions being ranked #1 (regions with the highest amount in the European breakdown).5 I have ranked the outcomes from highest to lowest frequency for “Iberian Peninsula”. And in order to highlight their genetic/geographical overlap I have used green colouring for Southwest European regions and a blue/grey palette for interrelated Northwest European regions.
As such it becomes more apparent how my Brazilian, Cape Verdean and Hispanic sample groups are overwhelmingly receiving Southwestern European top regions (“Iberian Peninsula” and “Europe South”). While the primary European regions being reported for African Americans and Jamaicans tend to be predominantly Northwest European (“Great Britain”, “Ireland”, “Europe West” and “Scandinavia”). Again all of this is more or less in agreement with historical plausibility. The Haitian pie chart is most diverse and appears to be bewilderingly random. This is however due to the inadequate coverage of French origins on AncestryDNA. As well as a logical result of France being intermediate between Northwest and Southwest Europe. The upcoming update of AncestryDNA will hopefully resolve this unsatisfying matter.
Several things are to be taken into consideration. First of all as already demonstrated in chart 2 the “Iberian Peninsula” region is not unique to any specific country. However it seems to be descriptive of Spanish origins most of all. Especially northern Spain. While Portuguese DNA more often requires the additional inclusion of “Europe South” (see this page for more details). Which seems to validate the ranking of my findings in chart 3. After all my Hispanic sample groups are showing the highest degree of top ranking “Iberian Peninsula” scores. While my Brazilian and even more so Cape Verdean sample groups are showing a more pronounced “Europe South” frequency. Again other ancestral scenarios are not to be ruled out (genuine Italian or Sephardi Jewish lineage). However just based on how actual Portuguese DNA is being described by AncestryDNA this outcome already makes much sense within itself.
Despite the labeling French DNA is also often (but to a lesser degree) described by the “Iberian Peninsula” region. Which most likely is the main explanation for the significant frequency of “Iberian Peninsula” as European top region among my Haitian survey participants. In fact it may also be the reason why several (12/191) of my African American (incl. Louisiana Creoles!) received this region as top region. Among my Jamaican samples at least one person had actual known Portuguese/Madeiran lineage. Not that uncommon for the West Indies I suppose (see this link).
This might be a redundant disclaimer. But whenever the biggest region within the European breakdown is being described as low confidence it already follows we are dealing with increased chances that the European regional designation will be inconsistent for trace regions. This occurred most frequently for my Haitian, Jamaican and African American sample groups. Who generally only showed minor amounts of European admixture. Due to “quirky” recombination it might be that some unexpected trace regions for them have been disproportionately inherited merely by chance.6 A less blurry picture would probably have materialized when focusing only on the results of my survey participants with above average European ancestry and/or featuring at least one European region above trace level.
I strongly suspect this explains for example the minor but still rather peculiar frequency of “Finland/Northwest Russia” top scores which were practically always only reported as trace regions within my survey (max. score 5%). This outcome most likely represents mislabeled DNA which may not be verified by either genealogy or corroborated by other DNA test results (such as 23andme which seems to be more reliable with trace amounts). This does not imply by the way that these small trace segments would not be unmistakably European in origin! Continental assignment can be performed much more reliably than subcontinental assignment. Rather it means that AncestryDNA cannot rule out that several European regions could qualify at the same time when describing these small DNA patches.
Less reliable trace region reporting probably also explains part of the unexpected Northwest European top scores for my Brazilian, Cape Verdean and Hispanic sample groups. Because this often occurred whenever the overall European amount was low and therefore only described in trace regions. Even when in selected cases genuine Northwest European lineage might be hinted at as well. This seems to be true especially for my Cape Verdean sample group. Historically attested settling and inter-marriage of Dutch, English and French sailors with Cape Verdean women goes back to atleast the 1600’s/1700’s (see this link). Also during a previous survey I performed among Cape Verdean 23andme results I came across a similar finding of somewhat increased Northwest European scores when compared with Latin Americans. Follow this link for more details:
Last but not least there were also a few intriguing top ranking scores for “Europe East” and “European Jewish”. Admittedly often when reported as trace region, but not always. Furthermore given the distinctive nature of especially Jewish genetics perhaps such scores could be more solid. It bears reminding though that the “European Jewish” region is first most describing genetic similarity with Ashkenazi Jews. I have only seen very few Sephardi Jewish results on AncestryDNA. However based on my limited observation sofar it seems that they are described on AncestryDNA more so by “Europe South” and “Middle East”. This is a crucial issue as it is the Sephardi Jews rather than the Ashkenazi Jews who have historically been most involved with the Afro-Diaspora.7 Follow the link below for more details on how to interpret Jewish scores as well as “European East”, which might often imply German origins for Afro-Diasporans.
“Exotic” admixture
***(click to enlarge)

Take note that on the left “Asia East” is combined with so-called “Polynesia”. While on the right “Asia South is combined with so-called “Melanesia”. In both cases the minor Pacific scores are actually a misreading of Chinese and Indian DNA.
***(click to enlarge)

Both of these persons have confirmed Lebanese lineage from the 1900’s. Relatively recent therefore. Aside from the “Middle East” scores also “European Jewish”, “Caucasus” and “Europe South” could actually be part of the genetic inheritance from a Lebanese ancestor. See also this link.
***(click to enlarge)

Quite elevated levels of West Asian scores. Several ancestral scenario’s might be possible. But generally speaking perhaps mostly to be traced back to the earliest colonial period of these countries (1500’s)?
***(click to enlarge)

AncestryDNA is not always able to make the distinction between Amerindian DNA and Central Asian DNA. Because of shared ancient origins in Siberia. In most cases therefore “Asia Central” %’s are to be added to the “Native American” score.
***
As demonstrated by chart 1 as well as the above screenshots Afro-Diasporans may sometimes receive regional scores on AncestryDNA which go beyond just Africa, Europe or the Americas. Some of these scores will be in line with historically plausible migration/admixture patterns. In particular the “Asia East” and “Asia South” scores reported for Jamaicans seem to be very straightforward. Because these are in accordance with Jamaica’s history of Indian contract labourers as well as Chinese migrants arriving after Slavery had been abolished. Many of these people consequently were absorbed by the mainstream Jamaican population through inter-ethnic unions. Even when the existence of such Asian ancestors is apparently not always known by their mixed descendants.
The same holds true for some of the prominent West Asian scores which might either signal quite recent Lebanese migrant origins (late 1800’s/1900’s, see this link), as shown for the Brazilian and Haitian examples above. The Brazilian screenshot also featuring a corroborating “Syrian/Lebanese” migration. Even when this person was actually not aware of such lineage before DNA testing! In other cases these elevated West Asian scores could also suggest older lineage derived from the earliest settlers of Latin America as well as Cape Verde. Among whom people of both recently converted Moorish and Sephardi Jewish descent are very likely to have been present. Other (less likely) scenarios (i.e. Fula people from Sahelian Africa) might apply as well in individual cases. As shown in chart 2 the original West Asian as well as Jewish and North African scores for my Latin American and Cape Verdean sample groups are minor but still quite noticeable. Such scores are also being reported for the Spanish and Portuguese results I have collected. However to a lesser degree. Intriguingly the only exception being “Africa North” which peaks for my Portuguese sample group.
Other continental regions however seem less historically plausible at first sight. Especially “Asia Central”, “Polynesia” and “Melanesia” seem quite outlandish. These latter scores are usually only reported as a trace region with reduced confidence level. And therefore automatically to be taken with the proverbial grain of salt! I would however argue against complete dismissal at first hand. Because such outcomes do usually make sense when genetic similarities & ancient migrations are taken into consideration. As shown by the two Jamaican screenshots above “Pacific Islander” scores are almost always combined with “Asia East” or “Asia South” amounts (when these latter regions are reported with substantial amounts >10%). And therefore they can safely be considered as merely mislabeled regions to be added to the Asian amounts indicating either Chinese or Indian lineage. In other cases Pacific Islander scores (especially “Polynesia”) might also suggest Southeast Asian lineage. Which in turn could tie in with a possible Malagasy connection! This might be especially relevant for African Americans.
The rather subdued “Native American” scores for African Americans seem to be caused first of all by inevitable dilution of such bloodlines across the generations. Something many Americans may have underestimated due to inexact family lore (see this link). Even though less than anticipated this could imply that even minuscule trace amounts of <1% could still be valid. Suggesting one Native American ancestor from the 1700’s or earlier rather than from the 1800’s/1900’s. However that’s not the end of it. As illustrated by the Mexican and African American examples above, “Asia Central” is often being reported as part of someone’s Amerindian lineage. This can be explained by the close genetic similarities between Central Asians and Amerindians from especially North America due to shared ancient origins from Siberia (see this link).
During my survey I have also observed how “Asia East” is showing up as a mislabeled region to describe actual Native American lineage (see these Native American results from the US). A statistical implication could therefore be that the rather elevated “Asian” group average (1.8%) for my Mexican sample group could actually mostly indicate Amerindian DNA. Albeit that a minor degree of diluted but still genuine Asian admixture (i.e. Filipino) for Mexico could also be historically possible. Furthermore the actual Native American group average for my African African sample group might then be 1.0% instead of 0.6% (adding in group averages of 0.3% “Asia Central” and 0.1% for “Asia East”, see this link). In fact this also goes for the Amerindian group averages I calculated for my Dominican, Puerto Rican and Brazilian sample groups. Which are to be slightly increased by including the most likely mislabeled Asian trace amounts for “Asia Central” and “Asia East”.
it’s worth repeating again that without additional clues and corroborating evidence your attempts to trace back trace regions to specific ancestors or ethnic groups could very well lead to a dead end. Conjecture and unfounded speculation can then quickly turn to self deception. To improve correct interpretation of your unexpected results learn more about how other people of such background tend to be described by AncestryDNA. You will also reach a deeper understanding when you stop fixating on the regional labeling too much. You can still obtain insightful information, even from trace regions, as long as you adopt a broader perspective on genetics and resist jumping to premature conclusions. Follow these links for more details:
- Asian, Pacific & Native American AncestryDNA results
- East Asian & Polynesian AncestryDNA results
- South Asian & Melanesian AncestryDNA results
Upcoming Update?
***(click to enlarge)
***
It is sometimes said that your DNA results are only as good as the next update. So it’s best not to get too attached to them 😉 Given scientific advancements and a greater number of relevant reference samples hopefully a greater degree of accuracy may be obtained in the near future. But naturally no guarantees are given that this will indeed be the case. As shown above AncestryDNA’s update promises to create several new regions. Especially for Europe & Asia, but also Native American DNA is now being further subdivided. At the moment of writing this blog post there is still quite some uncertainty if AncestryDNA’s intended update will indeed be implemented or remain stuck in beta phase (as happened in 2016). I will therefore refrain from any in-depth judgement for now. For more details about the update:
- Updated “ethnicity” estimates at AncestryDNA (Cruwys News)
- AncestryDNA New 150+ Regions (Youtube)
My survey has been based on the current version of AncestryDNA’s Ethnicity Estimates. It remains to be seen how well my present findings will correspond with any newly calculated AncestryDNA results. Will they be rendered completely obsolete or may they still contain lasting insights about the approximate ancestral composition for my survey groups? I expect that the continental breakdown is bound to remain quite steady. As these scores tend to be most reliable in admixture analysis. Except for some of the least reliable trace region reporting. Especially the mislabeled “Pacific Islander” trace amounts may disappear for many people due to the refining of the Asian breakdown. Possibly also the “West Asian” and “Africa North” scores will diminish. The European breakdown could very well see some major improvement. Either way I intend to once again contrast Ancestry’s updated results with historical plausibility as well as the results of actual Africans, Asians, Europeans, Native Americans etc.. As I will keep aiming for combining insights from various fields. Always looking for correct interpretation. Critical but also staying open-minded and careful not to be dismissive when informational value can still be obtained.
Distinctive Results Across the Diaspora
____________________
“Still it is possible that people of two different nationalities but with the same total African amount will obtain the exact same African breakdown or nearly so. Also for individuals of two different nationalities and with different levels of total African ancestry the regional scores in their African breakdown might still come very close, both proportionally speaking and in ranking. Implying that in individual cases it will actually be the non-African regions which might prove to be most useful to identify each separate Afro-descended group based on their DNA results.” (Tracing African Roots, May 2016)
____________________
During my survey I found it striking that Afro-descended populations often seem more distinctive and recognizable in their non-African components rather than their usually overlapping African breakdowns. Implying that based on group averages it will actually be the non-African regions which might prove to be most useful to distinguish each of my 8 sample groups based on their DNA results.
Below screenshots have been selected to illustrate seemingly distinctive non-African regional compositions among my sample groups for persons with a similar level of African ancestry as well as featuring the same African top region. Obviously these individual results will not always be the most typical ones for their nationality. And naturally there will also still be a great deal of overlapping and similar results across the board (both African and non-African breakdowns). From what I have seen this is especially true for Jamaican & African American results as well as Dominican & Puerto Rican results.
*** (click to enlarge)
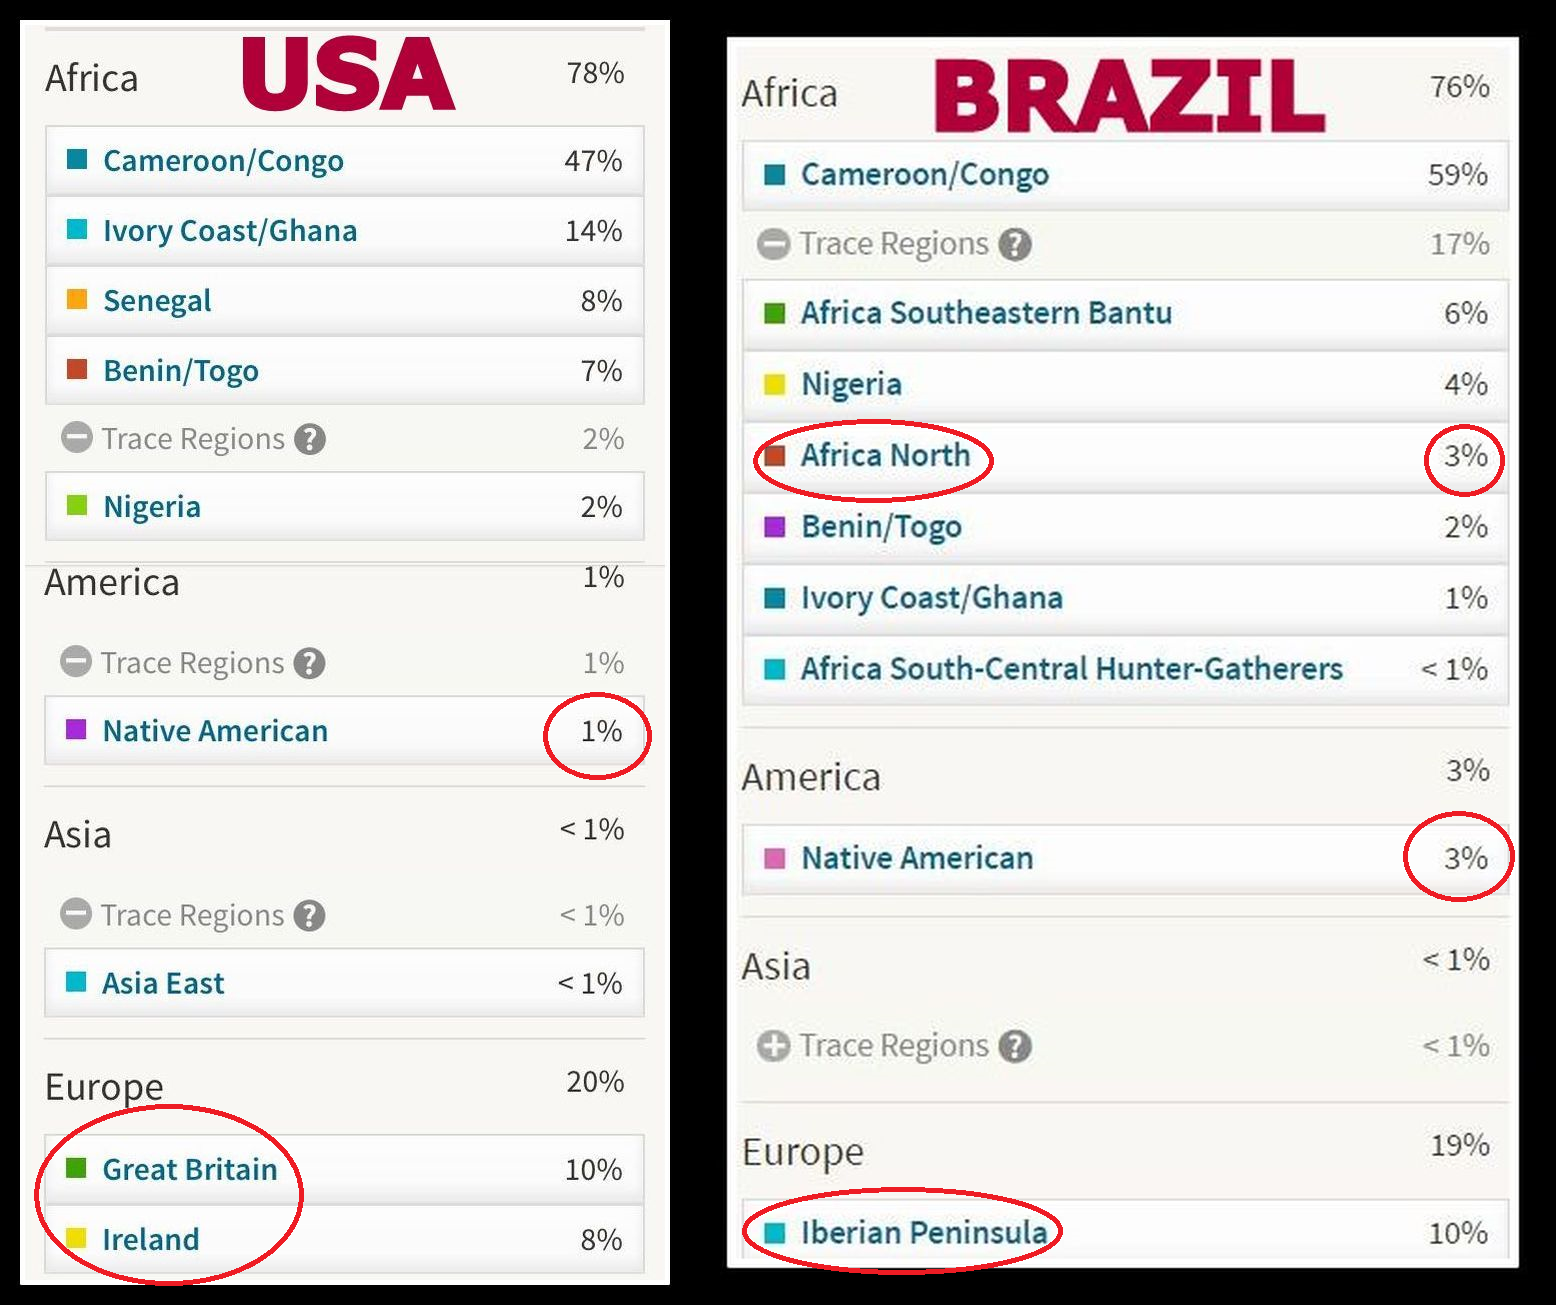
Both results show impressive amounts of “Cameroon/Congo”. However the European breakdown as well as the relatively more pronounced Amerindian and “Africa North” scores make it more clear to which nationalities these results belong.
*** (click to enlarge)

Equal levels of African DNA, as well as a predominant “Benin/Togo” score. However the lack of any “Native America” score for the Haitian seems to be most telling to make the distinction. It’s a bit trickier for the European breakdown as both “Iberian Peninsula” and “Italy/Greece” , a.k.a. “Europe South” are commonly reported as a top-ranking European region for my Dominican as well as Haitian survey participants. However it’s still very likely that Spanish lineage is being implied for the former and French lineage for the latter.
*** (click to enlarge)

African Americans and Jamaicans tend to be quite similar in both their African and European breakdowns. However the frequent appearance of substantial Asian admixture among Jamaicans does make for a stand-out feature. Even when not all Jamaicans will have Asian admixture.
*** (click to enlarge)

Despite the striking 20% “Senegal” score on the right it can still easily be verified that it’s not a Cape Verdean profile due to the 5% “Native American” score. The elevated “Middle East” score (as well as “Africa North”) for the Cape Verdean is actually a shared feature with Dominican profiles. The relatively high “Europe West” score will also not be unique for Cape Verdeans but possibly to be observed in greater frequency for them.
***(click to enlarge)

Quite similar African breakdowns but the Asian, European and Amerindian scores make it very easy to guess which profile would be Jamaican or Puerto Rican.
*** (click to enlarge)

A predominant “Mali” score for both profiles. However the increased level of “Africa North” would be highly atypical for a Jamaican. Unless some substantial Portuguese/Madeiran lineage would be involved. However the predominant “Great Britain” score makes such a scenario very unlikely.
*** (click to enlarge)

Hypothetically speaking these results could very well be inter-changeable between Puerto Rico and Brazil. And perhaps even between Brazil and Mexico. The reason they look distinctive to me is based on the Amerindian scores roughly corresponding with group averages. However especially for Brazilians it can be expected there will be a greater variation across the mean, with higher maximum Amerindian scores than Puerto Rico.
***
Links to source data & methodology
The survey findings featured in this blog post merely represent my personal attempt at finding generalized, preliminary and indicative patterns on a group level inspite of individual variation. Everyone has a unique family tree of course first of all. For a deeper understanding of your personal results my advice therefore is to perform follow-up research (DNA matches, genealogy, relevant historical context etc.) and aim for complementarity of your findings (see also this blog post). I would like to thank again all my survey participants for sharing their results with me. I am truly grateful for it!
For a detailed discussion of my methodology & research read these blog sections:
- Afro-Diaspora AncestryDNA results: A Comparison (2016)
- Asian, Pacific & Native American AncestryDNA results (2017)
- European AncestryDNA results (2017)
- Survey of AncestryDNA results for Africans & Afro-Diasporans (main overview)
For the direct links to the source data follow these links. All of which are tabs of the same online spreadsheet. Calculations can be checked by verifying the formula’s. The non-African scores are generally to be seen by scrolling to the far right of the sheets:
- Afro-Diaspora AncestryDNA results: African breakdown
- Afro-Diaspora AncestryDNA results: Continental breakdown
- Afro-Diaspora AncestryDNA results: European breakdown
- African American AncestryDNA results (n=200)
- Brazilian AncestryDNA results
- Cape Verdean AncestryDNA results
- Dominican AncestryDNA results
- Haitian AncestryDNA results
- Jamaican AncestryDNA results
- Mexican AncestryDNA results
- Puerto Rican AncestryDNA results
___________________________________________________________________________
Notes
1). This number of 860 results among 8 sample groups is less than the 1,264 results for the same 8 sample groups I was able to use for my African breakdown survey (see first part of this blogseries). This is because I did not always have complete results available for all of my survey participants. The number of 860 results being the total number of results mentioned in chart 1. In turn the sample sizes in chart 1 represent the number of results for which I had at least both African and European amounts available. Even so in many cases the breakdown would still not be fully complete because of missing scores for other continents or unspecified trace regions. This goes especially for the Puerto Rican results. My African American, Brazilian, Jamaican and Haitian data-sets are practically fully complete.
2). Just to name a few studies providing admixture proportions for the same nationalities as also included in my survey:
- Reconstructing the Population Genetic History of the Caribbean (Moreno-Estrada et al., 2013)
- Unravelling the hidden ancestry of American admixed populations (Montinaro et al., 2015)
- The Genetic Ancestry of African Americans, Latinos, and European Americans across the United States (Bryc et al. (2015) (based on 23andme results).
- The Great Migration and African-American genomic diversity (Baharian et al., 2015)
- A continuum of admixture in the Western Hemisphere revealed by the African Diaspora genome (Mathias et al, 2016)
3) In order to make the European compositions for my sample groups inter-comparable I have scaled the European part of the AncestryDNA breakdown to 100%. This also enables a comparison with plausible European source populations. I have done the same for the African breakdown throughout my survey. Basically I applied the following formula:
- Scaled amount = % for a given European region divided by % of total European amount (all based on group averages)
The scaling formula I used is very simple therefore and can be verified from within the spreadsheet by clicking on any cell featuring a regional score and then viewing the calculation in the function bar (fx) in the upper left corner. All other Excel formulas I used throughout the sheet and especially in the tab “Stats” can also be verified in this same way.
4) The whole set-up of my European AncestryDNA survey is merely intended as an exploratory exercise. AncestryDNA’s regional framework is not best equipped to learn about specific ethnic details. Even when still insightful in itself, given correct interpretation. And hopefully to be improved by the upcoming update. In order to learn more about possible ethnic lineage on your European side I would recommend dedicated family tree research and a close analysis of your DNA matches. In order to zoom in to possibly European DNA matches you can use my filtering method as discussed in this blog post and apply an European filter rather than the African ones (4 & 5 in this sheet).
5) The sample size being mentioned in chart 3 for African Americans, Haitians and Jamaicans is less than the sample size being mentioned in chart 2. This is mostly because results which did not show any European amount at all were not included in chart 3.
6) To add to the reservations arising from Trace Region reporting. Especially when labeled as “Finland/Northwest Russia” or any other seemingly implausible region this type of DNA might speculatingly be representing the remnants of a very ancient prehistorical European bloodline or socalled “cold spot” DNA segments. Which are least likely to be affected by recombination.
7) I have included both the scaled and original group averages for “European Jewish” in chart 2. I should point out though that based on the scaled %’s you might get a wrong impression that it shows up most prominently among my Haitian sample group (5.9%). This however only represents a scaled proportion of their 10.9% total European amount (on average). Because their overall European admixture is quite minor it results in some distortion when scaling. The Haitian group average for “European Jewish” based on original scores is 0.6%.

Interesting article, Honestly. Having used Ancestrydna ,23and me, and family tree dna. When it comes to AncestryDna, IT does best with African breakdowns (none which have changed since the updates for me). However, when it comes to 23andme, I feel like they beat Ancestry as a whole with anything non-African,they do good with total african percentage an that’s about it. However they seem to be very accurate an precise with picking up European and Asian Dna, plus the benefit of doing haplogroups, and they have the confidence meter bar to get a more conservative estimate. And as i believe you said early on in the article, They are better at “Trace regions” than ancestry is. If only they could borrow what they are missing from each other. So as a whole for my ENTIRE genetic makeup, i kinda trust 23andme more, and for my African breakdown Ancestry of course. I actually was so relieved that 23andme didn’t do the most with my european ancestry an just labeled it like i knew what it SHOULD have been, Mostly “British and irish,and northwestern european” with a smaller southern european. Unlike ancestry that did the most and lumped all of it into 16 /17% trace regions of nothing but fancy european country titles like its some sort of big “mystery” that needs to be unlocked (i think you remember when i first posted, how i was kinda upset that combining part of my african dna with everything else i had like 25% trace regions. Expecting it to only be about 3% or so..) . Other dna test seem to do the craziness with european dna too. I took the liberty when 23andme had that “24 hours to get a free ethnicity estimate by uploading your raw genetics from ancestry to their website” Just to see if it stayed the same, and of course 99% was pretty much the same, only difference was i lost half of the tiny bit of my unassigned percentage ,a very small percentage got moved around, my broad European categories went down some, the stereotypical <1% or 0.4% East Asian/Native american stayed the same, And east africa was added to Africa and Sardinian to europe, which i honestly don't know what that was about, im betting my original 23andme test without the extra two was more accurate. But all in all, i feel 23andme kinda has my entire genetic mixture broken down better (except africa) than ancestry.
LikeLiked by 2 people
Yes i agree that the trace region reporting on AncestryDNA has often been unnecessarily “all over the place”, lol. Then again you also have people who test with 23andme complaining about their results not being specific enough or too generic. I mostly agree with this reply someone once made in that regard “NO information is far preferable to FALSE information”. I too tend to prefer a sketchy regional breakdown above an overspecified breakdown which gives false hope about pinpointing specific lineage. However…I also believe that if you know how to truly “read” or rather decipher Ancestry’s trace regions they can at times still provide valuable info.
There are also people who insist that admixture analysis is only good for the continental breakdown, while the regional breakdown will never be *completely* in alignment with known ethnic lineage. I think this is mostly a matter of lowering your expectations and being realistic about what’s possible at this stage. Despite the admittedly misleading labeling at times I do think you can also get insightful information on a regional level. For the European breakdown i would say it’s already quite useful just to know if that part of your DNA is mostly Northwest European or rather Southwest European. If somehow this info could be combined with the very detailed European “migrations” Ancestry has on offer that could be a really good deal! I guess they will have to loosen the criteria for their genetic communities though.
I’m very curious to know if Ancestry’s breakdown will be an improvement. I have seen several updated results already and it seems that British ancestry will be described in a more straightforward fashion. So that could be good news for many people. On the other hand the distinction with other Northwest Europeans (Dutch, Germans etc) might still remain blurry. Frankly I don’t like the new overspecific regions of Sardinia and Basque. But it could very well be that also Southwest European origins will now be described more accurately by the new regions of France, Spain & Portugal.
On the African end i have regrettably not seen that many encouraging results yet…I guess we’ll have to wait and see how it all works out;-)
LikeLike
Im way late with this reply…Lol But i cannot tell you how many times i had a small aneurysm because someone read their Ancestry reports too literally. Specially the European “omg im part russian?!” An i literally face palm into the keyboard. Or someone seeing Polynesia and thinking they are Hawaiian. And you just want to say “That’s not how it works, that’s not how any of this works…” But then you have to explain the same thing all over again an rain on everyone’s parade. I kinda blame Ancestry for that even though they tell you not too always take things too literally.The labels just don’t fit at times… better to just leave it as “broadly Northern European” or “Southern European”until you can figure it out. Wish they had a confidence meter bar like 23andme….
LikeLiked by 1 person
Fonte, if you noticed, the Dominican and PR Samples are actually CLOSER to perfection to the Portugese then the Spanish, remember how int he upcoming update so far we are seeing DR’s and PR’s leaning torwards portguese, with meso and south americans leaning torwards spanish.
LikeLiked by 1 person
Yes they do indeed seem to be somewhere in between my Portuguese and Spanish samples. And more so tending towards the Portuguese group averages in chart 2. However going by the frequency for “Iberian Peninsula” shown in chart 3 I think it becomes more apparent they are shifted more towards Spain when compared with the higher frequency for “Europe South” among my Brazilian and Cape Verdean samples. My Spanish sample size is of course very limited and I suspect that people from southern Spain would probably score more similar to Portuguese. And probably even more so the settlers of Hispanic Caribbean during the early colonial period (1500’s/1600’s). Then again actual Portuguese settlers were also among them as you know. Will be very interesting to see how the new update will manage to distinguish Southwest European DNA into not only Spain, Portugal but also France and even Basque!
I happen to have seen an updated Portuguese result for the first time:
Portugal 78%
Spain 9%
France 9%
Turkey and the Caucasus 2%
England and Wales 2%
Migrations: Portuguese
***
It looks like a big improvement even if not perfect of course 😉 No more false “Italy/Greece” scores. However still some remaining overlap with neighbouring regions Spain and even France. It also looks like the “Africa North” scores are completely absorbed now by “Portugal”. Will be interesting to see how much of it will remain among Cape Verdeans and other parts of the Afro-Diaspora. Also very curious about which parts of France, Spain and Portugal the newly added reference samples are from.
LikeLike
African American, here, with about 35% European admixture. Yes, there are certainly a lot of folks who might be too literal in reading the results, but there is a strong argument to be made, I think, that these testing services are also doing a lot of work that results in results which are probably no better than a crap shoot. It’s one thing not to know that populations in Europe are often diverse, themselves, and another to have siblings and such getting vastly different results, or a person getting vastly different regional results across testing services.
For instance, I’ve been able to build a pedigree which shows the vast majority of my European ancestry is from England, with minor contributions from Scotland and “Europe West” (in that case, German, specifically). Ancestry gives me 16% Scandinavian and 9% Iberian. I only get traces of “Great Britain” (4%) and “Ireland/Scotland/Wales” (2%). MyHeritage gives me literally 18.5% “Irish/Scottish/Welsh”, 10.4% ‘Scandinavian”, and 0% English along with some other trace stuff like Iberian (3.2%) and Italian (2.2%). FTDNA is even weirder where I get 15% “Eastern Europe” as my single largest percentage.
To say that at an invidiual level that this has been unhelpful in understanding my heritage is an understatement, and I hope the gist of this is that people are too ignorant (or dumb) to understand the results. The truth is that at an individual level, the regional results are basically useless. At a macro level when you compare them against others that can be fairly useful, but only in trying to figure out each of these testing services formulas for calculating their regions, which is something they need to be MUCH more upfront about.
I can understand, for instance, people with significant heritage from Great Britain in particular having diffuse results within the region. It’s a mix of Europe West, Scandivania and Iberia (I guess) depending on who settled what and when in that country. Though, I have to say, if it’s such a mix you have to wonder what exactly is being measured to come up with a region of “Great Britain” then. What I don’t understand is how a person like me can be of almost entirely Western European background dating back between 500 to 700 years, and then get 50% of my European heritage coming back as “Europe East.” Europe in parts can be genetically diverse; they aren’t THAT genetically diverse to have my European results literally all over the continent like this depending on the service.
LikeLiked by 1 person
Hi Chesire, thanks for your comment. I understand your reasoning even though I do not agree with all of your statements. Basically because of my inclination to see the glass as half full rather than half empty 😉 Maintaining a critical stance but still aiming for maximizing informational value despite shortcomings and also by way of combining with other insights.
I agree that seemingly inconsistent results being reported for siblings or close family members can indeed undermine confidence in admixture analysis. Even when I suppose that genetic recombination would usually be the underlying cause. The same goes for discrepancies in DNA test results obtained from different DNA testing companies or platforms. Although personally I feel that in order to make a fair assessment each separate DNA test should be judged on its own strengths and weaknesses. Differences in test results can partially be explained by the fact that often a test-specific constellation of different reference populations is being compared to your own DNA. Inspite of similar labeling of regional categories this may still result in different implications on how to interpret for example a socalled “Scandinavian” or “North African” score. Furthermore I always find it crucial to find out how the algorithms being applied by each specific DNA test are to be time framed. Some DNA testing companies (such as 23andme and perhaps Ancestry too after the upcoming update) making an extra effort to zoom into more recent origins while others (especially third party tools) seemingly by default describe a much more ancient (and therefore blurry) timeframe for your DNA.
I have only tested myself with 23andme and Ancestry so I cannot really comment on MyHeritage and FTDNA. However from what I’ve seen the admixture reports from those latter companies are often indeed conflicting with historical plausibility. Your East European score on FTDNA certainly is peculiar given what you know about your background. However in this blog post I am focusing on AncestryDNA results. I do not deny that Ancestry in individual cases can also “get it wrong”. Still I find it quite telling and frankly reassuring that among my 200 African American survey participants only 1 person showed “Europe East” as biggest region in the European breakdown while the overwhelming majority received top ranking regional scores in line with historically plausible lineage from Northwest Europe (see chart 3).
“at an individual level, the regional results are basically useless. At a macro level when you compare them against others that can be fairly useful”
Just to clarify my own position my survey findings are indeed to be understood firstmost from a macro-level. As I have continuously been saying from the start my research goal has been to find “generalized, preliminary and indicative patterns on a group level inspite of individual variation”. This individual variation might occur for valid reasons. As we all have unique family trees some people could for example indeed have significant East European or even Jewish lineage. Then again I’m also not discounting the possibility that Ancestry may be clearly “off” in individual cases either due to overlapping genetics or ambivalent regions such as “Iberian Peninsula” or “Finland/Northwest Russia”. Obviously I cannot make the call in each specific case. However by gathering a wider range of data from several groups of people and contrasting them with each other I feel that we might get closer to what is taking place on a gene-pool level. As I have attempted to demonstrate in chart 2 such an endeavour can already be correlated with historical plausibility.
Again I understand your misgivings about your personal results but going by my survey findings I would actually say that also on an individual level Ancestry has been useful in a majority of cases. Judging for example by the frequency of the main European region in one’s breakdown (see chart 3). Naturally correct interpretation is essential and inherent limitations should be kept in mind. But I find it quite convincing that an overwhelming majority of my Brazilian, Cape Verdean and Hispanic survey participants received top ranking scores for regions in line with Southwest European lineage. While for the African Americans and Jamaicans in my survey historically plausible lineage from Northwest Europe is being indicated for the most part. Admittedly the picture is more confusing for my Haitian samples. But like I said in this blog post this might be a logical result of France being intermediate between Northwest and Southwest Europe. The upcoming update of AncestryDNA will hopefully resolve this unsatisfying matter.
One useful way of corroborating or rather gaining a better understanding of one’s admixture results in my experience is by systematically scanning and filtering your DNA matches on ethnic region (see this tutorial). Zooming in on profiles who are either “100%” African, European, Asian etc.. By also looking at other relevant profile details (birth locations, surnames etc.) as well as plausible regional combination you can often find matches who are for example European-born. As always one should be careful and not jump to conclusions but such matches might then also be aligned with one’s family tree research. For more details see note 4.
“something they need to be MUCH more upfront about.”
Yes generally speaking I would agree. Especially a few years ago I often got the notion that DNA companies just blurt out the results just like that without realizing or caring about what kind of additional questions they might raise or even what kind of emotional reactions they might trigger. Providing a minimum of context is the least thing they could do indeed. It’s often still the customers themselves who need to put two and two together.
The whole framing if you will of admixture analysis can be misleading and is often catering to unrealistic expectations. Specifically in regards to how ancestral categories should conform exactly to a person’s family tree and all the known ethnic lineage it may contain. Even when there are still so many misunderstandings and uncertainties about the genetic underpinnings of ethnicity. And to add to complexity ethnic groups are of course to some extent also social constructs. On the one hand this requires an educational effort on part of DNA testing companies. But frankly I believe that customers have their own responsibility in this matter too and should invest more time in informing themselves about inherent limitations. Compared with other DNA testing companies I actually find that Ancestry does a rather good job at providing helpful sections/pages offering tips and context. For example see this overview:
AncestryDNA Ethnicity Estimate Help and Tips
“you have to wonder what exactly is being measured to come up with a region of “Great Britain” ”
True! Correct interpretation despite potentially misleading labeling has always been one my main concerns. As I mention continuously on this blog the country name labeling of AncestryDNA’s regions is not to be taken too literally but rather as a geographical proxy. Generally speaking Ancestry does provide additional details/maps on how these regions are generally overlapping and not restricted to just one particular country.
I suppose it also depends on what kind of info you’re looking for. Admixture analysis can never be a replacement of your family tree rather it is something which provides additional insight into your background, but at times this can go back many centuries beyond any meaningful genealogical timeframe. I do however strongly believe that group averages for ethnic groups or nationalities can be very helpful in order to know what to expect more or less and make a proper inferral of how you yourself fit in the scheme given also other ancestral clues you might have. Which is why I have been conducting my survey all this time 😉
It will be very interesting to see if the upcoming update of Ancestry’ Ethnicity Estimates will bring any improvement. There is still much uncertainty about it right now. But from what I have learnt sofar the new region “England and Wales” could very well be more straightforward and in line with known pedigree for many people. Supposedly not only because of an overall increase in reference populations and samples (from 3,000 to 16,000) but also because Ancestry will be using a new algorithm which will analyze longer stretches of your DNA (see this link). On the other hand the distinction with other types of Northwest European DNA (Dutch/German) might still remain blurry.
One would wish that in order to illuminate these European admixture patterns for Afro-descendants AncestryDNA would lower the threshold of their genetic communties a.k.a. “migrations”. In such a way that the very detailed migrations being distinguished for Europe would also appear for people who are otherwise mostly African or “New Worlder” genetically speaking (provided they have several IBD matches belonging to that migration of course). Similar in a way to how the latest update on 23andme often resulted in the correct assignment of Great Britain and Ireland dots for African Americans and Portugal and Spain dots for Brazilians, Cape Verdeans and Hispanics.
LikeLike
BTW, here is my full, unscaled European breakdown:
Scandinavian: 16%
Iberian Peninsula: 9%
Low confidence
Great Britain: 4%
Europe West: 3%
Ireland/Scotland/Wales: 2%
Europe East<1%
I can only make possible since of the Scandinavia and of the Europe West. The British and Celtic (Ireland/Scotland/Wales) are too low; the Iberian way too high. I have multiple documented English lines, a few Scottish and Irish, and a few German (Europe West). The Scandinavian coudl easily be Great Britain, and some of my Scottish and Irish lines. For instance, I pretty consistently getting specific Orkney Islands results in multiple tools on GEDmatch.com. The Orkneys were heavily influenced by Norway, more so than the ancient Celts, I believe.
The very (relatively) high Iberian I just can't figure out. Even if we say it represents French ancestry – which I've found is usually picked up under Europe West – I can't find any documented French lines, and definitely nothing recent enough where it wouldn't have been diluted to nothing over time even if you can theorize Norman English ancestry. I assume this has to be an NPE. In any case, these results seem to be unusual for African Americans.
More strange is that I have a higher percentage from the Caucasuses (3%) than Ireland/Scotland/Wales or Europe East. I'd chalk it up to noise, but it's about 9% of my whole non-African heritage. I get about the same percentage of "West Asia" on MyHeritage. I also get about 1-2% South Asian in MyHeritage, DNA.Land, and FTDNA. I'd be very curious about what "Caucasus" is measuring on Ancestry and how it wound up in my European heritage, because it's highly unlikely it comes to me through my African heritage. Ancestry has a Middle East region, I believe, and I could more easily see how I could have gotten something like that, but Caucasus is a mystery.
LikeLiked by 1 person
Frankly I would just wait on the upcoming update on Ancestry as this might very well cause this unexpected “Iberian” score to disappear all together. One other possible thing that might be at play though is recombination. Just thinking out loud but because European admixture generally is at a lower amount for African Americans there might be increased odds of “quirky” recombination. Whereby for example you get to inherit all the DNA segments Ancestry labels as “Iberian Peninsula” from both of your parents. While some of the DNA segments labeled as “Great Britain” might not have been passed on at all. Simply due to random reshuffling of your parents European DNA. These inconsistencies in genetic inheritance are one of the reasons why admixture analysis can never be a perfect reflection of your family tree. On an individual level that is. I imagine that on a group level these inconsistent recombination effects will play out against each other. And it will be more so the overall gene-pool which determines admixture results.
The 3% “Caucasus” is interesting indeed and worthy of follow-up research IMO, despite perhaps being reported as a low confidence region. In my survey among 200 African American results the group average for “Caucasus” was only 0.4%. And a vast majority scored zero for it. However 6 people had similar amounts as you (3%-6%). From what I’ve seen “Caucasus” peaks among Iranians, Caucasians and Turks. But it’s also being reported in substantial amounts for Italians and Greeks. See:
https://tracingafricanroots.wordpress.com/2017/08/04/ancestrydna-results-from-europe/
https://tracingafricanroots.wordpress.com/2017/09/05/ancestrydna-results-from-asia-the-pacific-native-americans/
LikeLike
Fonte, I recently found someone I believe to be of native of Scandinavia: Johan Gustafsson. I was curious that in the same way you found my full African matches, if there is also a way you could sort my list in such a way where it shows people whose only (main) region is “Scandinavia?” Given that this region seems to be only slightly admixed, it shouldn’t be too hard. What I’m really curious about is if this ancestry entirely as a result of the Vikings in Great Britain as I’ve kind of just assumed, or if the high scores for me might be slightly more recent than I realize. Still haven’t found any ancestors from Norway, Sweden or Denmark in my tree thus far, but this makes me wonder if there may have been a recent non-parental event I’m not aware of.
LikeLiked by 1 person
Nice! How many cM’s do you share with this match? From what I’ve seen many Northwest Europeans (Scandinavia, UK, Germany, Netherlands) tend to have a great number of socalled population matches (usually in the 6cM-8cM range) from neighbouring countries and the wider area which are not per se traceable within the last 500 years but more so the result of ancient migrations and shared origins. It’s tricky though to make the distinction between IBS and IBD matches because relatively recent migrations and ethnic inter-unions did also occur within the last 500 years or so.
You can indeed sort your DNA matches on their primary region being “Scandinavia” or rather “EuropeN” after scanning with DNA Ged.com. The excelfile i sent you has three tabs with the European profiles separated already. Open this tab with google spreadsheet if you don’t have excel and then just scroll down to row 7327 where you will find these matches. (it might take a while to load on google spreadsheet). If you look for compatible regional combinations (“Finland/Northwest Russia” aka “UralVolga” and “Europe West” aka “EuropeW”) as well as Scandinavian sounding surnames you might find a few more! Although i suspect most will be white Americans with mixed European lineage, incl. partial Scandinavian roots.
LikeLike
Yes, he is a very distant cousin (6.6cM over 1 segment). Ancestry calculates this to be a 4x great-grandparent as the last common ancestor.
I will try to method you gave me to see if I can find any other Scandinavian matches. Aside from his name and the name of his tree (Släktträd), it was pretty easy to guess he was over there from his trace regions (Finland/Northwest Russia, Europe East, Europe West, Asia East ). Most Scandinavian-Americans are going to have quite a bit of Great Britian and Ireland/Scotland/Wales and over-representation of Europe West in their regions and trace regions, and will usually be absent the Asia East and Findland/Northwest Russia. and often Europe East, too. They will have also Anglicized their surnames and such.
A bit off topic, but have you ever put up your ethnic make-up (Ancestry DNA) here? I’d be interested in seeing it. We are not very familiar with the Cape Verdean disapora here in the U.S. Since I do not match you, I am unable to see your ethnice breakdown on Ancestry, publicly, anyway.
LikeLiked by 1 person
I have already posted a section here on Cape Verdean AncestryDNA results. I will actually update these findings in my upcoming blog post as I have reached a sample size of 100 right now!
Cape Verdean AncestryDNA results
https://tracingafricanroots.wordpress.com/ancestrydna/cape-verdean-results/
Here’s a screenshot of my own results, keep in mind i’m half Dutch as well though 😉
I was most pleased with how Ancestry specified my African side which is predom. Upper Guinean (“Senegal” + “Mali”) as expected. First DNA test I took which confirmed this.
It’s more apparent when I scale my African breakdown to 100% and compare with other Cape Verdeans. It’s not a perfect fit to the group averages but that’s just because of individual variation and probably also because of recombination being more quirky for mixed people.
Also my Dutch side is described very accurately by the 47% “Europe West” but probably i should also add the 7% socalled Scandinavian. Having seen other Dutch AncestryDNA results in the meanwhile i know now i might have been lucky though as many tend to get high “Great Britain” scores as well. On 23andme actually i did get a much higher socalled “British & Irish” score which was nearly equal to my “French & German” with again also some “Scandinavian” thrown in.
Dutch AncestryDNA results (https://tracingafricanroots.wordpress.com/ancestrydna/dutch-french-results/)
I was bit disappointed with the relatively low “Iberian Peninsula” score., as I actually know of some distant Portuguese ancestors in my family tree. But it’s actually exactly the same as on 23&me. And from having seen about 25 Portuguese AncestryDNA results i now understand that this region is not very predictive of Portuguese DNA. The 6% Middle East was the most striking score. Not sure what to make of it yet. On 23andme i have 1,5% MENA but it’s almost all North African.
Portuguese AncestryDNA results (https://tracingafricanroots.wordpress.com/ancestrydna/iberian-results/)
The upcoming update is bound to change my breakdown, Probably for the better on my European side, but i’m anxious to see my “Senegal” decrease haha. From what i’ve seen from a few updated Cape Verdean results i will get more “Mali” in return though. My African trace regions will probably also decrease. I’m curious to know which ones will be left over though. I do think it’s possible i could have some minor ancestral ties to Angola/Mozambique or even the Congo as well.
Btw not visible in the screenshot but sofar i’ve only been assigned to the socalled “Portuguese Islander” migration, which really is a misnomer because it’s actually a genetic community based on closely related Cape Verdeans and their descendants.
LikeLike
Ha! Yes, they seem to have nailed your Dutch ancestry with Europe West; you did get really lucky. It seems often people on either side of the English Channel (southern England, northern France, the Netherlands, and western Germany) can get high scores from just about every adjacent Western Europe region. Like I’ve shared with you before, not only is the vast majority of my European ancestry British, but it’s also heavily, heavily English. And yet when I scale my results, only about 11% of my European ancestry shows up as British, while 46% of it shows up as “Scandinavian” and nearly a quarter of it shows up as “Iberian.” I bet the surprises for the English, though, are much less than the surprises for those on the other side of the Channel given how the whole modern ethos of the English is that they are from a little bit of everywhere in Western Europe. I can see how much more confusing it’d be for a Swede or German or a French person to see relatively high “Great Britain” scores as even in early centuries there was more migration TO Great Britain from the Continent than FROM Great Britain to the continent given it being on the “edge” of Europe.
Anyway, like you, I was really surprised by your relatively high “Middle East” score. I’d expect if you were to have anything unusual that that would be replaced by a high Africa North score. At 7%, that’s significantly more than a fluke trace region. Do you suspect that it comes from your Dutch side or your Cape Verdean side? Have your parents been tested? I’ve been fairly lucky that a few close relatives have tested to narrow things down slightly, though neither my mother nor my father are keen on this ancestry thing, which disappoints me.
So, you are Dutch as in “born in the Netherlands” Dutch, or just of Dutch descent? Was their a significant migration of the Cape Verdeans to the Netherlands, or did you family take a different path there?
LikeLiked by 1 person
Yes for many Dutch people such “Great Britain” scores are unexpected and puzzling as they do not right away make the association with shared Germanic origins across Northwest Europe. It also leads to a lot of scepticism understandably as for most people a high degree of recent English lineage can safely be ruled out, haha.
I’m pretty sure the “Middle East” is by way of my Cape Verdean side. As I have seen similar scores among my 100 survey participants (check my latest blog post). I am actually preparing a follow-up in which I will investigate the DNA matches being reported for 50 Cape Verdeans. Not only mainland African matches but also matches from elsewhere, incl. Sephardi Jewish matches. The Sephardi Jews have a well documented presence in Cape Verde. And from what I’ve seen their DNA is not fully covered by the “European Jewish” region which is based on genetic similarity with Ashkenazi samples rather. Instead many Sephardi Jewish people tend to be described mostly as a combination of “Europe South” and “Middle East” with “European Jewish” usually being minor. I will be trying to find out if there’s any correlation with high “Middle East” scores among Cape Verdeans and getting Sephardi Jewish matches. Although really there could be other ancestral scenario’s at play as well. Principally absorbed Moorish admixture within the Portuguese genepool I imagine. But also direct geneflow from North African captives I suppose.
Eventhough my own “Middle East” score is on the higher side even for Cape Verdeans I was not completely surprised by it. Because I have had similar high scores for either West Asian or North African DNA already on Gedmatch and by other third party platforms. My mother is Cape Verdean btw and my father Dutch, both have not been tested and also are not inclined to do so no matter how much I have pleaded haha.
In case you’re interested to read a good study on Cape Verdean migration into the Netherlands:
Click to access diaspora2016_texto8.pdf
LikeLike
Hi Damon,
Here’s my updated breakdown:
63% “England, Wales & Northwestern Europe”, (“lowerConfidence”:60,”upperConfidence”:70)
17% “Mali” (“lowerConfidence”:0,”upperConfidence”:21,)
8% “Senegal”(“lowerConfidence”:2,”upperConfidence”:25)
4% “Portugal” (“lowerConfidence”:0,”upperConfidence”:4,)
3% “Cameroon, Congo, & Southern Bantu Peoples” (“lowerConfidence”:0,”upperConfidence”:5)
2% “Sweden” (“lowerConfidence”:0,”upperConfidence”:2)
1% “Germanic Europe” (“lowerConfidence”:0,”upperConfidence”:8)
1% “Ireland & Scotland (“lowerConfidence”:0,”upperConfidence”:1)
1% “Spain” (“lowerConfidence”:0,”upperConfidence”:1)
My Dutch side is no longer (quite convincingly) described by “Europe West” but rather by a predominant “England, Wales & Northwestern Europe” score. This region does still also include the Netherlands but is clearly inflated as it goes beyond 50%. Implying I would have inherited more than 10% via my Cape Verdean mother which is simply false. I’ve read that after the update Ancestry has had issues with describing the origins of people of mixed Northern and Southern European lineage, so that might explain this outcome.
I was expecting my European breakdown to get more accurate, haha! Also my Portuguese side does not seem to be adequately covered yet. As the new “Portugal” regional score is exactly the same as my previous “Iberian Peninsula” score, only 4% to be combined with 1% “Spain”. Also a bit disappointed about the disappearance of my 6% “Middle East” and a minimal Asia East score of <1%. It seems that Ancestry has become more squeamish about trace region reporting…Even when mislabeled and obviously to be taken with a grain of salt I did have reason to suspect these scores were indicative of distinctive ancestors for me.
In regards to my African breakdown I already knew my “Senegal” and “Mali” scores would switch in ranking from having seen other Cape Verdean results. Both “Senegal” and “Mali” regions are ultimately indicative of Upper Guinean lineage. And it’s best therefore to simply combine both scores to get an approximate idea. Seen from that perspective my African breakdown arguably has improved. But due to the country name labeling people might get the wrong impression about Cape Verde’s Upper Guinean roots really being much more coastal, incl. Guiné Bissau, rather than interior. So this outcome goes somewhat against historical context. I find that the new “Senegambian & Guinean” category on 23andme has a far more fitting proxy labeling for Cape Verde’s Upper Guinean lineage than either “Mali” or “Senegal”. See also:
100 Cape Verdean AncestryDNA results
This is something which I find very interesting as well! It’s true that Dutch speakers were formerly found much more to the south into northern France (there is still a remaining Flemish part of France!). However genetically speaking there may still be some clear differentiation. I am not aware of any Belgian studies in particular. But I do know for the Dutch context usually a distinction is made between people above and below the rivers (Rhine, Meuse/Maas). For more info & references see:
Dutch, Belgian, French and German AncestryDNA results
Yes that’s peculiar indeed. Although it might still have some flaws I do think for African Americans as well as West Indians in general this update on the European side has been an improvement. At the very least it should make it easier to distinguish between predominant Celtic (Irish/Scotish)) versus English DNA.
LikeLike
Hey Damon, I’ll answer your question in this section as it will be easier to compare notes with my previous results
LikeLike
These are my new results:
In my case it worked out pretty good as you can see! My former “England, Wales & Northwestern Europe” score has practically been replaced by “Germanic Europe”. Which would be a closer fit for the Netherlands. Although I am not sure how it worked out for other people of Dutch descent. Ancestry’s algorithm seems to assign kind of drastically into one of both categories. It sort of flipped them around for me. Also it is still overestimating my Northwest European lineage and underestimating my Portuguese lineage. Probably because of that issue I talked about last year with Ancestry’s algorithm not being equipped to deal with recently mixed European lineage. But i’ll admit a slight improvement in this regard.
I still prefer my 23andme breakdown as it is (very) correctly identifying me as about 50% NW European and around 15% S. European. To which most likely also the 5% “broadly European” should be added. I find that 23andme tends to be more conservative in its estimates than Ancestry. But for the macro-regional categories it is quite exact. I have a strong suspicion that the “broadly” scores on 23andme are forcibly assigned by Ancestry’s algorithm to just one single region. Even when there is not a solid basis for such an absolute assignment. In some cases this works out quite well. I do prefer my 20% “Senegal” above my 14.1% “Senegambian & Guinean” for example 😉 Also if you do not happen to have a complicated background then scores of nearly 100% for one particular region should be fine (even when some people will then complain about the lack of “diversity”, lol). However for people with a more thoroughly & recently mixed background such an approach does not always fit well.
What I also like about 23andme is that their so-called Recent Ancestral Location tool (based on matching strength with 23andme’s customer database) is improving upon Ancestry’s genetic communities. I still have no Dutch or Portuguese migration on Ancestry. Even when I have tons of Dutch & Portuguese DNA matches over there! But 23andme is quite accurately zooming into even provincial level on my Dutch side. And also picking up on some distant German line I was vaguely aware of. African Americans also regularly receive either English or Irish ancestral locations from what I’ve seen. But regrettably African RAL’s are very uncommon still (could be a database issue or threshold set up too high).
Also the one thing I really hate is that Ancestry did not change the name of the “Portuguese Islander” migration into simply “Cape Verdeans”. Because I am sharing profiles with many Cape Verdeans I know for a fact that this genetic community is OVERWHELMINGLY consisting of people of Cape Verdean descent. I really don’t understand why Ancestry finds it so difficult apparently to acknowledge that in appropriate labeling? Especially since Ancestry has set up no less than 12 (!!!) separate genetic communities for the Azores and 4 separate ones for Madeira. On 23andme on the other hand Cape Verde is correctly identified as a RAL for me and also fittingly placed under “Senegambian & Guinean” right now. Plus impressively it attempts to zoom in to even island level. Not completely accurate for me yet. But I understand it’s a work in progress and also dependent on actual customers filling in their family details.
LikeLike
Really nice blog, however we miss this study in your survey.
Genome-wide Ancestry and Demographic History of African-Descendant Maroon Communities from French Guiana and Suriname
https://www.cell.com/ajhg/abstract/S0002-9297(17)30390-7
Thanks for your great work.
LikeLiked by 1 person
Thanks so much for your comment! That study is indeed quite relevant for my survey. I have read it and it contains several fascinating findings. I was already intending to blog about it actually but only after having added more Surinamese results in my survey 😉
LikeLike
” Implying I would have inherited more than 10% via my Cape Verdean mother which is simply false.”
I may have missed this, Fonte, but you know the European geneaology of your Cape Verdean mother for sure? I know that while minor, there is significant British ancestry in islands, right? What do you believe the overestimation of England, Wales, and Northwestern European is actually measuring in you particularly since you say the update got your Iberian Peninsula correct? Seems to me it ate up some of the Scandinavian, which is what happened with me, which is actually more accurate since they were grossly overestimating Scandinavian ancestry in the previous update.
LikeLike
Well I have no absolute certainty 😉 But I do know of at least two Portuguese forefathers from the late 1800’s. I am not completely discounting the possibility of my mother also having distant British or otherwise Northwest European ancestry somewhere down the line (although we have no knowledge of it). As this may indeed be possible given the historical context. But if so it must be really diluted by now and probably to be traced back to the 1700’s or even 1600’s. Rather than having any substantial genetic impact as suggested by my updated results.
The reason I believe my “England, Wales & Northwestern Europe” is inflated is because first of all it is not in line with my known genealogy. But as I blogged about over here I do also think Ancestry’s new algorithm is sometimes having some issues when describing the DNA of recently mixed people. This seems to be particularly true for people with mixed Northwest European and Southern European lineage. I have seen several results of mixed Dutch/English and Italian people who also seemed to have inflated “England, Wales & Northwestern Europe” scores, while their Italian scores are greatly understated. I do not think it’s worth the effort to wonder what exactly it may be measuring as it seems to me that it’s simply something that Ancestry needs to fix. Hopefully the next update will take less time to carry out!
LikeLike
Okay, so you think it may be understating your Portuguese ancestry. Ancedotally, now that I think about it, it seems that people I match with with Southern European DNA doe seem to have what at first glance feel like understated numbers for that ancestry. Rarely do I see anyone over a quarter Italian or Spanish or Portugese, when you’ve expect to find some matches who are at least half of those regions.
It seems quite possible, then, that Ancestry went from being too timid to assign “Great Britian” ancestry to being too confident in assigning this reworked region. I did find it odd that my first version, for instance, went from a quarter of my European ancestry being assigned to the Iberian Peninsula to it now being less than a percentage point. In my mind, I either had none (since I have no known Spanish ancestry) and the first version was totally off, or I’d have enough to be more than 1% since it was originally so high a percentage of my European ancestry.
LikeLike