
1) Introduction
On this page i will attempt to provide some analysis for the African American AncestryDNA results which have kindly been shared with me or else collected by me from public websites. If you want to skip the discussion just scroll to the bottom of the page to see a selection of African American Ethnicity Estimates. I will restrict myself to the African part of these results to be in line with the theme of this blog. In order to enable easy comparison i have scaled the African breakdown to 100% for all, leaving aside any non-African admixture. For more details on my research methodology see the front page of this AncestryDNA section. Follow this link for an overview of all the African American results:
Spreadsheet with African American results
As far as i was able to verify all of these African American results are from persons who have two self-identified African American parents. Louisiana Creoles also being included. For the sake of my research I have made an extra effort to make sure this was the case. Naturally i respect everyone’s right to selfidentify as they wish. Persons with one parent being African-American and the other one being either White or from the West-Indies, Latin America or elsewhere are still mentioned in the sheet but under the heading “Partially African American”. They are however not included in the statistics discussed below. Again beyond the scope of my research no further implications are intended.
Even when limited in number the samplesize (n=350) of my spreadsheet compares favourable to the ones from published DNA studies, which also feature a regional within-Africa breakdown. Tishkoff et al. (2009) has only 98 African American samples for example, Zakharia et al.(2009) offers analysis for 136 African Americans while Bryc et al. (2010) studies 365 African American genomes. Due to scientific advances being made after these studies were published my survey of AncestryDNA results also benefits from a more wideranging scope of possible within-Africa origins: 9 African regions or ancestral clusters being distinguished (see also AncestryDNA Regions). Even when a most recent study, Montinaro et al.(2015), on first sight seems to include a much more numerous African American sample group (n=2023+56) as well as an impressive number of 33 (sic!) African clusters. However its African dataset is still pretty much the same as used in the referenced 2009/2010 studies, featuring only Mandenka and Yoruba samples to cover the whole of West Africa. Arguably its regional within-Africa analysis therefore might also be considered “outdated” when compared with the one provided by Ancestry.com. See also this press release: AncestryDNA Makes Scientific Breakthrough in West African Ethnicity.
The results in my spreadsheet were collected randomly and as far as i have been informed they are from people with family origins all over the United States (see columns P-U in the spreadsheet for USA state origins). The geographical distribution of my African American samples therefore also seems to compare favourably to the studies referenced above. Some of which were disproportionally making use of African American datasets drawn from only a few places. From the outset it has been one of my research goals to explore any possible correlation between the USA state origins of African Americans and the main African regions mentioned in their AncestryDNA results. In particular for people with “deep roots” (going back at least 2 generations on all lines) from the states: Virginia/Maryland, South Carolina/Georgia and Louisiana. As these states are known to have been the main points of entry for Africans being brought over to the USA. I was limited in this attempt by the availability of such results, regrettably most of all from Virginia. Even though a great number of people did mention partial origins from that state.
To conclude this introduction i like to emphasize these are obviously first of all individual results reflecting unique family trees. In my analysis however i will be focusing on the averages to get a better grip on the underlying patterns. Even when the proverbial exceptions to the rule could in fact be one of the main patterns. Furthermore DNA testing at this stage cannot be expected to be 100% accurate in estimating regional origins within Africa. See this page for more disclaimers, especially on how the country name labeling of the AncestryDNA regions should not always be taken at face value. It is also possible that with more African American testresults available you might see additional or different patterns. Even when the current samplesize (n=350) already seems robust enough to at least indicate a basic regional framework for African Americans as a whole. And in fact the regional ranking patterns from my survey appear to be nearly the same as the ones which can be verified using Ancestry’s much larger client database (see “Genetic Census of America” and section 5). I will now proceed with discussing the main patterns i’m able to pick up on from the data. Of course merely expressing my personal opinions & thoughts and not meant to be conclusive in any way  .
.
***
UPDATE
This article was published on 29 November 2015. In 2018 I blogged about my updated survey findings, incl. 515 African American AncestryDNA results.
- Update: Afro-Diasporan AncestryDNA Survey (part 1) (2018)
- Update: Afro-Diasporan AncestryDNA Survey (part 2) (2018)
Please keep in mind that AncestryDNA’s ethnicity estimates have been updated several times now! On this page I am dealing exclusively with AncestryDNA version 2 which was current between September 2013 and September 2018. All matters being discussed on this page are therefore not pertaining to updated results (2018 and onwards). In my opinion especially version 3 (Sept 2018 – Oct. 2019) was a downgrade rather than providing any meaningful improvement when wanting to learn more about one’s African origins. Which is why I discontinued my AncestryDNA survey in 2018 (see this blogseries). The most recent update in 2020 continued the gradual trend of improvement/recovery, started in 2019. But in my opinion this latest update is still not taking Ancestry’s African breakdown beyond what was already achieved in its original 2013-2018 version (see this blogpost for a full review).
Follow the link below to compare with my 23andme surveyfindings for 200 African Americans. This separate section offers my most recent detailed analysis of African American genetics. Many of the themes discussed on this page being revisited. In fact many outcomes were quite similar. Serving as some form of independent corroboration of my main findings.
- 200 African American 23andme results (2018/2019 version)
_____________________________________________________________________________
2) Summary of Findings
***(click to enlarge)

***
The regional within-Africa origins of African Americans have been the central focus of my research. But the total amounts of African ancestry are of course also a very interesting topic, even if at times controversial. This kind of data often gets presented in a restrictive manner, only highlighting the mathematical mean or average of all the results. That’s why I compiled various other statistical measures for the 350 African American results i’ve collected in the chart above. Follow this link for the source data.
***(click to enlarge)

***
When reviewing the statistics i calculated above based on the data entered in the spreadsheet, it’s good to be aware that averages tend to hide underlying variation. That’s why it’s always advisable to also take into account other measures such as the median and also the minimum & maximum values to get a sense of the range of the scores.
***(click to enlarge)

***
The chart above shows how many times each AncestryDNA region was reported as number 1 region with the highest amount in the African breakdown. It should be interpreted carefully because hypothetically if a region is consistently mentioned in second place it will not be shown in the chart. It’s therefore a more pronounced measure to bring forward some of the regional patterns. However it could be useful in hinting towards which African lineages are relatively the least diluted in the African American genepool.
***(click to enlarge)

***
This chart features an additional macro-regional breakdown into “Upper Guinea”, “Lower Guinea” and “Central Africa” which is of my own making. In order to get a strictly “SSA” (Sub Saharan African) comparison i have excluded the region “North Africa” and corrected the other averages accordingly. Making this distinction is admittedly arbitrary and can only produce a rough proxy, given the limitations of AncestryDNA. Still I find it useful because you get to see some patterns more clearly and it conforms with what’s common in slave trade literature. For ethnolinguistical and historical maps from these 3 main regions of provenance see: Upper Guinea, Lower Guinea, Central Africa.
***(click to enlarge)

***
Above chart is showing how my overall sample group of African Americans (n=350) compares with subsets of results of people who mentioned atleast both parents being from either Virginia/Maryland, South Carolina/Georgia or Louisiana. It’s just meant as a preliminary attempt to uncover any variation based on state origins among African Americans. Take note of the minimal samplesize for especially Virginia/Maryland. Also quite a few of the South Carolina/Georgia results were from close relatives (siblings, parents/child). Still it seems likely that some of the already visible trends will also be obtained with larger sample groups and may ultimately be correlated with the documented African origins for these states. For more discussion see section 5.
***(click to enlarge)

***
This last chart shows how the average African breakdown for my African American sample group compares with various other nationalities, incl. two African control groups. It suggests a great deal of overlap and shared regional ancestry within Africa across the Diaspora. Even though the underlying ethnic origins are likely to show more differentiation. Establishing where each African region is relatively more pronounced or instead more subdued might provide insightful clues for the unique ethnogenesis of each nationality being shown as well as for African Americans. For more in depth discussion see: Afro-Diaspora AncestryDNA Results: A Comparison.
_____________________________________________________________________________
3) Observations
Total African Ancestry %’s
Going beyond just the average the first chart i posted above shows the full extent of total African ancestry (29%-100%) among my African American samples. Plus it also mentions that the most frequently observed range of total African ancestry is 80-90%. Despite previous findings there are in fact also African Americans who don’t show any non-African admixture at all in DNA testing. Even though they can still be described as mixed regionally within-Africa. I managed to collect no less than 4 African American results showing 100% African ancestry, which is about 1% of my total sample group (4/350)(edit: after writing this blogpost i have seen two more such results). I verified that these were indeed multigenerational African Americans and not persons with recent ancestry from either the West Indies or Africa itself. Most of the people with the lowest amounts of total African are from Louisiana, but some of these results were also from other states.
***(click to enlarge)

***
I calculated these data also in order to compare with the recently published statistics for “5,269 self-described African Americans” who tested on 23andme. For these 23andme customers an average proportion of African ancestry of 73,2% was calculated. Which is lower than the 77,8% for my African American sample group and also lower than several other averages from published DNA studies. For example Baharian et al. (2015), has 82,1% for a nationwide sample group (HRS, n=1501) and 84,1% for a sample group drawn exclusively from southern states (SCCS, n=2128). According to 23andme itself this discrepancy might be explained by “heavier sampling from California and New York”, among other reasons, such as survey errors. However on 23andme the most frequently observed African proportion range again seems to be 80-90%, as it was also for my sample group. For more details see Bryc et al. (2014) and below histogram based on 23andme results:
***(click to enlarge)

Source “The genetic ancestry of African, Latino, and European Americans across the United States”, Bryc et al., 2014, supplement.
***
Multiregional origins instead of one ancestral “tribe”
• Zooming into the African regional breakdown of my sample group the first noteworthy aspect seems to be: a high number of wideranging African regions being mentioned in each single result. On average the first two biggest African regions being mentioned combined make up barely 60% of the total African amount (see column E in the spreadsheet). While the remaining 40% is usually described in 2-4 other main regions. When the Trace Regions are also included this often leads to nearly all of the 9 African AncestryDNA regions being mentioned in a single result.
On first sight the ranking of the main regions seems to shift all the time for each single result. Which would be pointing towards a high degree of individual variation. However when looking at the summarized totals the regional patterns do become more recognizable. All in all it may suggest that the African American genepool hasn’t stabilized yet. Otherwise you might expect somewhat steadier proportions of each African region being reported in each single result. Instead what seems to be showing up is a great deal of heterogeneity despite African Americans arguably forming an interrelated ethnic group of their own for several centuries. With a relatively small founding population compared with other Afro-diasporic groups because of natural increase already occurring in the mid-1700’s. And additional African geneflow being relatively limited especially after Abolition of the Slave Trade in 1808. See also:
The near absence of any relatively homogeneous African breakdown (featuring just one single dominant African region above trace level) also seems to argue against the possibility of tracing African roots to only one particular region and even less so only one specific ethnic group. As would be the case for almost any Afro-descendant in the Americas, also African Americans appear to be very mixed on their African side. A melting pot with many different African ingredients if you will. It seems natural to assume that with each new generation of African Americans being born in the 1600’s/1700’s/1800’s their within-Africa origins on an individual basis became ever more complex and numerous. Which would explain the highly varied and multi-regional AncestryDNA results of their currentday descendants.
On the other hand Africans tested on AncestryDNA can also show quite varied breakdowns, hinting at ancient migrations within their continent and geneflow between neighbouring ethnic groups. However the regions reported for them on AncestryDNA will almost always be geographically adjacent and generally few in number. Unlike African Americans whose regional scores run the whole gamut from “Senegal” to “Southeastern Bantu” within one single breakdown, showing up in all sorts of combinations and usually featuring 4-6 Main Regions, in addition to a host of Trace Regions.
See also:
• Overall these AncestryDNA results are in line with published DNA studies which already established that historically documented origins from West & Central Africa are convincingly confirmed by the genetics of African Americans. For more details:
***(click to enlarge) (keep in mind this chart was made in 2007: updated information might vary slightly; also Inter Colonial slave trade with the West Indies is not included)

Source: http://abolition.nypl.org/maps/
***
- Ethnic/Regional Origins of African Americans according to the SlaveVoyages Database
- Ethnic/Regional Origins of African Americans according to other historical sources
- Specifying the African origins of the African American Genome
- Specifying the African Origins of the Afro Diasporan Genome (part 1)
- Locating African American haplogroups within Africa
- Locating Afro-Diasporan haplogroups within Africa
***
• Getting more specific “Nigeria”, “Cameroon/Congo” and “Ivory Coast/Ghana” are clearly the three most significant regions mentioned in the AncestryDNA breakdown for my African American sample group. Based on average scores and when scaled to 100% each region covering about 20% of total African ancestry. On average the remaining 40% is composed of firstmost “Benin/Togo” followed by “Mali”, “Senegal” and “Southeastern Bantu”. The “North Africa” and “Pygmy/San” (a.k.a. “South Central Hunter Gatherer”) regions usually representing mere trace amounts, even when possibly offering valuable indications of wider origins from either the Sahel Region or Central Africa.
• Reviewing other statistical measures it appears “Nigeria” might have a slight edge, especially when judging by the frequency it gets ranked #1 in individual results (101/350). Also it seems meaningful that the maximum scores reported for “Nigeria” tend to get higher than for the other regions. It’s the only region for which i have seen original percentages above 50%, the highest being 57% “Nigeria” out of a total of 86% African. While calculated as a ratio of total African it can reach in between 60-70% of total African in a few cases. This might suggest that “Nigerian” DNA markers would be the least diluted within the African American genepool as a whole. The scores for “Cameroon/Congo” however seem to be more consistent judging from its median (19,9% versus 16.9%). Then again unlike “Ivory Coast/Ghana” and “Cameroon/Congo” the socalled “Nigeria” region might be referring more exclusively to ancestry from within that country’s borders and not also in addition from neighbouring countries. Continued discussion in section 4.
• Especially the “Cameroon/Congo” region is defined rather broadly. Which complicates its interpretation for African Americans. This category may very well reflect both Bight of Biafra (Cameroon and southeastern Nigeria) ancestry as well as denote strictly Central African (Congo/Angola) origins. However this distinction cannot be made right now unless further ancestral clues exist. For African Americans both Congolese and Biafran origins could in fact be equally significant. For more details see AncestryDNA regions, and also Igbo results showing high “Cameroon/Congo” scores.
• “Ivory Coast/Ghana” seems to be indicative firstmost of Ghanaian roots. As it is known that unlike Ghana the Ivory Coast played a relatively marginal role in Trans Atlantic Slave Trade. However “Ivory Coast/Ghana” might also be referring to origins from Liberia and Sierra Leone. See also the “African Results” page where the AncestryDNA results of an Ivorian, Liberian and Sierra Leonean person can be seen. Overall it seems the average for this region therefore does not only cover the socalled Gold Coast from slave trade statistics but also the Windward Coast and (part of) Sierra Leone.
• The high scores of “Benin/Togo” are most surprising, given that relatively few captives were shipped from this area to the US. Only about 3% of all documented slavevoyages to the USA left from the Bight of Benin according to the Trans Atlantic Slave Trade database. However on average “Benin/Togo” would be almost 15% of total African ancestry among my sample group and also many high outliers for this region can be observed (maximum being 58% of total African). Generally speaking the consistency of these high scores and also among Anglo Caribbeans seems unaccountable unless you take into consideration that this region is also signalling ancestry found outside of Benin/Togo. Especially among Nigerians and Ghanaians and possibly in particular the Ewe people. In individual cases also other ancestral scenario’s might apply however: such as an early founding effect from the 1600’s and/or early 1700’s when captives from Benin were more prominent among the slave populations in the US and the Anglo-Caribbean. Or rather a relatively late connection by way of the illegal slave trade, taking place after 1808, and known to also have involved the Bight of Benin (e.g. the Clotilde voyage of 1859). For more discussion see:
• “Is “Benin/Togo” really pinpointing origins from within Benin’s borders?“
Less Upper Guinean ancestry than expected?
***(click to enlarge) (for more similar maps see this page)

***
• Central African origins (Congo/Angola) seem to be more pronounced than Upper Guinean ancestry, among my sample group as a whole. Combining “Cameroon/Congo”, “Southeastern Bantu” and “Pygmy/San” (or rather “South Central Hunter-Gatherers”) we get a total share of 28%, while combining the average scores of “Senegal” and “Mali” we arrive at a share of “only” 17%. With a slight remaining majority of 55%, as expected, for Lower Guinea, the area in between Ghana and Nigeria. Obviously the delineation of the AncestryDNA Regions is imprecise, especially for “Cameroon/Congo” and “Mali”. As mentioned already “Cameroon/Congo” might also be signalling Bight of Biafra ancestry. While “Mali” could possibily in part also be referring to Gur speaking peoples from Burkina Faso and northern parts of Ghana, Togo and Benin. But still this preliminary outcome might be meaningful as it often seems the reverse ranking is being imagined by the general public and also many historians.
According to most estimates the proportion of Senegambia in the direct slave trade to the USA would be inbetween 20-25%. To which might be added the estimated share of Sierra Leone of 10-12%. Even when excluding the Windward Coast this would already result in a combined Upper Guinean share of direct slave trade arrivals of about 30-37%. Seen from that perspective especially the “Senegal” scores on AncestryDNA might be seen as lower than expected. On average for my sample group they represent a share of about 8% out of the whole African breakdown. Combining with the “Mali” average of 9,3% still only about half of the documented share of captives from the Upper Guinea would be covered. Although it is likely that some Sierra Leonean ancestry will be described by AncestryDNA as “Ivory Coast/Ghana”.
The estimated combined proportions of West/Central Africa and Southeast Africa in direct slave trade to the United States range inbetween 25-27% (see chart above and also the Slave Voyages Database, 2010 version). Which actually corresponds quite nicely with the 28% Central African share found among my sample group.
When wanting to correlate slave trade statistics with the ancestral origins of currentday populations it seems therefore one should keep in mind additional factors (see also this page). The ethnic demographics of African captives after arrival in the Americas are a big unknown for the most part, especially when multigenerational timeperiods are being considered. Some regional/ethnic groups from Africa might possibly have been better positioned to have more descendants than other groups. For several reasons such as a favourable gender ratio (more females), cumulative growth because of earlier creolization, greater victimization by domestic slave trade, being disproportionally located in areas with less mortality etc., etc. Either way resulting in relatively more DNA markers inherited from these groups to be identified within the current day African American genepool. Inspite of all the limitations of my AncestryDNA analysis it might be that the data i collected is already reflecting some of these demographic processes.
It is also interesting to contrast this outcome with what has been reported in published DNA studies sofar. Naturally because of different African datasets being used the regional definitions will not always be the same or even intercomparable. But very roughly speaking and applying the same 3-way distinction made by myself when possible:
- Zakharia et al. (2009) (scaled to 100% African) :
- 63% Lower Guinea (=“Yoruba”),
- 19% Upper Guinea (=”Mandenka”)
- 17% Central Africa (=“Bantu” + “Biaka” + “Mbuti” +”San”)
- Montinaro et al. (2015) (scaled to 100% African) :
- 69% Lower Guinea (=“Yoruba”),
- 8% Upper Guinea (=”Mandenka”)
- 23% Central Africa (=“South Africa Bantu” + “Bantu Kenya” + “Herero” + “Sandawe” + “Mbuti” +”San”)
While to repeat my research findings based on 350 African American AncestryDNA results (see also this chart) :
- FonteFelipe (2015) (scaled to 100% African) :
- 55% Lower Guinea (=“Ivory Coast/Ghana” + “Benin/Togo”+ “Nigeria”)
- 17% Upper Guinea (=”Senegal” + “Mali”)
- 28% Central Africa (=“Cameroon/Congo” + “”Southeastern Bantu” + “Pygmy/San”)
It seems my Upper Guinean results fall most in line with those of Zakharia et al. (2009). While the difference in Lower Guinea and Central Africa might be explained by a greater range of reference populations utilized by AncestryDNA. Arguably providing more distinction. The 8% Upper Guinean (Mandenka) score by Montinaro et al. (2015), seems rather low, but it is actually the same as the 8% “Senegal” among my sample group. Even when not confirmed it is very likely that this socalled “Senegal” region on AncestryDNA is being underpinned by the very same Mandenka HDGP samples as also used by the two other studies. The difference with my total Upper Guinean share being made by the additional “Mali” region on AncestryDNA.
• Looking more closely at the Upper Guinean statistics on AncestryDNA it seems striking how “Senegal” rarely ends up as #1 main region in the ethnicity estimates (5/350). The number of high “Mali” outliers on the other hand is more noticeable with 20 number 1 rankings among my 350 African American samples. And also the maximum scores for “Mali” tend to get higher than for “Senegal” (52,7% versus 37,2%). Even when the average ratio’s of total African for both regions are quite close (9,3% “Mali” versus 8% “Senegal”). When it comes to exceptionally high scores for just one category it is usually “Nigeria”, “Cameroon/Congo” or “Ivory Coast/Ghana” which get mentioned. Perhaps if “Senegal” and “Mali” had been combined into 1 single Upper Guinean category there would have been more higher outliers. But otherwise it seems to be a sign that these Upper Guinean lineages have been much more diluted than other regional bloodlines from Africa. Many of the higher “Senegal” or “Mali” scores seem to occur for people with deep roots in South Carolina or Louisiana. So there might very well be some variation along USA state origins. More discussion in section 5 and these subpages:
- South Carolina AncestryDNA results (scroll down to section 4)
- Louisiana AncestryDNA results (under preparation)
• The “Southeastern Bantu” region is least likely to produce high outliers. Sofar it was ranked as #1 main region for only two results among my sample group. Still the average contribution from “Southeastern Bantu” is quite steady. Sometimes even considerable individual scores are being reported even if overall it’s clearly a minor region in most cases. The ancestral implications of this region are potentially very wideranging, going by the descriptions given by Ancestry.com (see also AncestryDNA regions). However it seems likely that primarily ancestral connections with Angola and Congo (interior) are being pinpointed. Going beyond any genetic affinity with the Bakongo which would be reflected already presumably by the “Cameroon/Congo” category. Such interpretation would be based on what’s historically plausible and a comparison with the more pronounced “Southeastern Bantu” results of other nationalities in my spreadsheet, especially from the Hispanic Americas where Angolan connections are well documented.
Strictly Southeast African options and specifically Madagascar ancestry are certainly also possible but based on slave trade statistics chances would be fewer. Captives from Southeast Africa are estimated to have been only 1-2% out of all Africans being brought to the USA. While slave trade with West/Central Africa, incl. parts of northern Angola, would be about 25% for the USA according to the Slave Voyages Database. When combined with additional evidence the Madagascar option may be made more plausible though in individual cases. An updated version of AncestryDNA will hopefully provide more clarity.
_________________________________________________________________________
4) Additional Nigerian origins beyond reported by “Nigeria”?
***(click to enlarge)

***
This section will be speculative and based on conjecture to some degree. But it might be useful for illustrating how it can be worthwhile to critically scrutinize the country name labeling applied on each AncestryDNA region. Actually this goes for the labeling of any ancestral categories used also by other different DNA testing companies. In the chart above a comparison is shown between the average African breakdown for 350 African Americans and two African control groups: 24 Cape Verdeans and 7 Nigerians. Obviously the sample size of especially the Nigerians being very limited. However there are already some illuminating regional patterns to observe:
- “Senegal” is only reported at trace level for the Nigerians, while it is clearly the predominant region for Cape Verdeans (see also Cape Verdean Results). This is according to expectation, which should render the 8% “Senegal” score for African Americans more reliable, or atleast add more perspective to it.
- “Mali”, “Ivory Coast/Ghana”, “Southeastern Bantu”, “Pygmy/San” (South Central Hunter-Gatherers) and “North Africa” are also all reported at either trace level or with minimal amounts for the 7 Nigerians. Again in line with what you would assume. And adding more solid basis to the scores for these regions as reported for both African Americans and Cape Verdeans.
- But barely half of the breakdown for the 7 Nigerians is assigned to the region “Nigeria”. While unsurprisingly “Nigeria” is reported at minimal level for Cape Verdeans. The African American average for “Nigeria” being about 40% (20/53) of what’s been reported for actual Nigerians. With some of the higher outliers among my African American results actually scoring up to 70% “Nigeria” out of their total African amount! In other words more “Nigerian” than actual Nigerians, at least in their African breakdown.
- “Cameroon/Congo” and especially “Benin/Togo” are significant additional components for the Nigerians. The averages shown for these regions are not that far removed from the African American averages. “Benin/Togo” being more prominent for the Nigerians and “Cameroon/Congo” more significant for the African Americans.
***(click to enlarge)

Source: Ancestry.com
***
AncestryDNA results for 2 Nigerians (both Igbo)
***(click to enlarge)

***(click to enlarge)

***
By now it should be clear that the genetic origins of actual Nigerians are not fully covered by just only the region “Nigeria”. Additional regions are needed to describe their DNA, in particular “Benin/Togo” and “Cameroon/Congo”. This is actually also very well explained by Ancestry.com itself, as can be seen in the screenshot above and additional disclaimers being given on their website (see also AncestryDNA Regions). Based on their more numerous sample size of 67 Nigerians they mention that the “typical native” would be 69% “Nigerian”. So that’s a bit more than the 53% for the 7 Nigerian results i’ve collected. Aside from individual variation this difference is probably also correlated to the ethnic origins of the samples. Ancestry.com doesn’t specify the ethnic origins of their reference populations but among the 7 Nigerian results within my spreadsheet, 5 are Igbo and 2 are Yoruba. Either way this might be of consequence for the way we should interpret these regions appearing in the results of African Americans (and other Afro-Diasporans).
Afterall it might very well be that similarly also for African Americans the “Nigeria” region may not be reporting the full extent of their genuine Nigerian origins. But rather tends to underestimate them, generally speaking. And the reported “Benin/Togo” and “Cameroon/Congo” amounts for African Americans might in part actually have been inherited by way of Nigerian ancestors who already carried these DNA markers in their own genome, just like the two Igbo results shown above.
Just taking a wild swing at the numbers i wouldn’t be surprised if it turns out that about 5% of the 14.6% “Benin/Togo” average score for African Americans is actually hailing from Nigeria (while another 5 % could actually be from Ghana, the remaining 4,6% “Benin/Togo” then being much more in line with what you would expect). Another 5% might have to be deducted from “Cameroon/Congo” for actually referring to southeastern Nigerian origins. Which would imply that the grand total of “genuine” Nigerian ancestry for my African American sample group could be as high as 30% instead of 20%, on average. Of course this is mere speculation at this stage 😉 Only an update by AncestryDNA might clarify this issue, improving their reference panel with additional West African populations.
The Nigerian roots of African Americans may not yet be known in exact full detail or proportion however many valuable indications have been historically documented. And especially southeast Nigerian (Igbo/Biafra) ancestry is a well researched topic among American historians. For more details and references see:
- Nigerian AncestryDNA results
- AncestryDNA Regions
- The Igbo Connection for Virginia & Virginia-Descendants
_________________________________________________________________________
5) Regional variation according to USA state origins?
***(click to enlarge)
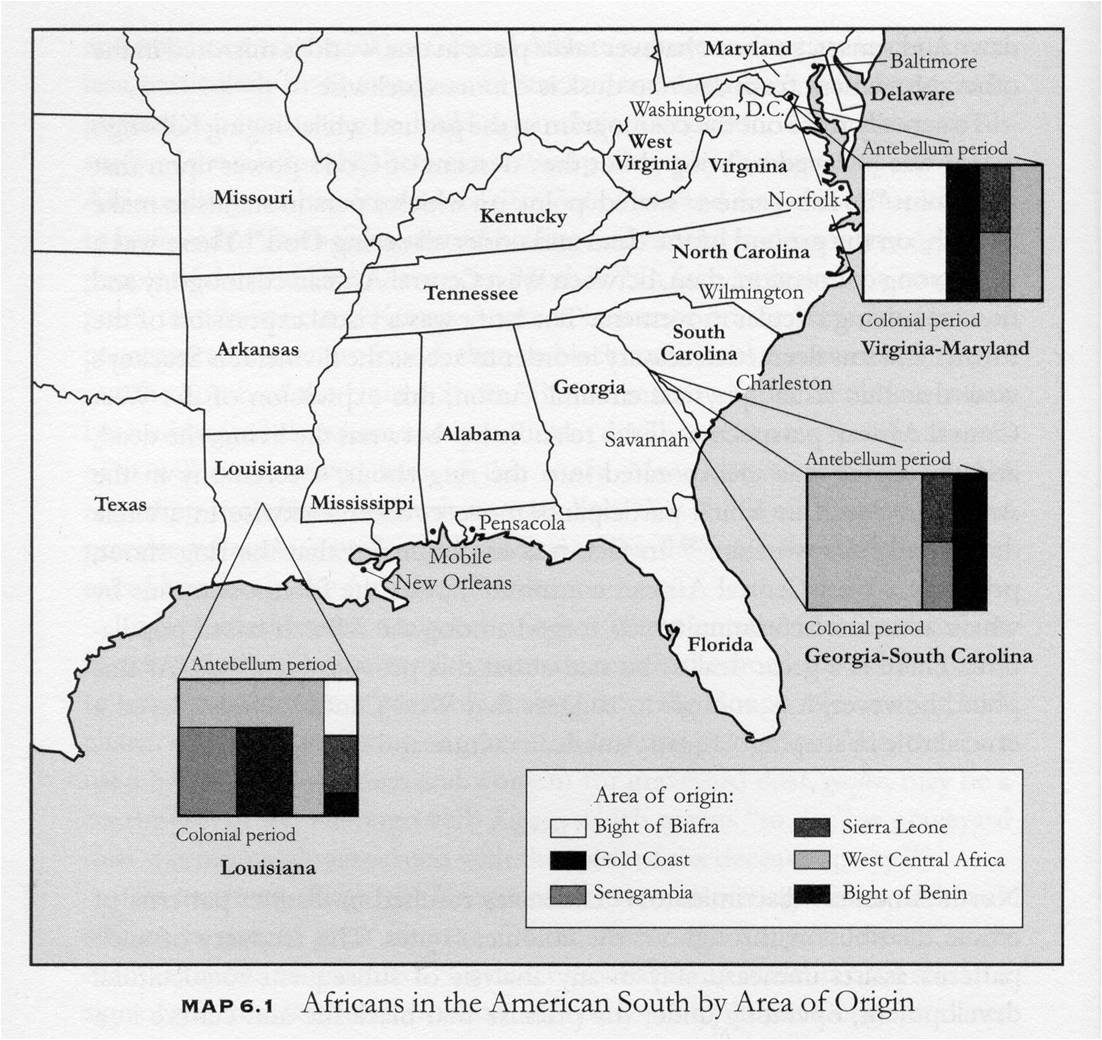
Source: “Exchanging Our Country Marks: The Transformation of African Identities in the Colonial and Antebellum South”, (Michael Gomez, 1998).
***
(click to enlarge)

***
(click to enlarge) (Inter Colonial slave trade with the West Indies is not included)

Source: Trans-Atlantic Slave Trade Database (2010 Estimates) (http://www.slavevoyages.org)
***
Distinct regional patterns can be observed in the Trans Atlantic Slave Trade for each main port of entry into the United States. As can be verified from the charts above. Even when all ports of disembarkation show the same range from Senegal to Mozambique, it is the variation of the regional proportions which may have resulted in localized blendings which stand out from each other. Several historians have written extensively about this topic because it had significant consequences for how nascent African American subcultures developed locally, especially in Virginia, South Carolina and Louisiana. Good grounds perhaps to assume that the within-Africa origins of African Americans could vary as well according to which USA states they are from.
I therefore calculated some additional statistics for the results i have collected for people who were either born or had at least two parents from Virginia/Maryland, South Carolina/Georgia or Louisiana. It was my intention to gather such information especially for people with “deep roots” (going back at least 2 generations on all lines) for those states. However i was limited in this attempt as it turned out that most people of my sample group have mixed USA state origins (133), while for 120 results i wasn’t able to gather any USA state information at all. However for 97 results i was informed of state origins in either South Carolina/Georgia (59), Virginia/Maryland (10) or Louisiana (28). Obviously allowance to be made for possible survey errors ;-). But in several cases i was actually able to verify for myself (after kindly being granted access to view online family trees) that family origins in those states could indeed be traced back for several generations on all lines. Follow these links for the spreadsheets containing their results:
- Spreadsheet with results from Louisiana
- Spreadsheet with results from South Carolina/Georgia
- Spreadsheet with results from Virginia/Maryland
Generally speaking it seems however that few African Americans can trace their origins exclusively to only one USA state when longer time periods are considered. Going back not just 2 or 3 generations but rather 2 or 3 centuries. Around the time when their first African-born ancestors would have been brought over to the United States. This was confirmed to me by a few persons among my sample group who had admirably managed to perform extensive genealogical research into the 1800’s. It is perhaps also better understood when taking into account the high degree of mobility among African Americans throughout US history. Not only in recent times during the Great Migration from the South. But especially because of Domestic Slave Trade, the socalled second Middle Passage into the Deep South.
Check these links for more background info, references and maps:
- The African-American Migration Experience
- The Domestic Slave Trade
- Retracing Slavery’s Trail of Tears
- The African Americans, Many Rivers to Cross – Episode 2: The Second Middle Passage
- The Louisiana Purchase and South Carolina’s Reopening of the Slave Trade in 1803
- To Be Sold: The American Slave Trade from Virginia to New Orleans
- Louisiana: most African diversity within the United States?
Given all these interstate migrations and the wideranging regional diversity of Africans already from the start it perhaps seems futile to find distinct African compositions for any USA state. Even for those states with noted profiles like Virginia, Louisiana and South Carolina. Also i have not yet touched upon the topic of intercolonial slave trade with the West Indies & illegal slave trade after 1808 which would render some of the African origin patterns per state even more complex to disentangle. Especially for Louisiana. Still the data i collected sofar does tentatively seem to point towards a certain degree of regional variation indeed. Even if not to the full extent as suggested by the charts posted above.
***(click to enlarge)
***(click to enlarge)

***(click to enlarge)

***(click to enlarge)

***(click to enlarge)

***
It should be emphasized again that the charts i posted above are in part based on minimal sample size and their interpretation is restricted by the limitations of DNA testing itself. Therefore they are not intended for easy generalizations! What i have observed across statelines is still very much individual variation and a high degree of African diversity showing up in each single result. Being from either Louisiana, Virginia or South Carolina does not imply you will automatically have an x amount of African region A and a y amount of African region B. Neither would any African region be unique or exclusive to any USA state. It’s more complex than that and again also dependent on unique family trees 😉
Still the South Carolina/Georgia data is close to having a fairly representative sample size already. And generally the outcomes seem to reflect localized genepools which on average can show distinct proportions for certain regions. The most noticeable discrepancies seem explainable by way of the documented African origins of each state. Interestingly my own modestly scaled research findings seem to be backed up in most regards by the much greater data resources available to Ancestry.com. More details on the end of this section. But first i will comment on what seem to be the main features of the regional variation i have uncovered sofar in the charts above.
As shown in the first chart the top 3 main African regions observed nationwide are still the same on average for each state. However there are some seemingly telling ranking differences to be noted:
- For South Carolina/Georgia it is no longer “Nigeria” (15,6%) but rather “Cameroon/Congo” which stands out the most with an average ratio of 22% out of total African.
- For Louisiana “Nigeria” is less subdued (17,9%) but still it’s “Ivory Coast/Ghana” which appears most significantly with an average (scaled) score of 22,7%.
- For Virginia, inspite of the minimal samplesize, it seems no coincidence that “Nigeria” is showing up most prominently with an average of 29,2%.
Looking at the 3-way regional breakdown of my own making, it seems only South Carolina/Georgia results stand out for being more Upper Guinean as well as more Central African on average than nationwide. Virginia/Maryland might be expected to mostly conform to the national averages but it seems more surprising that the Louisiana results (sofar) do too. Especially in regards to Louisiana’s Upper Guinean (Senegambia) origins which are always well celebrated. However there are hardly any differences in the Louisiana averages for either “Senegal” or “Mali” compared with the nationwide averages.
The frequency of regions being ranked #1 is perhaps the best indicator of which distinct African lineages may have been preserved the most in each state. For Louisiana it seems especially “Benin/Togo” origins might be more pronounced than the national average. Despite the subdued averages it might still already be meaningful that also the “Senegal” and especially “Mali” outliers are more visible in my Louisiana sample group (n=28) than for African Americans as a whole (n=350).
This also goes for South Carolina/Georgia for which i observed some of the highest “Senegal” and “Mali” scores nationwide. The “Cameroon/Congo” frequency of number 1 region scores looks even more imposing. Given the history of its documented African roots for South Carolina “Cameroon/Congo” might be picking up more so on Congolese origins than on Cameroonian/Biafran ones. Making allowance for individual variation of course. See also these previous blogposts:
- Ethnic Origins of South Carolina Runaway Slaves
- Comparing the Gullah language with other English-based Creoles
I did not (yet) include a piechart for Viginia/Maryland, as its minimal samplesize might result in an overall distorted picture. However it seems telling that out of 10 Virginia/Maryland results sofar “Nigeria” was mentioned 6 times as the biggest region. Perhaps more likely to be based on coincidence but still fascinating also that “Southeastern Bantu” only obtained number 1 rankings (2x) among my entire African American sample group (n=350) in the results of persons from Virginia/Maryland. Both early Madagascar and even earlier Angolan connections for this state being well documented.
Confirmation by Ancestry.com’s “Big Data”?
____________________
A Genetic Census of America
“Using AncestryDNA results from over a quarter million people, the AncestryDNA science team set out to perform a “genetic census” of the United States: a survey of the U.S. using only DNA. Where did the ancestors of today’s Americans come from? Do Americans in the Midwest hail from similar places of the world as in the Northeast, or as in the South?”
Source: Ancestry Blog
____________________
This section can at best only have been describing the beginnings of a very rough outline of any possible interstate variation, due to limited sampling. In this regard it is however very interesting that similar research has also been performed by Ancestry.com recently. And it seems most of my major findings have been replicated by Ancestry.com itself, based naturally on a much larger sample size. If you follow this link to their blog you can select each one of the 26 regions used by AncestryDNA and see its average score within each USA state.
My research findings are not completely intercomparable with this “Genetic Census of America”. The regional averages being given (in decimals) seem to represent the averages for the entire state population regardless of racial/ethnic background, whereas i have been attempting to single out results for people with two African American parents. Also Ancestry’s data seems to be based on the original scores as mentioned in the Ethnicity Estimates whereas i have been scaling the scores in the African breakdown to 100%. The higher averages, shown in dark green, therefore appear to represent firstly a greater overall African American presence in that state. So it’s not surprising that Mississippi turns up as having the highest average for almost all African regions. As afterall it also has the greatest share of African Americans in its overall population (37% according to the 2010 census). This is however not the case for the region “Mali”, “Senegal and “Southeastern Bantu”. If i checked the data correctly these are the only African regions for which not Mississippi but rather South Carolina is being shown with the highest average. I suppose this can serve as some sort of confirmation already that South Carolina has higher than average Upper Guinean ancestry as well as from Central Africa.
By rather reviewing the ranking of all African regions per single state my survey outcomes can be compared more directly with Ancestry’s “Big Data”. It’s quite remarkable that especially the number 1 positions for Virginia, South Carolina and Louisiana are identical with what i’ve found sofar! In fact also the top 3 always consisting of the trio “Nigeria”, “Ivory/Coast/Ghana” and “Cameroon/Congo”, the middle position of “Benin/Togo”, the consistently subdued rankings of “Mali”, “Senegal”, “Southeastern Bantu” and the trace level mentionings of “North Africa”, “South Central Hunter Gatherers” are all very similar to what i have discussed already above. This also goes for the approximate proportions when scaled to 100%. So in that sense Ancestry’s “Genetic Census” seems to be contributing to the robustness of my own findings.
Regional ranking according to Ancestry’s ‘Genetic Census’
***(percentages in parentheses represent African regions scaled to 100%, see also this sheet for calculations)
Virginia:
- “Nigeria”: 0,02301787647 (20,93%)
- “Ivory Coast/Ghana”: 0,02195381044 (19,96%)
- “Cameroon/Congo”: 0,02183056309 (19.85%)
- “Benin/Togo”: 0,01686335024 (15.33%)
- “Mali”: 0,007776231427 (7.07%)
- “Senegal”: 0,007261001474 (6.60%)
- “Southeastern Bantu”: 0,006914652417 (6.29%)
- “North Africa”: 0,00245364888 (2.23%)
- “South-Central Hunter-Gatherers”: 0,001918334611 (1.74%)
***
South Carolina
- “Cameroon/Congo”: 0,02870212366 (20.79%)
- “Ivory Coast/Ghana”: 0,02552819495 (18.49%)
- “Nigeria”: 0,02496276593 (18.08%)
- “Benin/Togo”: 0,0175741489 (12.73%)
- “Mali”: 0,0136826057 (9.91%)
- “Senegal”: 0,01312859621 (9.51%)
- “Southeastern Bantu”: 0,009003610095 (6.52%)
- “North Africa”: 0,002766388013 (2.00%)
- “South-Central Hunter-Gatherers”: 0,002713272555 (1.97%)
***
Louisiana
- “Ivory Coast/Ghana”: 0,02658309405 (19.34%)
- “Cameroon/Congo”: 0,02589036324 (18.84%)
- “Nigeria”: 0,02572959577 (18.72%)
- “Benin/Togo”: 0,01994058628 (14.51%)
- “Mali”: 0,01261197325 (9.18%)
- “Senegal”: 0,01187605134 (8.64%)
- “Southeastern Bantu”: 0,008331560828 (6.06%)
- “North Africa”: 0,003908815789 (2.84%)
- “South-Central Hunter-Gatherers”: 0,002546339517 (1.85%)
African region with the highest average per state
***(click to enlarge)

***
(click to enlarge)

***
(click to enlarge)

***
______________________________________________________________________________
6) African American Results
As far as I was able to verify all of these screenshots below are from persons with two African American parents. This section is intended to illustrate the individual variation among African Americans firstmost. I will be posting results which feature one region or one aspect in extra pronounced degree. My accompanying comments should be taken as informed speculation on my part they’re not meant to exclude other possibilities or simplify complex family histories. I like to thank again all the persons who kindly agreed to share their results with me!
In addition i have also selected some screenshots taken from public websites. As i found them to be of potentially educational benefit for others. I have asked for prior consent whenever i could but regrettably wasn’t able to do so in all cases. I have naturally taken great care to cut away any name details in order to safeguard everyone’s privacy. Apologies in advance to anyone who recognizes their results and is not comfortable with this blog page featuring them. Please send me a PM and i will remove them right away.
For more information on what type of ethnic origins could possibly be implied by these regional breakdowns, see also:
- Ethnic/Regional roots documented for African Americans
- The Igbo Connection for Virginia & Virginia-Descendants
- Louisiana: most African diversity within the United States?
- Ethnic Origins of South Carolina Runaway Slaves
- Comparing the Gullah language with other English-based Creoles
***
“Average” Scores
These two results below show the closest similarity and most likely also closest genetic affinity to the regional averages i have calculated for my 350 African American samples. Especially with regards to their total African amounts and the ranking of the first four regions. An evenly balanced top 3 being composed of “Nigeria”, “Cameroon/Congo” and “Ivory Coast/Ghana”. With “Benin/Togo” being the most significant of the remaining regions. Despite being “typical” in this sense, one might distinguish various other types of “representative” results as well. Afterall there is a great degree of individual variation to be observed. Actually it took me quite some effort to select these 2 screenshots. Highlighting that statistical averages, even when valuable in themselves, should always be complemented with additional information if you want to acquire more insight.
***

***

***
Regionally balanced
Some of these breakdowns below are showing 7 Main Regions, some even all the 9 African regions available on AncestryDNA when also including the Trace Regions. Other results are featuring a very evenly balanced top 4. Actually most results among my sample group show fairly balanced proportions with about 4-6 regions in the main breakdown on average. These are however some of the more extreme examples. Just to provide some contrast with the other results i will be posting which will represent the highest outliers for just one single region.
***
This first result is also noteworthy for showing “Senegal” in shared first position. A number 1 ranking for “Senegal” seems to be quite rare; among my sample group of 350 people it only occurred 5 times. Also the “Southeastern Bantu” score is quite pronounced.
***

***

***

***

***

***

***

***

***

***
100% African
I have sofar seen 6 results for verified African Americans who are of 100% African descent. Not completely impossible to find therefore ;). It seems some reports in this regard have been exaggarated. The first screenshot is from a person from Florida, the second one from Georgia, and the remaining ones all have origins from South Carolina, two of them also selfidentifying as Gullah/Geechee. Perhaps not by coincidence as these states are also often singled out by DNA studies for having above average African ancestry. The latest one being Baharian et al. (2015). This is of course a very limited sample, but the high “Mali” scores for the two persons from South Carolina look quite distinctive. A crucial difference with the AncestryDNA results for Africans seems to be the widerranging scope of the regions being mentioned in the breakdown and also a higher number of these exclusively African regions. See also African results.
***

***

***

***

***
Eventhough this person’s breakdown is quite diverse, the “Ivory Coast/Ghana” score is still very noticeable and in fact it is the highest i’ve observed among my sample group. Aside from signalling origins from Ghana this region might also be suggestive of origins further west from Liberia and even Sierra Leone. All of these 3 ancestral options being quite likely for South Carolina i suppose.
***

***
High “Nigeria”
As discussed above this region might represent the relatively least diluted African lineages among my sample group. Because it is the only region for which i have observed original percentages of above 50%. Plus when calculated as a ratio of total African ancestry, it is the only region to show scores of inbetween 60-70% of total African ancestry. Of course because of individual variation it is also very much possible that other people will score much lower amounts of “Nigeria” or even zero percent 😉
***

***

***

***
The next 3 results no longer show original “Nigeria” percentages of above 50%. However because their total African amounts are relatively lower the relative contribution of “Nigeria” is still very pronounced: in between 64-71%. Atleast two of these persons also having significant Virginia connections. An area where southeastern Nigerian ancestry might very well be the most concentrated within the US.
***

***
This person with a Virginia background, shows the highest relative proportion of “Nigeria” i’ve seen sofar. It’s a very concentrated regional contribution of 71% (48/67) out of his total African breakdown. He also made an excellent Youtube video which can be seen via this link.
***

***

***

***
High “Cameroon/Congo”
This region is somewhat ambigious as it might suggest either origins from Congo/Central Africa or from Cameroon/southeast Nigeria. The first result is from someone who’s from South Carolina. Given the strongly documented presence of Congolese people in that state it seems tempting to assume that in this case Central African ancestry is being picked up on.
***

***
The same amount of 47% “Cameroon/Congo” but proportionally even more significant because it’s more predominant (47/78=60%) with the total African being 78%.
***

***
This breakdown is from someone from Louisiana. Again Central African origins seem most likely given what has been documented for this state (and also for this person’s family parish). Just like the first result only a minimal trace amount of “Nigeria” is showing up.
***

***
Another result from someone with a South Carolina/Georgia connection by way of her parents. The case for Central African origins being implied is made even stronger because of the 9% “Southeastern Bantu” and especially the atypically high 5% “South-Central Hunter-Gathers”. Which in this case would most likely be referring to Pygmy origins, quite possibly already absorbed by Bantu speaking ancestors.
Intriguingly this person’s maternal haplogroup is U6a3b, which can be linked either directly to North Africa or with the Sahel Region. Quite uncommon and therefore providing a valuable ancestral hint. However the score for “North Africa” is less than 1%, highlighting that mtDNA can only give you information about a very limited part of your total ancestry. On the other hand the “Mali” and “Senegal” scores are much more noticeable and might also very well be connected with this person’s maternal lineage.
***

***

***
This person’s original percentage for “Cameroon/Congo” might not be extraordinarily high. However when calculated as a ratio (31/62) it’s exactly 50% of total African. Among the highest for my sample group.
***

***
High “Ivory Coast/Ghana”
Judging from the few African results i’ve seen this category is very predictive of both Ghanaian (Ga) and Ivorian (Akan) origins. However in addition also Liberian and (southern) Sierra Leonean ancestry is being described by this region. Making the distinction at this stage cannot be done yet, unless other ancestral clues exist.
***

***

***

***

***

***
High “Benin/Togo”
The considerable average score for this region (14-15%) and especially the many high outliers, as shown below, are one of the main surprises from my survey of African American AncestryDNA results. In fact aside from “Nigeria” some of the highest outliers i have observed were for this region. Calculated as a ratio of total African ancestry, it can get as high as 58%. Which implies a relatively “pure” regional lineage. This is rather unexpected given the relatively low documented number of captives arriving from this area. About 3% of documented slavevoyages to the US left from the socalled Bight of Benin. This number is however not including Inter-Colonial trade with the West Indies, nor illegal slavetrade after 1808. Also it’s important to be aware that this region is not always pinpointing origins from strictly within Benin’s or Togo’s borders. For further indepth discussion see also “Benin/Togo” region.
***

***

***
This result shows the highest relative contribution of “Benin/Togo” for my sample group. Calculated as ratio of total African ancestry it’s 58% (43/74). There were 6 other results who showed a ratio of above 50% “Benin/Togo”. Four people scored more than half of total African ancestry for “Ivory/Ghana”. While for “Cameroon/Congo” and “Mali” there were only 2 results with regional ratio’s above 50%. “Nigeria” seemingly being in a league of its own as it had 18 such results and is the only region to show a relative share of total African ancestry of above 60% and up to 70% in a few cases.
***

***

***

***
High “Mali”
“Mali” is more difficult to interpret than “Senegal” (see also AncestryDNA Regions). Besides the country Mali also Guinea Conakry should be the primary ancestral location hinted at. I imagine the DNA markers associated with this region could perhaps also be found among selected ethnic groups in Sierra Leone, Guinea Bissau or even Senegal itself. However it is possible that at times also ethnic origins are being pinpointed beyond Upper Guinea, and more so from neighbouring areas of Mali to the southeast. Eitherway it seems meaningful that despite similar averages of 8-9% it is “Mali” for which i observed the highest number of outliers and not “Senegal”. Also the maximum scores for “Mali” tend to get higher than for “Senegal”, implying less dilution. Again interpretation at this stage is perhaps too premature. But it might suggest that Upper Guinean origins beyond Senegambia in a strict sense, either from the deep interior or from areas to the south, are relatively more important for African Americans.
***
This result below is quite extraordinary for not only showing the highest “Mali” percentage among my sample group of 350 African Americans, but also the secondhighest score for “Southeastern Bantu”. The person behind the results has family origins from both Texas and Louisiana.
***

***

***
Also a notable score of 2% “North Africa” in this breakdown. Which might very well be correlated with the high “Mali” score. Even if not per se so.
***

***

***
These results below are from a person from Maryland, highlighting that high scores for this region are by no means exclusive to any state. Still sofar i have observed the greatest number of “Mali” being ranked number 1 among people with South Carolina & Louisiana origins (11/20).
***

***
High “Senegal”
This region has produced relatively very few high scores among my sample group. Also the maximum original score of 25% “Senegal” is rather subdued and implies a relatively greater degree of dilution when compared with most of the other regions, incl. also “Mali”. It is very striking that sofar the only results i’ve seen with “Senegal” ranked number 1 (5/350) were mostly for people with origins from South/North Carolina, with the highest regional ratio coming from Louisiana, as expected perhaps. Even when the “Senegal” averages for these states are pretty much in line with the nationwide averages, about 8-9%.
The samples being used to underpin this region are most likely Mandenka (see also AncestryDNA Regions). It will be very interesting to see what happens with these “Senegal” scores if also Wolof samples are being utilized. It might be that the ethnic composition of socalled Senegambians being brought to the USA has been misjudged by historians based on incomplete documentation. With the relative contribution of people located more towards the interior and also to the south being underestimated.
***
The first two results are from a father and son with origins from South Carolina. The first breakdown also featuring a very evenly balanced top 4, incl. a rather high “Mali” score. The second screenshot showing the highest original percentage for “Senegal” i have observed among 350 African American results.
***

***

***
Again a result for a person from South Carolina and also featuring an evenly balanced top 4. Highlighting that “Senegal” usually does not reach dominating proportions even when it is mentioned as the region with the highest amount in the breakdown.
***

***
This result however being a notable exception. “Senegal” is being mentioned as the only main region above trace level, and when calculated as ratio of total African ancestry it represents a share of 37% (16/43). By far the highest i’ve observed, the second highest regional ratio being 26,9% of total African. The person behind the results is of well documented Louisiana Creole background on all family lines.
***

***
High “Southeastern Bantu”
This region is very broadly defined, however for most people i imagine Central African origins (Angola, interior Congo) are being referred to (see also AncestryDNA Regions). Even when other ancestral options are also still possible. Only an update of AncestryDNA might bring clarification. It is clearly one of the least significant regions overall, however unlike “South Central Hunter-Gatherers” and “North Africa” it does frequently appear above trace level. And at times even with considerable percentages in between 10-25%. It is very uncommon though for this region to be mentioned as the biggest region in the breakdown. This only happened twice among my sample group of 350 African Americans.
***

***

***

***

***
High “South Central Hunter-Gatherers”
In my spreadsheet i’m referring to this region as “Pygmy/San” as these are most likely the reference populations which were being used to single out the DNA markers associated with this category. It is most likely representing an ancestral component which was inherited from Bantu speaking ancestors who are known to have incorporated geneflow from Pygmy’s (Biaka and Mbuti) but also the San already many centuries or even millennia ago (see this sheet for an overview of Ged-Match results for various Bantu populations). In this sense it might be indicative of wider Central African ancestry even when it is itself almost always shown as Trace Region. In fact for almost a third of my sample group this region is not showing up at all, while the highest percentages i’ve seen, 5% & 4%, only show up for less than 10 results. Even scores of 2% or 3% already being relatively high.
***
This breakdown is quite exceptional and rather puzzling as it has “South Central-Hunter-Gatherers” above trace level, while “Southeastern Bantu” and “Cameroon/Congo” are mere Trace Regions with lower amounts even. It might be due to a quirky recombination or else some other ancestral explanation might be valid. As in fact i have also observed some West African AncestryDNA results featuring this “South-Central Hunter-Gatherers” region (see also African results).
***

***

***

***
High “North Africa”
Overall this region showed the lowest average of all 9 African regions on AncestryDNA for my African American sample group. More than half of all African American results i’ve seen show zero “North Africa”, while only about 30 results have 2% or more. Many of them from Louisiana. The highest outliers scoring 4% “North Africa”, which happened only twice. From what i’ve observed among other nationalities this region seems to strongly correlate with Hispanic or rather Iberian origins. When reviewing the data from Ancestry’s “Genetic Census” this can be confirmed because the highest average for this region is appearing for New Mexico while all the other states being mentioned with higher averages are also known for having numerous Hispanic populations. In this sense any Trans Atlantic Slave Trade connections are out of the question. However there are also other ancestral options involving West Africans already incorporating minor “North African” components in their genome, this goes especially for the Fula people but could also be the case for other ethnic groups from the Sahel Region. For more detailed discussion see also section 4 of this page.
***
This breakdown shows the highest “North African” score i’ve seen. Eventhough it is only mentioned as a Trace Region, the reliability should still be quite high as it’s based on distinct DNA markers when compared with the other African regions. The results are from a person with Louisiana Creole origins. It is very interesting in this regard that there are several ancestral options which have all been documented for this state: Spanish or even Canarian ancestry (Isleños); Fula (a.k.a. “Poulard” or “Peul”) ancestry from Upper Guinea, and even unmitigated Moorish ancestry from Mauritania (the socalled “Nar”).
***

***
This breakdown is notable in that the 3% “North Africa”, which is already exceptionally high for African Americans, is showing up for a person of above average African descent. Perhaps making it more likely that this minor component will be associated with the 14% “Senegal” and the 3% “Mali” rather than any distant Iberian/Hispanic ancestry. Also the 4% “South Central Hunter-Gatherers” is quite pronounced btw.
***

***

***
Youtube
I always enjoy seeing how other people react to their new DNA test results and how they interpret them. Youtube has many such videos of people discussing their results. Below is just a small selection. For even more videos follow this link:
***
***
***
***
***(she’s African American despite the name 🙂 )
***
*** (also check out her follow-up video she made almost two years afterwards)
***
***
***
***
***
***
***

Fonte,
Ancestry just released a surprised update, I assume because it’s Black History Month here in the U.S.. They now have over 80 African American communities. I’m now in “Early Viriginia African Americans”, “East Texas, Arkansas, & Louisiana African Americans”, and “The Carolinas, Maryland & Virginia African Americans” when I was only in two before (Virginia/Maryland/South and South Carolina).
It’s funny, because the previous update actually nailed my deep South Carolina roots much more accurately. Linking South Carolina all the way up the coasst to Maryland makes the community much less accurate than before given how most slaves in South Carolina didn’t come from places further up the coast, but straight from Africa/the Carribean).
That said, the new update did in fact find a community that I’ve been finding in my matches, but have no idea of where it’s from. The new “East Texas, Arkansas & Louisiana” community nails all of these relatively close relatives from the Texarkansas area I’m finding, but who I have no idea how we connect. I suspect it’s one of those “non-parental events.”
LikeLiked by 1 person
Very interesting! I read about this quickly but have not yet found the time to look into it closely. How many people are being mentioned in that “Early Virginia African Americans” group?
True but I believe especially during the 1700’s there was considerable domestic slave trade with Virginia and even further north. See this link:
http://www.inmotionaame.org/migrations/topic.cfm?migration=3&topic=2
Just speculating but perhaps because they had been adapted to US surroundings already (at times being multi-generationally US-born already!) their survival and reproduction ratio was greater than Africans who got directly imported. It is known that not only directly after arrival but even in the first two or three years the mortality among Africans was very high, even more so because of the labour regime in SC I suppose.
I once blogged about the ethnic origins of runaway slaves in SC and i found it striking that Igbo and also US-born captives were quite frequently mentioned:
https://tracingafricanroots.com/2015/05/25/ethnic-origins-of-south-carolina-runaway-slaves/
LikeLike
I am familiar with the migration from the north, but it really does destroy the distinction between the West-Central Africans that got shipped into Charleston (South Carolina) and the more West African slaves that went to Virginia.They did end up mixing quite a bit, but South Carolina still maintains a lot of West-Central African culture that was not assimilated by the migration from the north. The Gechee/Gullah of coastal South Carolina I’d bet are heavily, heavily weighed towards “Cameroon, Congo, & Southeast Africa Bantu.”
Anyway, I guess I’m not understanding your first quesetion. What do you mean by “how many people” are mentioned in the “Early Virginia African Americans” group? Do you mean which Ancestry regions? In that case, what’s featured for me are “Benin/Togo”, “Cameroon, Congo, & Southern Bantu Peoples”, and “England, Wales & Northwestern Europe.” It appears to be centered on coastal colonial Virginia and Maryland, and the northeastern part of North Carolina. If you’re asking which side of my family is in it, confusingly, it’s both, which is why it’s much less predictative than before.
“The Carolinas, Maryland & Virginia African Americans” features the same regions for me as the previous, though this one seems to pick up mostly my paternal ancestry, which would make since since this region includes the Carolinas, which is where most of my paternal lines come from.
I forgot to mention that for this last one, not only am I in the “East Texas, Arkansas & Louisiana African Americans,” but the very specific sub-migration of “Arkansas-Louisiana Border African Americans.” This one seems to be super-acurate, as it’s nailing down not just my paternal side, accurately, but very close matches on my paternal grandfathers line. This is probably one of the few times AncestryDNA has found anything for me that I’ve found very interesting as it relates to my African ancestry, as it revealed what HAS to be a “non-parental event” I’m guessing occured with my great-great grandfather. I’ve been wondering why I’ve found zero matches who share my surname, and this has kind of explained why, though I’ve not been able to find what my “true” surname should be since my close matches can’t find the connection.
LikeLiked by 1 person
Yes, this greater Central African imprint was quite noticeable during my AncestryDNA survey among people from SC, (n=68) incl. 14 Gullah. I intended to make a separate blog post about his finding but never got to it haha. Will be interesting to see how “Congolese” on 23andme does as an indicator of this pattern.
See also this spreadsheet:
https://docs.google.com/spreadsheets/d/1_sjsM56m-0ewGu1RlWbg2MtEwhWJrcbc4sRnvpkUquU/edit#gid=2109627619
I meant the number of Ancestry customers who got assigned to this migration. It should say so along with how many actual DNA matches you have in that group.
Cool! Are saying this is on your direct paternal line? if so getting your haplogroup tested on 23and could be helpful too!
LikeLike
There are over 145,000 customers in this group, the second largest of my three groups; Early Virginia African Americans is first with over 440,000, but that makes sense given that this is probably the earliest African American migration in the colonies.
And, yes, the “East Texas, Arkansas & Louisiana African Americans” sub-migration seems to be picking up direct paternal roots. I’ve done a ton of the free haplogroup estimations, and all point to a very common and broad West African/sub-Saharran haplogroup, so I don’t feel the need to spend additional money to test this as I’m pretty confident of what it is. My maternal haplogroup is actually a common European one, and this didn’t surprise me given how much more European ancestry I have on my mother’s side. It’s the opposite of most African Americans who are more likely to have a European haplogroup on their paternal line and an African one on their maternal line.
LikeLiked by 1 person
Interesting! Have you been able to trace back to any fully European maternal ancestor already? You are right that European maternal haplogroups are less common than paternal European haplogroups. However I still find it intriguing that this proportion of European maternal haplogroups seems to be among the highest compared with other parts of the Diaspora. Thereby constituting a distinct feature of African American genetics I suppose. According to several studies it’s in between 8-10% (e.g. Stefflova et al. 2009. or Deason et al. 2012). Which might imply that generalizations about the nature of European admixture do not always apply as we all have individual family trees. Even if you personally do not have a European maternal haplogroup you could still have a European maternal ancestor through either your paternal family lines or those through your maternal grandfather, your maternal greatgrandfathers etc.
LikeLike
Oh, yes. My mother has known about her most recent white ancestor on her paternal side forever. At least one of my 2x great-grandfathers was full white and whose ancestry traces back to England mosty (with some German); his partner was mostly white, though of course she’d have been labeled black; we’ve been unable to find who her European parent was, however, probably a slave owner. My mother’s mother’s line is a bit more murky, though I’d not be shocked to find full white ancestors that far back on that line either. It must be remembered that my mother and her siblings DNA is only slightly over half African. Also on my maternal one of my great-grandmothers had a white father who was predominantly English and Scottish ancestry.
I wasn’t very surprised to find my paternal haplogroup.
LikeLiked by 1 person
Yo I have great news to tell you 😁
I just found out from My Father that his father is from Alabama & his father is from Alabama & his father is from Gabon 😁
Please tell me
Which part of Africa did they sent off slaves to Alabama ?
Which tribe of Nigerians were sent off to Alabama ?
Which slaves of Benin/Togo were sent off as slaves ?
I think I know why I don’t have a African American Alabama community is because on my father’s line they weren’t in the United States for a long time. My forefathers came to America recently & that can explain why I don’t have a strong match.
LikeLiked by 1 person
That’s great! See this section on documented regional & ethnic origins for African Americans. Do keep in mind that for the Deep South, incl. also Alabama the Domestic Slave Trade would have been more important than direct Trans-Atlantic Slave Trade.
Getting in contact with your closest DNA matches might give you more clarity on this newly uncovered Alabama connection.
https://tracingafricanroots.com/tables-on-ethnicregional-background/usa-2/
LikeLiked by 1 person
Hey, I’ve been doing research so is it true most Black people in Alabama come from the Upper South then it is directly from Africa ?
LikeLike
http://www.encyclopediaofalabama.org/article/h-2369
LikeLiked by 1 person
As far as most Black Alabamian slaves were born in other states & that most Black Alabamians come from Virginia, North & South Carolina, & Maryland. Do Black Alabamians come from the IGBO or Yoruba ?
I found more from my dad that my grandfather is 2nd generation African-American on his mom side & that his mom is 1st generation American Alabamian
What does this mean for me ?
My grandfather’s biological father is a Runaway slave
Are Runaway slaves directly from Africa & got off the boat or are they American born slaves ?
LikeLike
Hey Dezzy, haha loads of questions again! Don’t take this the wrong way but I cannot keep on answering them for you. I have a busy schedule so I’m sure you’ll understand. You have to put in some effort as well. I know you have a researcher’s mind so that should not be a problem 😉
Let me just give you one tip: with these kind of things it is not always going to be binary. In other words it’s not always an “either this or that” question. It can be several things all depending on context.
As i have already told you I really believe the best thing you can do is to spend more energy into looking for your African DNA matches. This is really essential to achieve progress in your quest to know more about your African roots. Otherwise you will only be running round circles.
LikeLiked by 1 person
Hey Felipe, I was wondering whether Yoruba or Fulbright/Fulani is more likely for African Americans. My father’s maternal haplogroup on 23andme was L3f1b1. According to 23andme “Today the haplogroup is commonly found among the Yoruba and Fulbe populations of western Africa, and in African-Americans who are descended from them”. Given that Nigeria was a high percentage for both of us, I definitely thought this was possible. I originally thought it was mostly Igbo because I have early Virginia roots (according to Ancestry.com) but I know the Fulbe and Yoruba were also enslaved. I was just curious which group I am more likely to be descended from being an African American with Mississippi, South Carolina, North Carolina, Louisiana, and Virginia roots.
LikeLiked by 1 person
I think first of all you need to make a distinction between autosomal admixture results (which attempt to describe your ENTIRE ancestry) versus maternal haplogroups which can only represent your direct maternal line. And in most cases will not cover more than 1% of your ancestry.
Furthermore both haplogroups as well as admixture results are generally speaking not exclusively tied to just one ethnic group or even just a few ethnic groups. Instead they are suggestive and indicative of various ethnic possibilities. Historical plausibility as well as DNA matches may be useful then to single out certain possibilities. You cannot limit yourself therefore to either Yoruba or Fulani. It’s usually never “either this or that” but much more complex. See this blog post for greater understanding:
Fictional Family Tree incl. African Born Ancestors
https://tracingafricanroots.com/2015/01/20/fictional-family-tree-incl-african-born-ancestors/
Let’s say your maternal haplogroup indeed is shared with Nigerian Fulani. You will have to keep in mind then that the Nigerian Fulani themselves are only relatively recently settled in Nigeria. They migrated there from Upper Guinea during the last 3 or 4 centuries or so. It is quite possible that any shared ancestor between you and a Nigerian Fulani actually lived in Upper Guinea himself. With one of his relatives being caught up in Trans Atlantic Slave Trade and ending up in North America, while another relative migrated eastwards into Nigeria.
Going by admixture results such an ancestral connection with Nigerian Fulani is however quite likely to be indicated by “Senegambian and Guinean” and not “Nigerian! So you see, even having one direct Fulani maternal ancestor (representing about 1% of your ancestry and quite likely included in your “Senegambian & Guinean” score) does NOT contradict the likelihood of a majority of your “Nigeria” score being associated with Igbo and/or other related ethnic groups from southeast Nigeria.
See also this page for actual Hausa-Fulani results on 23andme:
https://tracingafricanroots.com/west-africa-part-2/
LikeLike
That’s interesting and now that I think of it, I’m sure some or most of the Nigerian ancestry is Igbo. It might be mostly Yoruba if I were Brazilian, not to say that I might not have Yoruba ancestry as evidently I may have it and/or Fulani ancestors. From looking at about thirty other 23andme reports, I notice that my Congolese is pretty high (15.1). I also have a lot more South East African (2.6) percent than what most African Americans seem to possess (often below 1 percent from what I’ve seen). Given that I am 0.9 percent Southeast Asian and the Malagasay are descended from East Africans and Southeast Asians would it be reasonable to attribute my somewhat atypical percentages to Malagasay ancestors. I understand that slaves were also taken to Mozambique though. I guess some of that Swahili East African ancestry could emanate from slaves from Mozambique. Or is Madagascar more likely for African Americans? Also, what do you think might be the countries placed in the broadly West African section?
LikeLiked by 1 person
Yes from what i ‘ve seen sofar your Central/ Southeast African scores indeed seem to be higher than average! About the odds of Malagasy lineage versus Mozambique see this chart (for more details see this page: https://tracingafricanroots.com/maps/southeast-africa/
LikeLiked by 1 person
Hey Felipe! I’ve been pouring over your blog since I discovered it earlier this week. I’m African american but my results seem strange compared to your samples (limited sample size I know). I’m curious what your interpretation of my results would be:
Ancestry (pre-2019 update)
-Benin/Togo. 27%
-Cameroon. 24%
-Mali. 20%
-Senegal. 7%
-Nigeria. 4%
-African South central Hunter gatherers 2%
23andme (post 2019 update) rounded
-Nigeria. 24%
-Ghanaian, Liberian, Sierra Leone 21%
-Senegambia and Guinea 9%
-Congolese. 7%
I also have 2.5% Congolese and Southeastern African and an unexplained .2% asian (filipino and indonesian split), I’m wondering if it could indicate Malagasy heritage. My maternal family is from central Mississippi and Virginia. No info on my dad’s side as we’re estranged. I do have two confirmed Igbo DNA matches and one match with roots in Guinea and Benin on 23andme. I’m wondering if my combined results indicate Ewe heritage or what your thoughts were if you’re interested in helping me tease things out.
LikeLike
Hi Asher ,
To me both your Ancestry and 23andme results appear to be in line within the wider variation of African American results I have seen.
I cannot tell you that much yet about your updated 23andme results as i need to collect more data. Keep your eye out on upcoming blog posts! Although any final report might take several months still. The minor trace amount of Southeast Asian DNA is very commonly reported on
23andme from what I’ve seen. I think a single diluted Malagasy family line could very well be historically plausible for many AA’s. However you need to corroborate with additional clues (DNA matches, family tree research, local history etc.)
“Benin/Togo” could possibly indicate Ewe lineage, however this is just one possibility out of several other ones! See this blog post for how to make more sense of your “Benin/Togo scores.
https://tracingafricanroots.com/2018/03/04/benin-togo-also-describes-dna-from-ghana-nigeria/
LikeLike
https://you.23andme.com/published/reports/1e0958749fc640acbfd61235820126f3/?share_id=da5ebad3036549b9
I’d love to participate. Please let me know if the link works. If not, I’ll send it again. All four of my grandparents were born in Mississippi. On Ancestry.com, my genetic communities are Early Virginia African Americans (Very likely probability according to the site ), Mississippi and Louisiana African Americans (possible probability according to the site and it specifically gave me Southwest Mississippi African Americans), and Kentucky, Tennessee, Georgia, Alabama, and Misssissippi African Americans (possible in terms of probability and it specifically said North Central Mississippi.
https://you.23andme.com/published/reports/f9bc0c44751f468faacb5a14c381dbb2/?share_id=2f3c47561d524df6
Here are my dad’s 23andme results and ancestry genetic communities. Three of his grandparents were born in Mississippi and one was from Georgia.
LikeLiked by 1 person
I forgot to include my dad’s genetic communities on Ancestry. Sorry about that. His genetic communities are early North Carolina African Americans (he scored very likely in terms of probability and Kentucky, Tennessee, Georgia, Alabama, and Mississippi African Americans (specifically North Central Mississippi African Americans). Once again, Ancestry scores his likelihood of having ancestry from here as very high.
LikeLiked by 1 person
Thanks Taylor! I have added both results in my sheet under: “MS (4gp) (TP)” and for your father: “MS (3gp), GA (1gp) (TP’s dad)”
Going by original scores your “Congolese” score is indeed the highest sofar! This also goes for your “Southern East African” score. As well as your father’s total Southeast Asian score. Of course the number of people included in my survey is still quite small though! I will be collecting more results to get a better grip on the data. This will be a gradual process so don’t expect any new blog posts any time soon 😉 It might very well take me several months or even more than a year to complete!
In the meanwhile you can still check the spreadsheet though to see how you compare with the ongoing group averages. It’s quite big so scroll all the way to the right and the bottom to see the whole thing. Keep in mind that I have scaled the African breakdown to 100% by using this formula: original regional score / total African score. This way everyone’s African breakdown can be inter-comparable.
https://docs.google.com/spreadsheets/d/1KpSzfMggWiV_9cy5ZKh1hDqSlIRbthfYkz6dvwX-Mts/edit#gid=743710999
Right now I have sorted all results on the share of combined Central & Southeast African scores (column L). You can see that the current group average is 15%. While yours is 21.1%. So that’s somewhat above the average although still within the range. It will be interesting to see how this range develops. Like I said I need more data for better interpretation. However right now it is already clear that 23andme might be underestimating your Central/Southeast African lineage. Keep in mind especially the “Broadly West African” scores as well as the “Broadly Sub Saharan African” scores which have not been assigned yet out of precaution because 23andme does not have enough certainty to assign them to specific regions.
LikeLiked by 1 person
Fonte, looking at your earlier results, I’m noticing the same thing. While Ancestry is ridiculously underestimating Nigerian ancestry of African Americans, it seems that 23andMe might be slightly – though significantly – overestimating it given what we know about the trade. Do we know the region their “Nigerian” region covers, and what their samples are/how many?
LikeLike
Based on my survey findings among African 23andme customers the “Nigerian” region does indeed also cover DNA found outside of Nigeria’s borders. In particular it seems among Gbe speakers as well as western Cameroonians. See also this map:
The only info I have managed to find about the samples used by 23andme is shown in this overview. Would have been helpful if they also specified the number of samples per region, but yeah… I have a feeling that aside from the Yoruba and Esan samples also many Igbo samples have been used , to be found among the 23andme customer samples and referred to as simply “Nigerian”.
LikeLike
Yes, that would be helpful to specify the samples per region. 23andMe specifies the groups used, and Ancestry actually specifies the number (111) they took from their Nigeria region, but neither specifies both. lol We can be pretty sure given where they have their “Nigerian” region centered, however, that it’s definitely not representative of the southern half of the country. Whereas we can gather from the groups chosen that 23andMe’s Nigerian region is centered on the south of the country. What is clear is that they are measuring two significantly different sections of the population in Nigeria, though.
LikeLiked by 2 people
https://customercare.23andme.com/hc/en-us/articles/212169298-Reference-Populations The population-specific reports included in the Nigerian reference population:
LikeLiked by 1 person
Thanks! Still no specification of the number of samples per region. Plus I have a feeling this is not a complete overview of the backgrounds of their Nigerian samples. However it already serves to practically confirm that 23andme indeed uses Igbo samples. Anambra & Imo states being overwhelmingly populated by Igbo people. Edo state would indicate that also Bini/Edo samples are included. While Lagos and Ogun state most likely refers to Yoruba samples. Although Lagos, like any other megacity, has people from all over the country I believe.
LikeLike
Felipe, I found my first African match. He’s Tikar from Cameroon! I’m very excited and looking for more matches. Our largest segment was 8.6 centimeters. He took Ancestry and like me uploaded the results to Gedmatch. According to Gedmatch, we’re estimated to share a common ancestor 7 generations ago (technically it said 6.8). I’m very excited.
LikeLiked by 1 person
Great news! I’m glad for you! Do you have any matches in common with him on gedmatch? Triangulation might very well be helpful in placing this lineage on a certain family line of yours.
LikeLike
I know it’s not through my maternal grandmother because he didn’t match her. I’m trying to narrow it down between my dad’s parents and my mom’s father now.
LikeLiked by 1 person
Looking over the charts showing regional variation in African origins in North America which you posted, I actually do not find the high Benin/Togo all that surprising. While Beninese/Togolese slaves were few if you take North America as a whole, they appear to have been a more substantial presence in Gulf states (Mississippi, Louisiana) and even somewhat more present than the national average in Georgia. It is the near absence of Beninese/Togolese slaves in Virginia, the Carolinas, and the Northeast that are dragging the average to 2% of all enslaved Africans. I would actually not be surprised if some of the higher outliers for Benin/Togo came from the Gulf states.
LikeLiked by 1 person
Trans-Atlantic Slave trade with the Bight of Benin was indeed more noticeable in Louisiana. Valuable records exist of enslaved persons who were identified as Nago/Yoruba, Arrada/Fon and even Hausa. Which is quite unique for the USA context, as far as I am aware. See also:
https://tracingafricanroots.wordpress.com/2015/09/25/louisiana-most-african-diversity-within-the-united-states/
However the absolute numbers involved were still rather small. Around 3,000, same as for Virginia and South Carolina actually. Proportionally it may be different indeed. However for Louisiana you also need to take into account that Inter-Colonial slave trade with the West Indies was almost as important as direct Trans Atlantic Slave Trade. While the Domestic Slave Trade with the Upper South (1 million in total) is likely to have brought in much more people as those former flows combined (around 25,000 according to estimates below).
Overall result being that the regional African origins of people from Louisiana are often quite similar to African Americans from other parts of the USA. At least from what I have seen. I suspect it is mostly among Creoles that you will see more distinctive regional patterns. I hope to investigate this eventually.
LikeLike
After looking through your information. I must call your attention to something from a Social Science perspective…… It is NOT okay to name “Louisiana Creoles” “African American’s”.
LikeLike
I understand your concern. Constructive criticism is always welcome (when done in a respectful manner). However I do not feel any changes on my part are needed. Please carefully reread my introduction:
Please keep in mind that this blog post was written in 2015 based on my survey efforts which started in 2013 already. The reason I chose to also include Louisiana Creoles in this section is obviously because of my research purposes. Nothing more, nothing less… As I was not always certain how people themselves would self-identify. But I still wanted to include Louisiana results in my overall African American survey.
I certainly agree that Louisiana Creoles are a distinctive group with their own particular history. However for the sake of my research the criteria which mattered for my USA survey participants were 1) being of multi-generational African descent on both parental sides and 2) having multi-generational family origins within the USA on both parental sides.
Just as a general disclaimer I should also point out the following:
I am aware that ethnicity can be a sensitive topic. My research is on the one hand purely scholarly. But it also stems from my deep fascination with all parts of the Afro-Diaspora as well as a profound love and respect for all of its vibrant & diverse cultures. I do not condone the misuse of my research for identity politics! And I will also not allow my blog to be used as a platform for any divisive speech or extremists.
DNA testing can be very educational and may have many positive effects. However in some cases it may also be abused by people with bad intentions.
Can DNA Ancestry Testing Make You More Racist/Tribalistic? (Scientific American)
LikeLike
Wow. There is soooo much information on your page. Thank you so much for detailing all of this for us.
LikeLiked by 1 person
Hello, I just wanted to ask a question because I’m very interested in hearing your thoughts. What is your opinion on the company “African Ancestry Inc.”? Do you think their tests would be worth it just to know at least 1 tribe you possibly descend from? Do you think it’s fine/reasonable for us African-Americans (and other Afro-diasporans) to just connect to one or even three particular ethnicities/“tribes”, for example, Mende or Temne, even though those are just a few of all of the ones that make up our African heritage/ancestry? I’m very interested in hearing your response/opinion, you really go above and beyond with your work, and seem to know a lot about this type of stuff. Thank you so much for everything that you do on this site. ^^
LikeLiked by 1 person
Hi Velocity, thanks a lot for the appreciation!
That’s a good question. I know for some people connecting to only one particular line from their multi-ethnic African heritage can be a very enriching experience. Other people like to get a more in-depth understanding of their entire ancestry. Which can be done for example by combining your regional admixture results with autosomal African DNA matches. Really I think it is all up to your own preferences how far you want to take your research and what you aim to achieve with it.
One thing I am very adamant about is that you should always try your best to understand your DNA results and not just take them as gospel. Naively taking your results at face value and just going for quick and easy answers could very well lead to gravely misidentifying the main lineages of your African ancestry, which would be tragic indeed inspite of all good intentions.
Of course I know not everyone will be eager to read all the small print or do a deep dive of genetic studies etc.. Still you should atleast make a minimal effort getting to know the basics of DNA testing, genealogy and also learning about African history. All these things will help improve your understanding and interpretation of your DNA test results which do provide helpful clues as long as you’ve done your homework.
I have serious reservations about the methodolology being used by African Ancestry. I do not believe that the ethnic accuracy they are advertising is possible based on genetic markers associated with your parental lines (haplogroups). This can easily be verified when actual Africans take their test. Because from what I have seen African Ancestry rarely gets it right for them.
I find that the whole premise behind their test is greatly misleading for people without a clear understanding of genealogy, genetics and the way ethnic groups have always been intermingling across generations. Unique markers which can be used to distinguish neighbouring and interrelated ethnic groups simply do not exist.
I still admire African Ancestry’s pioneering role in providing DNA testing services catered to Afro-descendants. But I regret that they have not made much progress in updating or expanding their services. Also their pricing is frankly way over top when you have so many other cheaper and much more helpful and reliable alternatives available.
For example this year 23andme released a new tool which allows a pretty accurate matching (based on autosomal DNA) with 25 African ethnolinguistic groups (see this blog post). To be sure this tool is not 100% accurate and it still needs plenty of refining. But atleast 23andme is honest about any shortcomings and is also aiming to improve. The lack of such an attitude with African Ancestry is the reason I have never blogged about them. However a well-respected African American genetic genealogist published the following article about them:
Just Say No: African Ancestry’s DNA Tests
LikeLike
How did Liberians end up with a relatively, large amount of “South Central Hunter Gatherers”?
LikeLiked by 1 person
It is most likely a genetic component inherited from ancient times. Keep in mind these scores were most prominent during a previous version of Ancestry (2013-2018). Ancestry has adjusted their algorithm since then, which is why ancient components like this are mostly smoothed out.
See this old blogpost of mine for more details and discussion:
LikeLike
For years, my 23andme results had me at 4.5% Biaka pygmy. Also, on a (now defunct) site called DNALand, they also had me at nearly 5% “Aka pygmy”. And when my father’s brother got his maternal line traced by African Ancestry (I know a lot of people have issues with that company), it traced back to the Balanta of Guinea Bissau, but they sent him a separate letter telling him they also found a percentage of pygmy DNA. And when I got my paternal line traced, African Ancestry actually called me and said my results were “rare” because my Y-DNA went back to Gabon. I don’t know if any of this is true, or if they were just mistaken, but believing it was true made me so happy.
LikeLike
Did you get any specification for your African regions on 23andme? From my observation their so-called genetic groups are one of the most solid ways of corroborating ethnic African lineage. Along with African DNA matches (autosomal). Especially when the shared DNA size is considerable (>10 cM) the matches are IBD (Identical By Descent: also shared with one of your parents) and also consistent with other clues. On Ancestry you will usually have greater odds of finding African matches than on 23andme. Because 23andme has a limit on the number of matches.
LikeLike
Do you mean a specific country or ethnic group? They last updated my results in September of 2023. They gave me “Igbo” for the Nigerian region, “Liberia” for the Ghanaian, Liberian and Sierra Leonean region and “Fula and Wolof Peoples” for the Senegambian and Guinean region. The old version of 23andme actually gave me “Biaka pygmies”, but that was a while back, like 2013 and a few years after that. Also, I didn’t mean to say my “y-dna”; I’m a woman. My brother took the “Patriclan” test for me LOL
LikeLiked by 1 person
Yes that’s what I meant. Although you can never be 100% sure there is a very high likelihood that you indeed have Igbo, Liberian and Fula/Wolof ancestors. Because afterall this is completely plausible for African Americans! And in line with documented presence of these people in North America. Therefore certainly worthy of follow-up research. For example you can further corroborate this by finding associated DNA matches. Again on Ancestry you will probably have a better chance of finding them.
Now when it comes to your socalled “Hunter-Gatherer” DNA. This is in fact also common for other African Americans, albeit always with a very minimal %. However like I said already this is most likely an ancient component which you have inherited either by way of Bantu speaking Central African ancestors. Or, possibly in addition, by way of ancestors from presentday Liberia and surrounding countries. It is essential to be aware that presentday populations in those areas have absorbed so-called “Hunter-Gatherer” DNA in their genepool a very long time ago already. So well beyond any geneaologically meaningful timeframe. I’m talking about at least 1000 years ago. But quite likely also several thousands years ago.
I would say the chances of ever finding a recent and verifiable ancestral link to a modernday “Hunter-Gatherer” population like the Biaka are very slim. Although 23andme does provide fitting genetic groups: “Baka and Biaka”, “Mbuti people”, “Hadza & Sandawe” and “Khomani San”. But from the hundreds of Afro-Diasporan results I have seen sofar I never saw anyone get such a genetic group. That already is quite telling I suspect.
As far as I know there have not been any documented Pygmy captives involved in the Trans-Atlantic Slave Trade. Of course this does not rule out that some individuals might have been carried over in exceptional cases. However the minuscule numbers involved would certainly not have resulted in the widespread occurence of socalled “Hunter-Gatherer” DNA found across the Afro-Diaspora. Keep in mind that both Pygmy and Khoi-San populations are living in very remote areas and have had a minimal population size throughout their history.
They are therefore not really historically relevant to understand the African lineage of the Atlantic Afro-Diaspora. The reason DNA testing companies almost always include their samples in their reference panels is more so to do with the fact that they have very distinctive DNA markers. But again I have to stress these DNA markers are actually also found (in minor degree) among neighbouring, more “mainstream” populations in West and Central Africa. And for these latter populations it can very easily be demonstrated that they are in fact the recent and verifiable ancestors of African Americans and other Afro-descendants across the Atlantic Diaspora.
LikeLike
On 23andme, it wasn’t like a genetic group like how it is listed now, it was under a category called “Central African” something, but it wasn’t SCHG, even though that category existed too. And when you clicked on it and it showed what regions or people fell under it, the only thing they had was Biaka (and maybe Mbuti) pygmies.That is how I interpreted it, and I remember saying “why doesn’t this include the Khoisan”. But, on DNALand, they actually gave me “Aka pygmy” as a genetic group, I mean straight up. I believe everything that you’ve said here and I don’t truly believe I have a recent pygmy ancestor; the only reason I’m trying hard to explain what the results were is because I don’t want you to think I’m lying.
I also thought it was interesting that I have an identical twin, and our results are nearly the same, but I always get 4% more Central African than she does and she always gets 5% more East African, and on some sites, Southern African, than I do. On another site (called Gencove, also defunct now LOL) the difference in our DNA was between Central and Southern Africa. On Family Tree DNA, I have 4% more “Atlantic Equatorial Africa” and “Southern Congo Basin” and my total Central Africa is 14% and my twin sister’s is 10%. They also have me at 70% west African and my twin at 74%. And on another DNA site (Maybe MyHeritage or Living DNA. I have uploaded my DNA/paid for many DNA tests), I was very shocked to see that 4% difference go from “Central Africa” to “North Africa” and of course, my sister didn’t get any of that “North Africa”. I don’t understand that or the Central African thing. We are Identical twins, so how could that be so?
LikeLiked by 1 person
Haha no worriez! Of course I believe you 🙂 I am just trying to say that the labeling of ancestral categories in DNA testing should not always be taken too literally. If you tested with 23andme before 2018 then you would indeed have gotten a score for “Central and South African”. But this was greatly misleading because 23andme did not use any Bantu speaking samples for this category. Instead it was measuring genetic similarity with their Pygmy and San samples. See also this page:
About the difference in results with your identical twin sister, that’s quite puzzling indeed! However from what I’ve read these could be some of the explanations:
LikeLike
Like you said, no one should take these DNA tests too literally, but I really wanted to believe I was connected to the Biaka pygmies because I wanted some really old DNA and I like that they live in the rainforest LOL
About the difference in my and my twin’s DNA: I think you’re 100% correct. I tested with 23andme and she with Ancestry, so that probably explains most of the difference. That is a great article you linked about twins. Thank you very much for responding to me. All of your work on this site is so interesting and so thorough; there is so much to absorb. And everything is very well written. You put words together so beautifully.
LikeLiked by 1 person
Thanks a lot for the appreciation! I am glad to hear my blog can still be of service. And you are absolutely right the Biaka are wonderful people! DNA testing is still improving. So I do believe that you will get more solid ground about this part of your DNA in the near future.
LikeLike