
In October 2015 I published my first preliminary survey findings based on 23 Cape Verdean AncestryDNA results (see this link). Right now, almost three years later, I have managed to collect a sample group which is four times greater. Consisting of no less than 100 AncestryDNA results of fully Cape Verdean-descended persons! Even though this quadrupled sample size is obviously still limited it will most likely provide a greater insight in the various ways how “Caboverdeanidade” can be described. Genetically speaking that is. And obviously when applying the regional AncestryDNA format, with all its enhanced features as well as its inherent shortcomings 😉
***

Click on this banner to reach Cape Verde DNA, Inc: the biggest online community of Cape Verdean Genealogy & DNA enthusiasts! On Augustus 4 & 5 a pioneering Cape Verde DNA and Genealogy Conference will be held! See this link for more details.
***
In this blog post I will discuss the main differences with my previous findings from 2015, which were focused on the African breakdown solely. And in addition I will also present some new statistics and background information on the European and other non-African origins of Cape Verdeans as reported by AncestryDNA. Below an overview of all the topics I will cover:
- Background details of my 100 Cape Verdean survey participants
- To be Cape Verdean is to be mixed?
- Upper Guinean roots = “Senegal” + “Mali”
- Beyond Upper Guinea: valid outcomes or misreading by AncestryDNA?
- European breakdown reflecting mostly Portuguese ancestry?
- “Africa North”, “Middle East”, “European Jewish” and other minor regional scores
- Upcoming update of AncestryDNA’s Ethnicity Estimates
Follow these links for my complete survey data & research methodology:
Table 1 (click to enlarge)
***
Chart 1 (click to enlarge)

This frequency of regions being ranked #1 (regions with the highest amount in either the African or European breakdown) is perhaps the best indicator of the main ancestral components for my Cape Verdean survey group. However only in an extra pronounced degree. For more nuance see the group averages in the next sections.
***
Screenshots of individual results (rightclick and open in new tab to enlarge; island origins shown below)
More charts and analysis when you continue reading!
***
1) Background details of my 100 Cape Verdean survey participants
Table 2 (click to enlarge)

***
I would first of all like to extend my heartfelt gratitude to all my survey participants! Without their kind willingness to share their results with me my research would not have been possible! In fact aside from giving me access to their results many people also shared useful and very interesting details about their family history with me in PM’s. As far as I was able to verify through such contact or also through public family trees and other publicly available information all my survey participants are of fully Cape Verdean descent. Although I did not have absolute certainty in all cases (see column AK in my spread sheet).1
That is going back on all lines for at least 2 generations. In other words all 4 grandparents being Cape Verde-born. Migration plays a key role in the Cape Verdean experience and therefore “Cape Verdean” is somewhat loosely defined in my survey. For the sake of my research and just to be practical I had to draw the line somewhere. But I never intended for this 4 grandparents criterium to be seen as any kind of absolute measure of Caboverdeanidade.2 Especially for multi-generational Cape Verdean-Americans I had to be lenient in a few cases and also take into consideration how some families amazingly already have been established in the USA for more than 3 generations! Provided that all 8 great grandparents or all 16 great-great grandparents were Cape Verde-born these persons still count as 100% “Cape Verdean” in my book. At least genetically speaking and within the context of my survey 😉
***

***
Again despite having been provided with abundant background details for most of my survey participants I do not pretend to have an exact or 100% complete overview of their origins! Afterall some people might also themselves not be fully informed or even misinformed about their recent ancestry. Still the background details I have been able to collect are very insightful in themselves already I believe. Possibly with wider implications even in some aspects. Table 2 highlights that Cape Verdean-Americans form the majority of my survey group, numbering atleast 60 out of 100. Not that surprising given that Ancestry.com is an American company and the USA is often said to host the biggest part of the Cape Verdean Diaspora.
Interestingly the greatest group of these Cape Verdean Americans still is only 1 generation removed from having Cape Verdean roots. That is 34 survey participants have two Cape Verde-born parents, while being USA-born themselves. For 19 USA-born persons in my survey it was rather a gap of two generations with their Cape Verdean roots. As they also had USA-born parents, who in turn had Cape Verde-born parents. Very intriguingly atleast 7 persons are included in my survey who confirmed to me that they were of fully Cape Verdean descent on all lines. Despite having USA-born grandparents and even USA-born great-grandparents in a few cases! A testament to the admirable ways Cape Verdean American communities have been kept together across the generations! Even when such consistent endogamy on all lines might not per se have been the rule.
Going by public family trees and what was confirmed to me in PM’s the earliest birthdate of a USA-born Cape Verdean-American ancestor is 1871, among my survey participants. Which is quite extraordinary in itself but I suppose even earlier birthdates might be forthcoming given diligent family tree research. Also keeping in mind the longstanding presence of Cape Verdeans in America: the first Africans to migrate to the USA out of their free will and even at times on self-owned ships! A truly awe-inspiring saga!
Aside from my Cape Verdean American survey participants I still did manage to also include atleast 27 Cape Verde-born persons within my survey. Although a minority they still make up more than a quarter of my survey group and provide a very useful benchmark to verify my overall findings. Their island origins within Cape Verde also being more diverse on average. Cape Verdean Americans mostly hailing from Brava and Fogo as well as São Nicolau and Santo Antão. But these Cape Verde-born samples also being from Boavista, Maio, Sal, Santiago and São Vicente. Many of these Cape Verde-born survey participants are however also long term citizens of the USA. And may therefore naturally also self-identify as Cape Verdean-American, even if I have not labeled them as such in table 2 😉
As a great illustration of the extent of Cape Verdean migrations my survey also contains the results of persons who are part of the Cape Verdean Diapora in the Netherlands, Portugal, Brazil, Angola, Guiné Bissau, São Tomé & Principe, Senegal and even the Ivory Coast. I actually did not always include these persons in my main survey findings as some of them were only partially of Cape Verdean descent (like myself). This goes especially for people of recently mixed Angolan and Guinean descent. Again only for the sake of my research purposes: establishing the main ancestral components within the Cape Verdean genepool.
Genetic Communities a.k.a. Migrations on Ancestry
Figure 1 (click to enlarge)

Because of the ongoing growth of Ancestry’s customer database the number of people being assigned to their various migrations or genetic communities is constantly increasing. At the moment of writing this blog post the most recent number being mentioned for the “Portuguese Islander” migration was no less than 5,797! As an indication of relative endogamy most Cape Verdean Ancestry testers will tend to have hundreds if not thousands of matches within this group. I suppose it also highlights how DNA testing has become really popular among Cape Verdean-Americans!
***
In table 2 we can also see the frequency of “migrations” a.k.a. genetic communities my survey participants have been assigned to by Ancestry. This migration feature has been integrated within Ancestry’s Ethnicity Estimates since 2017. It is based on having a strong genetic connection (measured by IBD matches above a given threshold, possibly >12 cM) to a certain group of people. These genetic clusters or networks of interrelated people are given greater context by way of their average ethnicity scores, family trees and implied migration histories. Even when it does have its shortcomings I do find that Ancestry’s migration tool is reasonably predictive and quite useful! It provides a great way to sort out your Cape Verdean related DNA matches. Even if many of these matches might actually be of mixed descent and also not all of your Cape Verdean related matches might be covered.3 For more details see also:
- Help & Tips in regards to Ancestry’s migration/genetic community tool (Ancestry)
- Genetic Communities™ White Paper (Ancestry)
- Clustering of 770,000 genomes reveals post-colonial population structure of North America (Nature, 2017)
As expected the socalled “Portuguese Islander” migration shown in figure 1 is appearing for a greater majority (62/88=70%) of my survey participants. Even when for 23 people no such assigment was given, inspite of being of verified Cape Verdean descent! I suppose this outcome is indicating that Ancestry’s migration tool is still a work under progress. I also find it rather unfortunate that such a potentially misleading name has been chosen for this migration. I strongly urge Ancestry to change the labeling of the socalled “Portuguese Islander” migration into “Cape Verdeans”. This will be much more appropriate given that from what I have seen the vast majority of people being assigned to this genetic community share common Cape Verdean lineage from the last 4/5 generations or so. This network of DNA connections arising because of kinship which originated in Cape Verde itself aside from occasional overlap with actual Portuguese islanders (Azores & Madeira) who already have separate migrations in place on Ancestry.
In addition a considerable number (16/88) of my Cape Verdean survey participants are also part of the “Portuguese” migration, indicative of recent Portuguese lineage to be traced back within the last 4/5 generations or so. Which is in line with relatively recent Portuguese ancestors from either the 1900’s or the 1800’s. Even when earlier Portuguese ancestry from the 1400’s-1700’s will not be included this outcome is very useful therefore. Interestingly for one single survey participant from Brava also the “Spaniards, Cubans, Dominicans & Venezuelans” migration appeared along with “Portuguese” and “Portuguese Islander”. Most likely suggesting Spanish lineage although perhaps also caused by partial Portuguese or Galician ancestry among his DNA matches within this genetic community. Even when it is true that the European origins of Cape Verdeans also include some degree of non-Iberian lineage, it is probably quite telling that I did not encounter any other European migration among my survey participants. Especially given that this migration tool is arguably most fine scaled for the European continent (aside from the USA). The European regional breakdown on AncestryDNA offers more clues on the degree of Portuguese lineage for my Cape Verdean survey participants. I will discuss this topic further in section 5.
The only other migration being reported aside from “Portuguese Islander”, “Portuguese” and “Spaniards” was “African Caribbean”. This only happened once though for one single survey participant (born in Santo Antão). Somewhat surprising and atypical. But more easily understood when keeping in mind that a strong genetic connection can also be the result of reverse geneflow. In other words instead of suggesting a possible Caribbean ancestor for my Cape Verdean survey participant it is probably much more likely that several Caribbean people belonging to this genetic community either have recent Cape Verdean ancestry or shared African or Portuguese lineage.4 The latter scenario perhaps most plausible generally speaking. Given the well documented history of Portuguese contract labourers in the Caribbean, often hailing from Madeira. I will revisit this theme of unexpected Caribbean matches in an upcoming blogpost in which I will analyze the DNA matches being reported for 50 of my Cape Verdean survey participants.
2) To be Cape Verdean is to be mixed?
Figure 2 (click to enlarge)
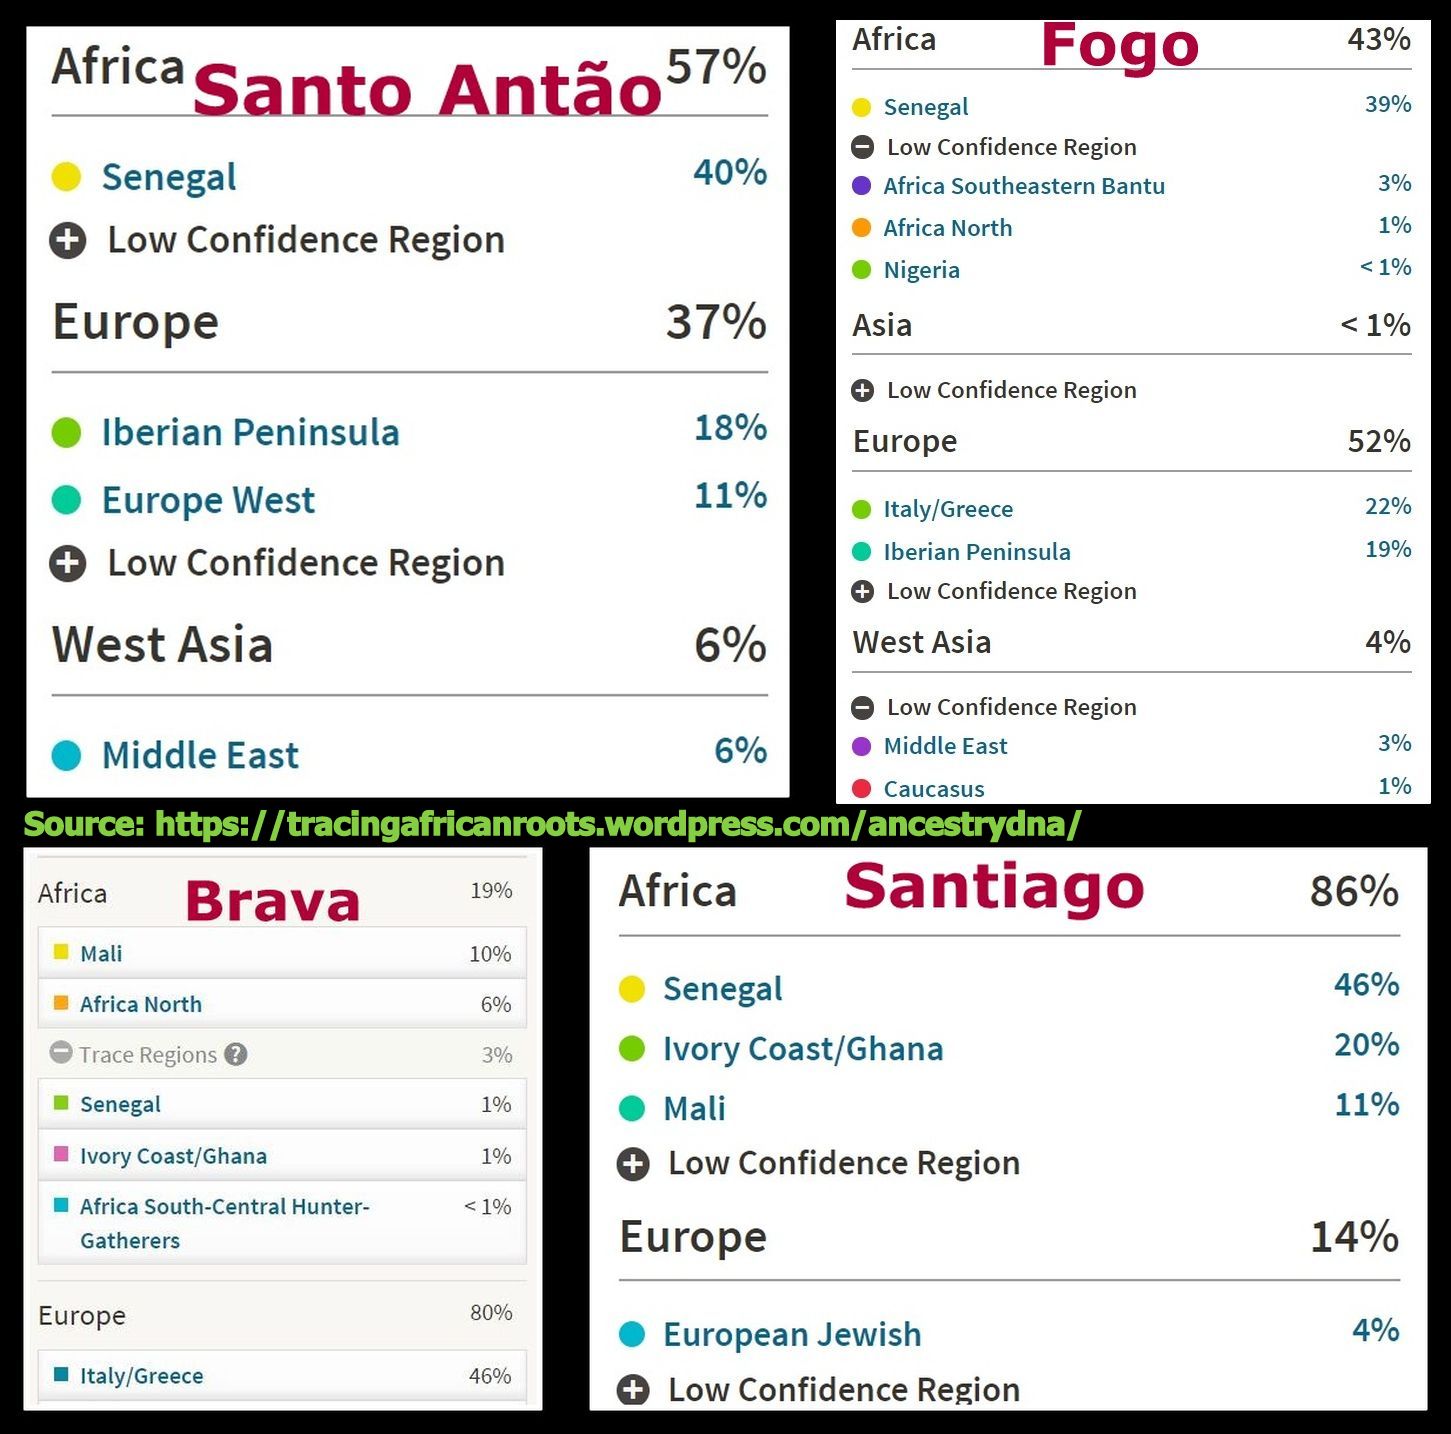
This limited selection is merely intended to illustrate the admixture range across the islands. Obviously individual variation will not always correspond with the “averages”. Also within each island there will be a wide range of admixture proportions therefore.
Chart 2 (click to enlarge)

The number in each bar represents how many survey participants had African admixture scores within that range. 74 people (41+33) had African scores of in between 40%-60%. Still a considerable number of people showed more widely ranging African admixture.
***
Table 3 (click to enlarge)
The island origins of my survey participants are not based on a 4 grand parents criterium per se. As many people were not fully aware. See also footnote 6. Still insightful variation being shown. The African admixture ranges (min. – max.) were as follows: Barlavento (43%-59%); Brava and Fogo (19%-61%) ; Santiago (62%-86%).
***
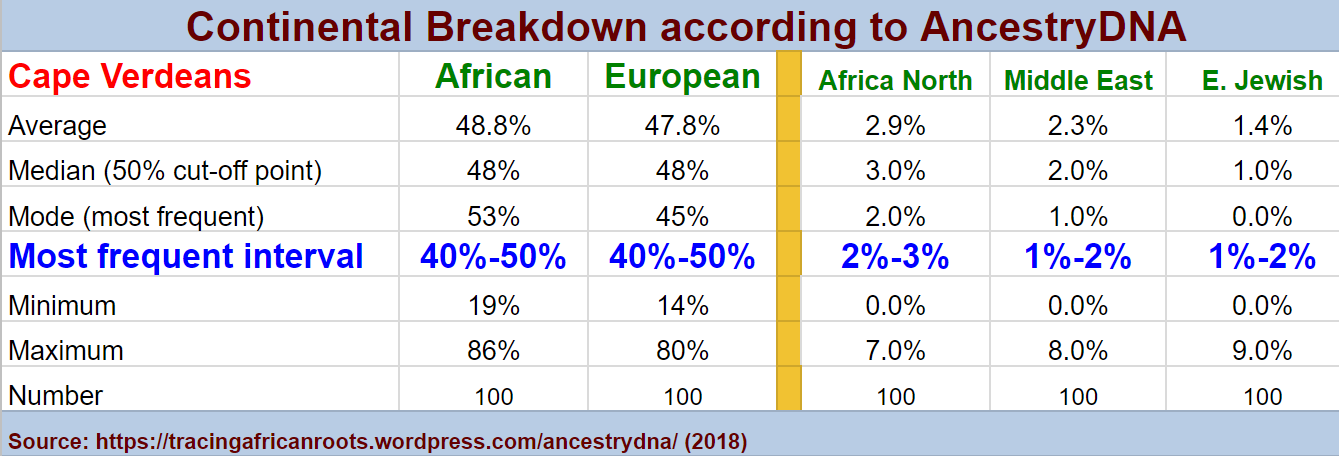
Table 1 & chart 1 posted in the very beginning of this blog article already demonstrated that all of my Cape Verdean survey participants show a considerable degree of continental admixture. Principally a mix of Upper Guinean DNA (“Senegal” + “Mali”) & Southern European DNA (“Iberian Peninsula” and “Europe South”) although other minor ancestral components are also frequently reported. In particular “Africa North”, “Middle East” and “European Jewish” admixture. These outcomes will be discussed in following sections.
The group averages are displaying a remarkable balance between African & European admixture. Practically 50/50 proportions. This thorough racial blending marks a key aspect of not only Cape Verdean genetics but also Cape Verdean creolized culture and Caboverdianidade. One should be careful though to exclusively equate the Creole a.k.a. Crioulo identity of all Cape Verdeans with being racially mixed per se, or at least not in balanced proportions. The all-inclusive Crioulo identity of Cape Verdeans (regardless of racial appearance or DNA results) is often misunderstood by outsiders which causes them to apply it for inappropriate and potentially divisive racial classifications5. See also:
- From Creole to African (Tracing African Roots)
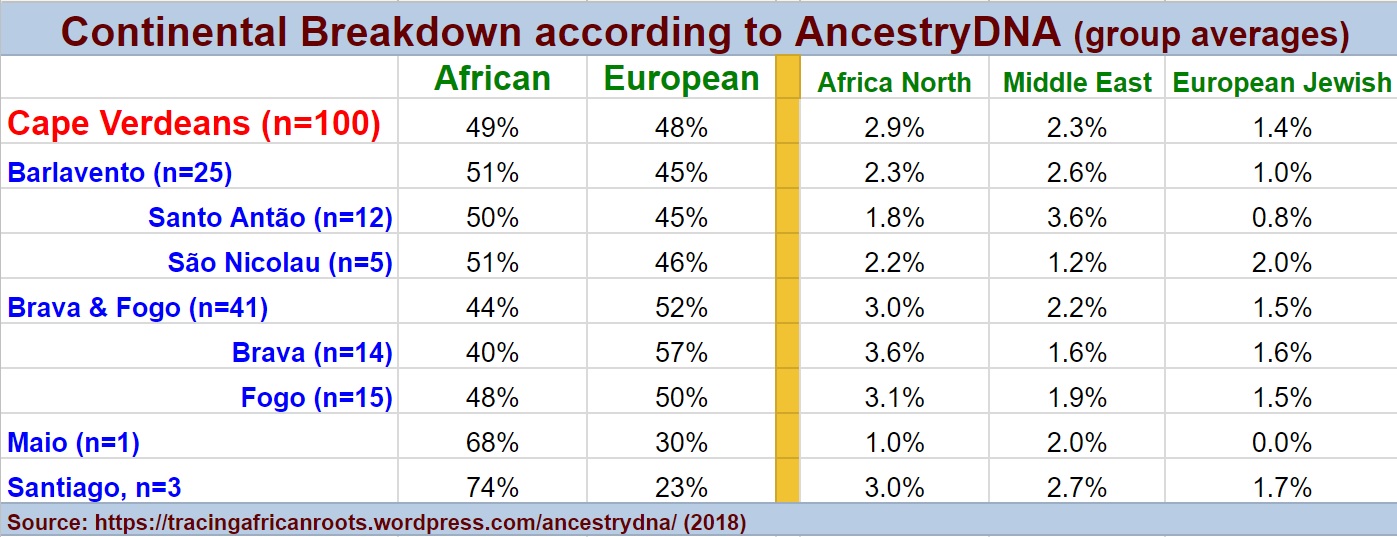
As shown directly above there is actually quite some individual variation hiding behind the group averages. In particular along specific Cape Verdean island origins6. In chart 2 we can verify that indeed the range of 40%-60% African admixture is by far the most common among my survey group (combined almost 75% of the group). However a considerable minority is showing less balanced admixture proportions going either way. With a minimum score of 19% African for a person with island origins from Brava and a maximum score of 86% African for a person with most likely island origins from Santiago7. Strictly speaking in terms of socalled Sub-Saharan African (SSA) DNA the sample from Brava actually is 13% SSA after leaving out the 6% “Africa North” score (see figure 2).
Despite minimal sample size for the most part and overrepresentation of certain islands the inter-island variation shown in table 3 is quite insightful already. We can verify that my survey participants from Brava had the lowest group average for African admixture. Around 40% but often also lower in individual cases. As was also the case in 2015 (see this chart) my survey is somewhat biased towards island origins from Brava & Fogo. Because most Cape Verdean Americans tend to be from those islands (see this link). I did however also expand on my Barlavento sampling (Santo Antão, São Nicolau and São Vicente). Their group averages being closest in line with my overall findings of balanced admixture proportions. A few survey participants had partial island origins from Boavista. But because they were mixed with other island origins I couldn’t include them in table 3. Their average African admixture was somewhat increased, around 60%. Interestingly my only survey participant from Maio also showed an increased level of African admixture of 68%.
A major difference between my previous survey findings from 2015 is that I am now able to offer an improved perspective on Cape Verdean population structure due to the inclusion also of a few Santiago examples. Santiago is the biggest and most populated island of Cape Verde. Because of its early settlement history it is arguably together with Fogo also the birth place of Cape Verdean identity and culture. Despite overall commonalities each of the nine inhabited islands of Cape Verde did eventually develop a distinctive (sub)-culture of its own. Due to relative geographical isolation for the most part. Most clearly noticeable perhaps by the various island-specific dialects of the Crioulo language. Santiago is often said to have retained its African heritage the best, epitomized by its Badiu identity. The higher than average African admixture scores reported for my survey participants from Santiago are therefore in line with expectations. Despite the minimal sample size this outcome does underline that Cape Verdean genetics cannot be generalized as simply “mixed”8 as there is underlying substructure as well. Not only between islands but probably also within island populations.
Confirming and complementing previous DNA studies?
Chart 3 (click to enlarge)

This chart is taken from Beleza et al. (2013, p.2). Based on 685 samples from 6 Cape Verdean islands. Santo Antão + São Vicente + São Nicolau (n=192), Boavista (n=27), Santiago (n=172), Fogo (n=129) (source). It shows a similar distribution of African admixture as my own survey results (chart 2, n=100). Also including similar minimum (23.5%) and maximum (87.9%) values for African admixture (Beleza et al., 2013, p.2). At the the same time it also clearly shows substructure as can be seen from the second peak around 70% African ancestry.
***
Chart 4 (click to enlarge)

This chart is taken from Beleza et al. (2012, p.5). Based on 646 samples from 6 Cape Verdean islands. Santo Antão (n=136; mean 56%), São Vicente (n=84; mean 56%), São Nicolau (n=110; mean 56%), Boavista (n=66; mean 59%), Santiago (n=124; mean 65%), Fogo (n=126; mean 53%) (source) Clearly higher African admixture for the Santiago samples, on average. While the African proportions for the other islands are more similar and balanced. But the one for Fogo being slightly lower than the rest. Very similar to my own findings shown in table 3.
***
Chart 5 (click to enlarge)

This chart is taken from Verdu et al. (p.2531, 2017). It is based on 44 samples drawn exclusively from Santiago. It demonstrates how Santiago also shows a wide admixture spectrum even when on average its African genetic heritage is more pronounced than on the other islands. No statistical details are provided in this study but it seems apparent that African admixture values of around 80% were most frequent.
***
Various important and insightful studies have already been published on Cape Verdean genetics. The charts being featured directly above are taken from the most recent studies dealing with autosomal genetics (covering the whole genome) in particular. Therefore most suitable to compare with my own findings which are likewise based on autosomal DNA analysis. Eventhough there do exist some differences in methodology. AncestryDNA’s genotyping probably being most up-to-date and producing more high resolution and regionally varied results9. Highly recommended to read these papers yourself for more details:
- The Admixture Structure and Genetic Variation of the Archipelago of Cape Verde and Its Implications for Admixture Mapping Studies (Beleza et al., 2012)
- Genetic Architecture of Skin and Eye Color in an African-European Admixed Population (Beleza et al., 2013)
- Parallel Trajectories of Genetic and Linguistic Admixture in a Genetically Admixed Creole Population (Verdu et al., 2017)
For an overview including also haplogroup studies see:
- DNA Evidence (Cabo Verde Raizes Na Africa)
I will revisit the fascinating research outcomes of these studies also in the following sections. Just focusing on the theme of admixture proportions I believe my own survey findings are broadly in line with these previous studies. And therefore arguably also corroborated by them. We can see this most clearly in charts 3 & 4 which feature a comparable distribution of African admixture as shown in chart 2 and table 3, based on my survey data. The most common admixture brackets lying in between 40%-60%. The higher median value of 58% in Beleza et al. (2012 & 2013) to be explained by a much greater inclusion of Santiago samples (124/646 and 176/685) when compared with my survey (3/100) which had a median value of 48% instead. Beleza et al. (2012 & 2013) therefore being better equipped to uncover substructure in Cape Verdean population although my survey findings do hint at this as well.
Then again I also believe that my survey data are complementing these previous studies because of my inclusion of samples from Brava. Even though covering most of Cape Verde’s islands, Brava was not researched in Beleza et al. (2012 & 2013). Also Maio was left out while being represented by one single sample in my survey. The Fogo and Barlavento island origins covered by my survey mirror those found within Beleza et al. (2012 & 2013) but the latter studies do have an additional advantage of also including a significant number of samples from not only Santiago but also Boavista.
Verdu et al. (2017) is only making use of samples taken from Santiago (n=44, not per se with 4 grand parents born in Santiago though, p.2536). But despite being smaller in size their dataset does seem even more illustrative of Santiago’s admixture range than Beleza et al. (2012 & 2013). Although regrettably no specific admixture statistics are given in their article, based on chart 5 it seems an African admixture range of around 80% would have been most frequent. With a maximum value of possibly just over 90% African. Slightly higher than what was obtained for the Santiago samples in Beleza et al. (2012, 2013): median of 74.4% and maximum value of 87.9%. All in all I think combining the sample sets from all these studies, incl. my survey data, might provide a more complete overview. My Brava findings being indicative of the lower admixture proportions to be found among Cape Verdeans as well. While Verdu at al. (2017) serving to underline the generally higher African admixture degree to be found in Santiago. Although noticeably not including a single sample of 100% African descent! I suppose such results might still be forthcoming for Cape Verdeans (with at least 4 Cape Verde-born grandparents) given wider and more targeted sampling. But the frequency of such results might be quite low.
Admixture mostly occurring in the 1500’s/1600’s or rather in the 1700’s/1800’s?
____________________
“As far as we know, Cape Verde is presently one of the most highly admixed populations resulting from the mixing of European and African parental contributions, and may be only paralleled by some regions in Brazil. Moreover, the comparison of African ancestry proportions calculated with X, Y-chromosome and autosomal markers confirms that admixture involved predominantly European men and African women, like in many other societies emerging from the Atlantic slave trade.” (Beleza et al. 2012, p. 9)
____________________
Table 4 (click to enlarge)
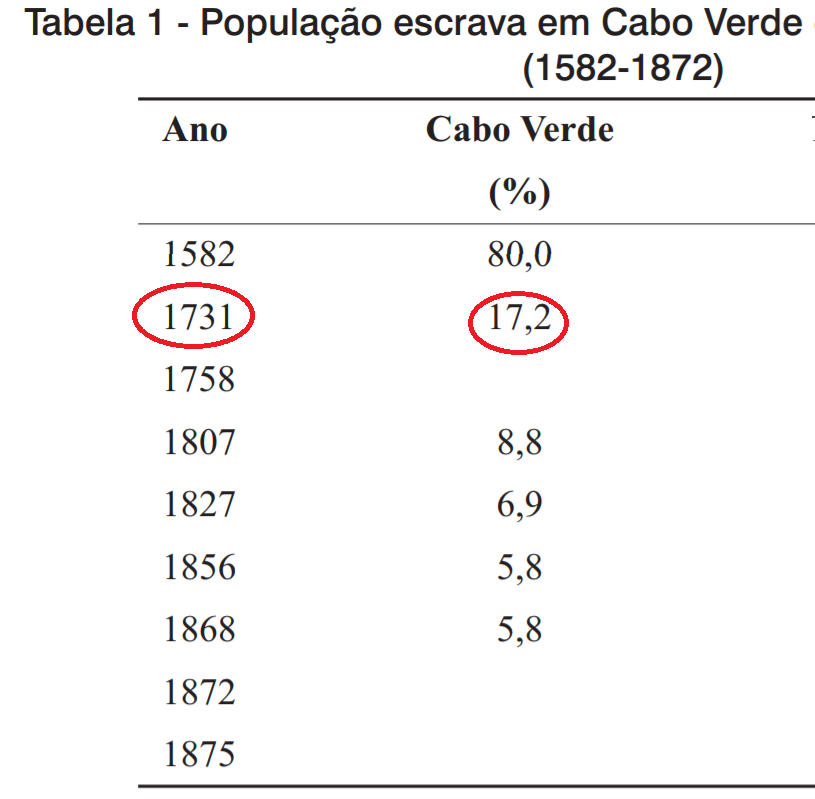
This table shows the proportion of enslaved people living in Cape Verde. Take notice that in 1731 a greater majority of Cape Verdeans had freed status (and probably already in the late 1600’s). Slavery did remain a reality for many people still but overall speaking they were a small minority of Cape Verde’s total population, less than 10% throughout the 1800’s. This provides a stark contrast with most other parts of the Afro-Diaspora. Source: “Crioulização em Cabo Verde e São Tomé e Príncipe: divergências históricas e identitária“, (Seibert, 2014, p.53)
*** Table 5 (click to enlarge)

This table is showing the racial composition of Cape Verde’s population across time (Branco=White; Mestiço=Mulatto; Negro=Black). Plus it also makes a distinction between enslaved black people (escravos) and black people with freed status (livres a.k.a. forro). Take note that the share of mixed people is steadily increasing but only reached a majority of the population in 1900!
***
This section is going to be speculative to some degree and may touch on a potentially sensitive topic. But I think this makes for a promising research field. Possibly to be explored in greater detail by a close study of European IBD matches for Cape Verdeans (see upcoming blog post). I think it is very relevant to pose questions about the exact time framing of European admixture. Because the popularization of personal DNA testing confronts many people among the Afro-Diaspora as well as Cape Verdeans with the question of how their generally racially admixed test results came to be. My finding of a relatively high frequency of the “Portuguese” migration being assigned to my Cape Verdean survey participants (16/88, see table 2) reinforces this research question. As this outcome seems to suggest a considerable Portuguese gene-flow occurring also in the last 4 or 5 generations. These Portuguese ancestors, even from the late 1800’s, are actually often still remembered in the family lore of many Cape Verdeans, as they were usually involved in either marriage or otherwise consensual unions with Cape Verdean women.
I fully understand and respect that given the brutal history of the Slavery Period as well as continued racism afterwards many Afro-Diasporans might not be inclined to learn more about their mixed European origins. Even if the possibility of this European ancestry (partially) dating from the Post-Slavery Period cannot be ruled out in advance. Muhammad Ali’s Irish great-grandfather makes for an intriguing example. Still other Afro-Diasporans will be more curious about their complete genetic make-up and how this might define them. Despite shared experiences one must also be careful to respect the localized context and different historical trajectories across the Afro-Diaspora. Instead of just letting one single perspective on inter-racial relationships overcloud things. This goes especially for Cape Verdeans who despite being part of the Afro-Diaspora in many aspects have a unique history of their own. And as a consequence their family trees & genealogy will usually not fit in well with simplistic generalizations. And even less so with ideologically charged assumptions arising from a specific USA context or an overly Americanized mindset.
As shown in the quote above from Beleza et al. (2012) certain generalizations are also being perpetuated in scientific papers. Which is not to say that their statement about Cape Verdean mixed genetics ultimately being the result of unions between African women and European men is factually wrong.10 I am pleading however for more nuance and a greater focus on events taking place on a micro-scale in order to arrive at historically accurate family narratives. As shown in table 4 more than 80% of Cape Verde’s population would no longer have been enslaved already in 1731. However going by table 5 the racially mixed segment (mestiço or mulatto) of Cape Verde’s population by that time was still a minority of around 30%! Combining both “facts” (based on sketchy census data naturally 😉 ) it seems to be implied that ongoing European geneflow taking place in the 1700’s & 1800’s would most likely not have involved unions with enslaved (mainland) African women at least not for the most part. But rather unions between in particular Portuguese men (probably especially exiled convicts or otherwise officials and seamen) and Cape Verdean women (either black or mixed) who usually might have hailed from families with freed status dating from several generations ago. No doubt given the colonial context some structural element of power imbalance (beyond gender) would still have been at play. Although individual agency (incl. by females) is also not to be ruled out. Either way such a scenario does differ from the circumstances in many other parts of the Afro-Diaspora at the same time.
In the first two centuries of Cape Verde’s settlement (1460-1660) the context of inter-racial unions could very well have been more similar to other parts of the Afro-Diaspora. The often violent circumstances prevailing in that era should naturally be fully acknowledged. Especially in order to deal with the socio-cultural repercussions in following time periods up till the present. Then again I would argue to still attempt to understand localized realities from the perspective of someone who actually would have lived in that time & place. A pragmatic and open-minded stance instead of constant indignation being more likely to lead to genuine learning about your origins. You might then of course still encounter both negative and positive aspects. However also often unexpected details might turn up enriching your research and making it more insightful. Things are often far more complex, inter-connected and intricate than you might assume at first.
The extent of admixture among the nascent Cape Verdean population in the 1500’s-1600’s would have been quite considerable back then already. As confirmed not only by sketchy census reports but also historical testimony by colonial officials, visiting travelers etc.. Their accounts about widespread concubinage with African women and manumission of mixed-race offspring are recommended reading in order to reach greater understanding about the nature of inter-racial unions back then. Even when they might not tell the whole story. Either way more research needs to be done to establish in which time period European geneflow might have had the most impact on Cape Verdean genetics. As always I believe that a multi-disciplinary approach may deliver the best results instead of relying on one-sided and preconceived notions. Including a good grasp on local history, personal genealogy as well as DNA testing, not only in regards to admixture analysis and haplogroups but also in particular IBD matches. For further discussion and also a fascinating parallel with the question of European geneflow among African Americans see:
- Black/White Interracial Marriage Trends, 1850–2000 (A. Gullickson, 2006) (see p.3 for an insightful chart)
- Cape Verde Slave Census of 1856 (part 1) (Tracing African Roots)
- Historical demography of Cape Verde (Cabo Verde: Raizes Na Africa)
3) Upper Guinean roots = “Senegal” + “Mali”
Table 6 (click to enlarge)

Despite the quadrupling of my sample size this scaled African breakdown showing a predominance of regions associated with Upper Guinea, is still practically the same as in 2015, see this chart (n=23). Highlighting the relative homogeneity of Cape Verde’s African regional roots.
***
Figure 3 (click to enlarge)

This screenshot shows the areas where the “Senegal” and “Mali” regions can be found according to Ancestry’s updated info. Take note how “Senegal” expands all the way into Sierra Leone. While according to my survey findings “Mali” actually also is frequently reported for people in Senegambia, Guinea Bissau/Conakry and again Sierra Leone.
***
Figure 4 (click to enlarge)

Take note how socalled “Senegal” is in fact reported for people all across Upper Guinea, as far south as Sierra Leone! The same goes for “Mali” which also is reported in substantial amounts for all of these African samples. And therefore this region can also be suggestive of lineage from various countries in the wider area and not just Mali!
***
Compared with my previous survey findings (n=23) from 2015 the Upper Guinean predominance (as measured by “Senegal” and “Mali”) has been remarkably consistent among Cape Verdean AncestryDNA results. There is actually very little difference between table 6 and a similar table I blogged about in 2015! Inspite the fact that my survey has considerably expanded in sample size. Also when comparing my current survey findings for Cape Verdeans with those with other parts from the Afro-Diaspora this Upper Guinean predominance remains a singular and distinguishing feature. I suppose this speaks of the robustness of this outcome despite inherent shortcomings of AncestryDNA’s regional set-up. See also:
- Update: Afro-Diasporan AncestryDNA Survey (part 1) (Tracing African Roots)
In 2015 I already discussed in greater detail how basically both “Senegal” and “Mali” are genetic components which may have been inherited from many various Upper Guinean ethnic groups. Despite the modernday country name labeling these regions are by no means limited to only Senegal or Mali! My ongoing survey of African AncestryDNA results allows me to affirm this with even greater confidence. In particular the results from Upper Guinean countries such as Senegal, Gambia, Guiné Bissau, Guinea Conakry, Mali and Sierra Leone are clearly demonstrating the border crossing and overlapping nature of AncestryDNA’s regions. As shown in figures 3 & 4 for example. This is to be explained by ancient migrations & shared origins across the wider area, irrespective of modernday country borders or (fluid) ethnic identity. Most African countries are afterall colonial creations! The socalled “Senegal” region showing a remarkable and fitting similarity with the historical area of “Guiné de Cabo Verde“, once stretching from the Senegal river in the north to the Sierra Leone peninsula in the south (see this map). For more discussion:
One minor but still noteworthy difference with my surveyfindings in 2015 is that aside from “Senegal” (94/100) in a few cases also “Mali” (5/100) was reported as the biggest region within the African breakdown. And 1 single time even “”Africa North” (see chart 1). The top-ranking frequency of “Senegal” (94%) is still overwhelming though and its predominant share of the scaled African breakdown has also stayed very consistent (around 62%). The generally secondary importance of “Mali” remains the same as already established in 2015 (between 12%-14% of the total African breakdown, see table 6). It is probably also telling that these somewhat atypical top ranking “Mali” results were generally reported for people with lower than average total amounts of African admixture. Possibly influencing the ability of AncestryDNA to make a correct distinction between the overlapping regions of “Senegal” and “Mali”.
In 2015 I explored some possible scenario’s involving not only genuine Malian lineage but also an ancestral connection with Guinea Conakry and Sierra Leone based on the results of especially Mexicans and their shared “Zape” heritage with Cape Verdeans. Having seen and analyzed many more AncestryDNA results in the meanwhile I would currently say follow-up research based on DNA matches is probably the best way forward (see this link for a tutorial, as well as upcoming blogpost). An exact interpretation of “Mali” scores still being very precarious. As this region is probably best to be seen as a generic proxy for Upper Guinean lineage. Probably even more so after the upcoming update. See section 7 for continued discussion.
Most recent research on Upper Guinean roots of Cape Verdeans
Table 7 (click to enlarge)

This table is taken from my ongoing African survey of AncestryDNA results. Despite very limited sample size it is still already telling that the Cape Verdean group average for “Senegal” (scaled to 100%!) is in between samples from Senegal and Gambia and one single sample from Guiné Bissau.
***
In 2015 my survey findings established for the first time (as far as I am aware) that autosomally speaking the African part of Cape Verdeans can be characterized as predominantly Upper Guinean (~75%) At that time I did not however have any other AncestryDNA results from actual Upper Guineans to compare with. Luckily an increasing number of Africans are taking DNA tests nowadays. Which is why I am now able to compile table 7 which provides a benchmark of sorts to see how the scaled African breakdown of Cape Verdeans fits in with neighbouring countries from Upper Guinea. Despite the very limited sample size for most of the separate nationalities this relevant array of samples does still seem to contribute to the robustness and coherency of my overall data set. Although I wish I could have included a couple more results from especially Guiné Bissau. The one single Guinean sample in my survey actually being of mixed background, a.k.a. mestiço. Still it seems quite telling already that the group average for “Senegal” as well as “Mali” among my 100 Cape Verdean survey participants is quite similar to the ones for actual Senegalese and Gambians. As well as similar to the group averages for 43 Fula samples from various countries (incl. Guinea Conakry). But not perfectly so. The somewhat increased group averages for other regions among my Cape Verdean survey participants perhaps being an indication of additional origins from other parts of Africa. This will be discussed in the following section 4. For more details see:
- African AncestryDNA results (spreadsheet with individual results)
- Upper Guinean AncestryDNA results
- Youtube video showing the results for a person from Guiné Bissau
Chart 6 (click to enlarge)

This chart is taken from Verdu et al. (p.2530, 2017). At K=4 four different putative ancestral clusters are being revealed. And very intriguingly it turns out that the selected Gambian samples (red) are a better match than Senegalese samples (orange) to capture Cape Verde’s Upper Guinean ancestry.
***
In chart 6 an extremely fine-scaled research outcome is displayed which I have been highly anticipating for several years already! It is taken from an excellent study which also analyzes the correlation between African admixture and African influenced linguistics among 44 samples recruited in Santiago (Verdu et al., 2017). It shows a socalled ADMIXTURE run comparing 44 Cape Verdean samples with 109 Gambian Mandinka samples and 22 Senegalese Mandenka samples as well as European samples from Iberia, France and Great Britain. At K=4 four different putative ancestral clusters are being revealed. And very intriguingly it turns out that the selected Gambian samples (red) are a better match than the Senegalese samples (orange) to capture Cape Verde’s Upper Guinean ancestry!
Naturally Cape Verde’s actual African origins include many more ethnic groups than just these two very closely interrelated Mandé subgroups. Intuitively this outcome does make sense though because of Gambia being geographically closer to Guiné Bissau. This latter country arguably being the best proxy for Cape Verde’s overall Upper Guinean heritage, even if not exclusively so. Although I suppose it might also be that simply because of the greater number of Gambian samples the odds of genetic similarity were also increased. The output of this type of admixture analysis is naturally predetermined to a great degree by the input. Actually a comparison with Mende samples from Sierra Leone (again a Mandé speaking subgroup, take note of the spelling 😉 ) is also being made in the study (fig. 1A). And according to the authors “The Gambian Mandinka and Senegalese Mandenka are genetically closer to Cape Verdeans than are the Sierra Leone Mende” ((Verdu et al., p.2430). Which again seems right although I suspect that for historical reasons the Temne from northern Sierra Leone might have made a better fitting proxy than the Mende from southern Sierra Leone. See also:
- Maps of various Mandé speaking groups (scroll down for it) (Tracing African Roots)
- Top 20 Ethnic African Roots for Cape Verdeans (Cabo Verde Raizes Na Africa)
This research outcome from Verdu et al. clearly demonstrates the added value of expanding Upper Guinean reference populations in DNA testing. Beyond the limited and overused (also currently by AncestryDNA) Senegalese Mandenka samples. As I have argued in my latest blog post but actually also already in 2015 based on the available sampling from Jallow et al., 2009. I therefore fully concur with the suggestion being made in Verdu et al. that especially the inclusion of Wolof samples might benefit an even more adequate genetic analysis of Cape Verde’s Upper Guinean heritage.
I find it very unfortunate that this study offers no detailed statistics beyond its charts. It would have given greater insight into the exact admixture proportions of their Santiago study group (n=44). When Verdu et al. are stating that Cape Verdeans are “a combination of Iberian and Senegambian sources“, this is of course very similar to my own current survey findings (n=100, with various island origins). Also in regards to the mostly Iberian origins of Cape Verdeans (see section 5). But it still lacks the regional detail of AncestryDNA’s Ethnicity Estimates enabling the detection of for example West Asian and Jewish lineage as well as a minor degree of possibly non-Upper Guinean lineage. All of which prevents evenhanded comparison.
Upper Guinean origins around 1572-1634
____________________
“Although most captives listed in Table 1 [7] were acquired south of the Gambia River, several bore ethnonyms indicating Senegambian origins. The presence of individuals, albeit few, described as “Jolofo” on the San Pedro, San Jorge, San Josephe, and the Concepcion and others described as “Berbesi” on the San Pedro and San Josephe reveals that the transatlantic slave trade from Upper Guinea and the Cape Verde Islands drew on slave catchment areas extending perhaps as far north as the Senegal River. One captive arriving in Havana on the San Pedro in 1572 was described as a black woman from Arguim (“Argui”), an island off the Mauritanian coast, even farther north.” (D. Wheat, 2016, pp. 30-31).
____________________
Table 8 (click to enlarge)

Table taken from “Atlantic Africa and the Spanish Caribbean, 1570-1640” (D. Wheat, 2016, p.32). Additions in red are mine. I encircled the three most frequently named ethnicities: the Bran/Brame (=Papel) & Beafara/Befada from Guiné Bissau, as well as the Zape from Sierra Leone.
***
In my blog article of 2015 (section 2) I already gave a detailed specification of the most likely ethnic groups in regards to Upper Guinean lineage for Cape Verdeans. Based on historically documented overviews for the most part. I also emphasized how time framing is essential to distinguish northern Senegambian origins from Guiné Bissau/Casamance origins. As well as other less prominent but still important origins from Guinea Conakry, Sierra Leone, Mali & Mauritania. A relative shift taking place in localized slave trade patterns comparing the very first century of Cape Verde’s settlement (1460-1560) with the second one (1560-1660) as well as following time periods when slave trade decreased drastically. All of this due to the arrival of other competing European powers on the scene. Which caused Cape Verde’s once extensive regional networks to be confined to Guiné Bissau & Casamance eventually. In regards to the quotation above it is therefore very relevant to keep in mind that prior to the sample period of 1572-1634 the frequency of northern Senegambian origins is likely to have been much greater.
In 2016 the historian David Wheat wrote an extremely insightful book describing the Spanish Caribbean as an extension of the Luso-African Atlantic world, incl. Cape Verde! Especially table 8 shown above is a very precious source to gain ethnic-specific understanding of Cape Verde’s Upper Guinean roots within this particular period (1572-1634). It is based on the detailed records of 505 captives travelling on 5 slave ships departing from Cape Verde in three cases and otherwise from Guiné Bissau. All of these people could therefore also easily have remained in Cape Verde! Given that the local demand for slave labour at time was still quite strong. The most frequently mentioned ethnic groups being the same ones I have already explored elsewhere on this blog and my Cabo Verde Raizes Na Africa website. For more details I highly recommend reading David Wheat’s book: “Atlantic Africa and the Spanish Caribbean, 1570-1640”
- Ethnicities of Upper Guinean Slaves (Cabo Verde Raizes Na Africa)
- Map showing Upper Guinean ethnic groups circa 1580 (D. Wheat, 2016, p. 28)
- Upper Guinean Ethnonyms in Slave Ship Rosters (D. Wheat, 2016, pp. 27-53)
4) Beyond Upper Guinea: valid outcomes or misreading by AncestryDNA?
Figure 5 (click to enlarge) Maximum regional scores

These screenshots are showcasing the maximum scores among my survey participants for each African region available on AncestryDNA. It therefore illustrates them in an extra pronounced degree. Aside from “Senegal” and “Mali” these regions were usually being reported as low confidence trace regions though. See also: Maximum scores among the Afro-Diaspora
***
Table 9 (click to enlarge)

This table showing various statistical details for my 100 survey participants is very similar to my findings from 2015 (n=23), see this chart. The main difference being the maximum values although on average the scaled African breakdown has remained consistent.
____________________
“it might therefore perhaps be premature to speculate on what these findings might really represent or how robust they might be. They might merely be reflecting generic West African DNA markers which cannot be distinguished yet with greater reliability. Or it could be a misreading of ethnic origins from especially Sierra Leone. Probably only an update of AncestryDNA reference populations might bring more clarity or else comparing with the AncestryDNA results of actual Upper Guineans (to verify if they also show other regions besides “Senegal” and “Mali”) .” (Fonte Felipe, 2015)
____________________
In my 2015 discussion of Cape Verdean AncestryDNA results I already mentioned the somewhat unexpected high level of African regions not directly to be associated with Upper Guinea. That is “Benin/Togo”, “Nigeria”, “Cameroon/Congo” and “Southeastern Bantu”. I even devoted a separate section (5) to that last region. “Ivory Coast/Ghana” and “South-Central Hunter-Gatherers” are arguably regions which despite the labeling can still be tied with Upper Guinean lineage for Cape Verdeans. In particular from Sierra Leone11. Fast forward to 2018 and I can already reveal that the upcoming update on Ancestry will quite likely eliminate some of these unexpected regional scores, seemingly indicating origins from either Lower Guinea or Bantu speaking Africa. But misleadingly so as it may turn out! I will discuss this in greater detail in section 7 further below.
On the other hand my ongoing survey of AncestryDNA results among both Cape Verdeans and actual Upper Guineans now allows me to delve somewhat deeper into the possible implications based on the current version of AncestryDNA. In particular the higher maximum values for these seemingly non-Upper Guinean regions among my 100 Cape Verdean survey participants. All clearly above trace level and no longer earmarked as “low confidence” by AncestryDNA (see figure 5). Although in fact the group averages have remained largely the same and are still subdued (see table 9 and also table 6). I would like to underline that this discussion will again by necessity be somewhat speculative. Especially in light of Ancestry’s upcoming update. But I believe it can still be useful to also explore these possibly broader African roots of Cape Verdeans.
The higher maximum values I observed among my Cape Verdean survey group are perhaps to be seen as atypical outliers. Whenever first confronted with such breakdowns I have always made an extra effort to verify if these survey participants were indeed of fully Cape Verdean descent. Not only to their own knowledge but also by looking into possibly other clues such as DNA matches and migrations they were assigned to on AncestryDNA. I performed such a quality check for all the screenshots I featured in figure 5. However I still cannot rule out the possibility that perhaps such scores are in some selected cases also caused by atypical family histories involving return or back & forth migrations to and from fellow former Portuguese colonies such as Angola, Brazil, São Tomé & Principe and Mozambique. And possibly also other migrant destinations (the USA being least likely because of the quality check I performed). Although again I did not come across any apparent clue for this and neither were the survey participants in question aware of such connections.
Table 10 (click to enlarge)

This table is contrasting the scaled African/SSA breakdown (“Africa North” is excluded!) of my Cape Verdean survey group with 5 samples from Senegal & Gambia. Despite minimal samplesize and overall similarity minor deviations might be indicative of lineage from beyond Senegambia. For a similar overview specifying my separate findings for Brava, Fogo & Barlavento islands see this chart. The island origins of my survey participants are not based on a 4 grand parents criterium per se. As many people were not fully aware. See also footnote 6.
***
In such cases as well as other ancestral scenarios involving sailors, travellers etc. I suppose the involved African geneflow would not be representative for the Cape Verdean genepool in general. Or at least it would not be traceable to the earlier settlement period of Cape Verde (1400’s-1600’s) but rather to the late colonial phase (1800’s/1900’s). Then again looking at the more detailed group averages shown in table 9 several preliminary tendencies might be distinguished. Regrettably I had only a few suitable Upper Guinean samples available to compare with12. But it is probably already telling that the scaled “Senegal” group average (63%) for my Cape Verdean sample group, eventhough rather high, is still at some distance from the 79% “Senegal” group average for my Senegambian samples. The “Mali” and “Ivory Coast/Ghana” group averages are quite similar. But the relatively greatest deviations occur for “Benin/Togo”, “Nigeria”, “Cameroon/Congo” and “Southeastern Bantu”. Possibly indicating that these are indeed regional scores to be explained by additional African roots from outside Upper Guinea. Or more properly Senegambia. Including more results from Guinea Bissau/Conakry would naturally have provided a more complete perspective.
It is intriguing to then also take into account the various island origins of my survey participants. In 2015 I already cautioned about how the minimal sample size might skew the group averages. Which is why I have decided to only use broader groupings “Barlavento” and “Brava & Fogo” aside from still also including 3 samples from Santiago in table 9. Of course other shortcomings might remain in place but still some of the deviating regional patterns caused by inter-island differentiation (see Beleza et al., 2012) might now have become more visible. What stands out to me the most when compared to my findings in 2015 (see this chart) is the following:
- In regards to the “Senegal” and “Mali scores. These are quite similar across the board. Except for the still somewhat elevated “Mali scores for especially my Brava samples (19.5% without Fogo included, see this chart). Perhaps implying something about a slightly different composition of their Upper Guinean origins. But maybe also just an artefact of Ancestry’s algorithm not being equipped to make a proper distinction for people with relatively lower African amounts (the same might be true for Mexicans and other Hispanics too actually).
- The “Ivory Coast/Ghana” group average is highest for my Santiago samples but this is mostly due to one result with 20% for this region. As described in footnote 11 this seemingly atypical score is still very likely to be indicative of either Guinean or Sierra Leonean origins.
- “Benin/Togo” group averages are similar across the islands. But there is some increased level of “Nigeria” as well as “Cameroon/Congo” among my Barlavento samples. Caused by not only one but several outliers in fact. Barlavento islanders being behind most of the maximum scores featured in figure 5 (also for “Benin/Togo” and “Southeast Bantu”).
- The “Southeast Bantu” group average does no longer stand out in the same way as it did in 2015. There is also no strong island variation. However it is still clearly elevated when compared with actual Senegambians (0.2%). As well as when comparing with Fula people on a similar footing (incl. “Africa North”). Fula people do at times score considerable amounts for this region (to be explained by genetic similarities with Northeast African DNA). But on average still lower than Cape Verdeans (2.8% for 43 Fula samples versus 5.2%, see table 7). Increasing the odds of potential Angolan/Mozambican connections, when reported in above average amounts. But still to be validated by follow-up research.
In summary the best way to corroborate these seemingly non-Upper Guinean findings might be to just simply await the upcoming update on AncestryDNA13. Otherwise it may still be worthwhile to also do a thorough check of your DNA matches as well as pay closer attention to the migration stories in your family tree research. Then again more historical research might also be helpful in making sense of such scores. As I mentioned in 2015:
“the documentation of ethnic origins in Cape Verde is very fragmentary, especially for the earlier timeperiods when it functioned as a slave trading hub“. And
“Cape Verde was used as a stopover for the main sailing route between Portugal on the one end and São Tomé, Brazil, Mozambique/Asia on the other.“
In my reading of Cape Verdean and Afro-Diasporan history I did actually at times come across specific historical references to African captives outside of the expected Upper Guinea area being present in Cape Verde. I will try to create a new section on my Cabo Verde Raizes Na Africa website to provide an overview of such references.
5) European breakdown reflecting mostly Portuguese ancestry?
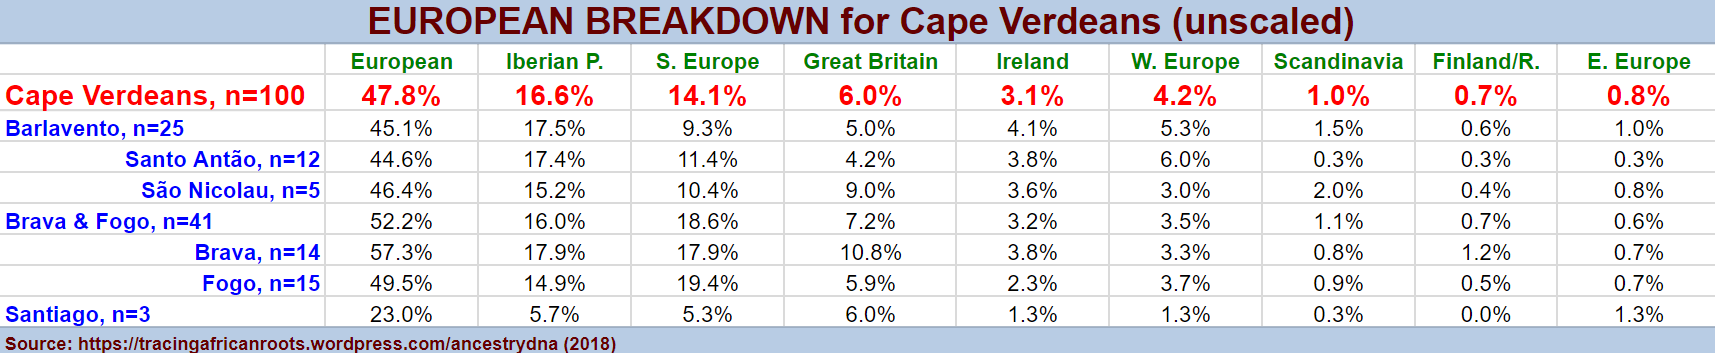
Table 11 (click to enlarge)

This table is showing the statistical details for the European scores of my Cape Verdean survey participants. Based on the original amounts, so unscaled. Take note how despite seemingly diversity “Iberian Peninsula” and “Europe South” are clearly predominant. As is also the case for Portuguese, see this chart.
***
Figure 6 (click to enlarge)

Selection of AncestryDNA results for persons who are fully Portuguese to my knowledge. Take note how socalled “Italy/Greece” a.k.a. “Europe South” is very commonly reported for Portuguese people. Sometimes even as primary region! But in fact also minor but still considerable amounts of “Great Britain”, “Ireland”, “Europe West” etc.. See this page for more details: Iberian AncestryDNA results.
***
As already shown in the beginning of this page (chart 1) the main regional European scores for Cape Verdeans on AncestryDNA have been “Iberian Peninsula” and “Europe South”. This latter region formerly known as “Italy/Greece” (causing many people to be mislead). Based on having the biggest amount within the European breakdown “Iberian Peninsula” (50/100) is slightly more significant than “Europe South” (36/100). But it is a more balanced outcome when going by group averages: 16.6% versus 14.1% (see table 11). In addition my Cape Verdean survey participants have also received many other European regional scores. Often also as main region and not just a low confidence or trace region. In some cases even being reported as the primary region within the European breakdown. This happened seven times for “Europe West”, six times for “Great Britain” and one time for “European Jewish” (Jewish admixture will be discussed in section 6).
Many people are confused and often also mislead by their European DNA results. This happens because they tend to take the regional labeling too literally. Ignoring the geographical & genetic overlap of AncestryDNA’s regions. However in most cases receiving a multitude of European (trace) regions does not imply that you have a confusingly diverse European background! Rather it suggests that your European ancestors were themselves genetically diverse. But still these ancestors could have been from just one or two ethnic groups only. In the case of Cape Verdeans: principally Portuguese.
Because of ancient migrations and ongoing ethnogenesis it can be said that European DNA is also a melting pot if you go back far enough in time. Figure 6 is highlighting for example how the “Iberian Peninsula” region is not equipped to cover the full extent of Portuguese origins. Additional regions being required as well, especially “Europe South” (a.k.a. “Italy/Greece”). For correct interpretation it is essential therefore to be aware of how native Europeans themselves are described by AncestryDNA. The same principle is valid of course for a better understanding of African and other continental scores as well. Unlike other DNA testing companies AncestryDNA actually provides very useful information in this regard (see this link). However I have chosen to also make use of my own findings from a survey among actual Europeans which I have been conducting specifically for this purpose. For more details see:
Table 12 (click to enlarge)

In this table I have scaled the European breakdown of my Cape Verdean survey group to 100% in order to compare it more easily with other nationalities. We can verify that the scaled European breakdown of Cape Verdeans mirrors the one for Portuguese (and also Brazilians) quite closely.
***
In table 12 I have calculated how the scaled14 European breakdown of my Cape Verdean survey group compares with the group averages of several other nationalities in my AncestryDNA survey. The European countries I selected in table 12 represent the most likely source candidates for the European DNA detected among my survey participants. Based on the colonial history for each of my sample groups. Of course this is not to deny or rule out any additional and also post-colonial European migrant lineage from other countries. In individual and documented cases this may be very relevant even. At this point I am however principally concerned with finding more generalized tendencies.15
Despite obvious sample size limitations I find it remarkable how closely my sample groups resemble their historically plausible European source populations already. In particular the scaled European breakdown of Cape Verdeans mirrors the one for Portuguese quite closely. This goes too for my Brazilian samples (who are overwhelmingly Afro-descended people with colonial Brazilian roots and not including any Italo-Brazilians, see this link). My Hispanic sample groups are showing a somewhat higher degree of “Iberian Peninsula”. Which is in line with this region being most predictive of (northern) Spanish DNA, generally speaking. While my Brazilian and Cape Verdean sample groups are showing a more pronounced degree of “Europe South” (even more so when measured by top ranking frequency, see this chart). Which is in line with the results of actual Portuguese. Again other ancestral scenarios are not to be ruled out (genuine Italian or Sephardi Jewish lineage). However just based on how actual Portuguese DNA is being described by AncestryDNA this outcome already makes much sense within itself. For more detailed discussion see:
Based on these (preliminary) findings it seems to be implied that for many of my Cape Verdean survey participants the “Europe South” scores are being inherited from Portuguese ancestors, atleast for the most part. In fact this probably also goes for much of the “Great Britain”, “Ireland” and “Europe West” scores. Unless reported in an atypically high degree (deviating from Portuguese group averages) and/or in accordance with known family history involving non-Iberian lineage. Actually there are two further arguments in favour of a Portuguese interpretation:
1) The rather elevated frequency (16/88) of Cape Verdeans being assigned to the “Portuguese” migration on AncestryDNA. While my Cape Verdean survey particpants have not been assigned to any other European migration, aside from once a “Spaniards” migration. It is very telling also that AncestryDNA mentions itself that this “Portuguese” migration assignment is based on regional scores for not only “Iberian Peninsula” but also “Europe South”! See this screenshot:
***(click to enlarge)

***
2) The research outcome of Verdu et al. (p.2530, 2017) which states that:
“most Cape Verdeans lie on a path connecting Senegambian populations to an Iberian sample, rather than to British or French populations. That Iberians represent the most suitable proxy for the European ancestry of Cape Verdeans is compatible with records of the Portuguese slave trade in Senegambia starting early in the history of Cape Verde [41–43] and accords with an understanding of Cape Verdean Kriolu as a hybrid of Portuguese with languages from the Senegambian region”.
See also this chart taken from that study.
Indications of non-Portuguese lineage: maximum regional scores & inter-island variation
Figure 6 (click to enlarge)

These screenshots are showcasing the maximum scores among my survey participants for a few selected European regions. It therefore illustrates them in an extra pronounced degree. Aside from “Iberian Peninsula” and “Europe South” the other European regions were usually being reported in single digit amounts though or even as low confidence trace regions.
***
Based on the previous discussion it seems reasonable to assume that the European origins of Cape Verdeans are for a greater part Portuguese. In line with their colonial history. However settlers or temporary residents with other European origins have also been historically attested for Cape Verde, albeit to a lesser degree. Generally speaking within this current version of AncestryDNA it has proven to be quite difficult to make the distinction between ancient geneflow and more recent genealogical geneflow. For example due to shared ancient Celtic and Germanic migrations across western Europe the Portuguese themselves also very frequently receive considerable scores for “Europe West”, “Great Britain” and “Ireland” etc.. This type of DNA has been firmly incorporated within their genepool so to speak but still is to be traced back to ancient times! However when a Cape Verdean in turn also receives such seemingly West European scores how do we determine if this DNA has been inherited from West European ancestors within a genealogically meaningful timeframe (~500 years) rather than passed on by Portuguese ancestors who also tend to have the same DNA markers?
Instead of blindly relying on the regional labeling of admixture results it is recommendable to always also perform follow-up research. Including but not restricted to: local history to determine plausibility; diligent family tree research and a thorough analysis of one’s DNA matches. The upcoming update of AncestryDNA is also bound to provide more clarity (see section 7). Then again some of my survey findings already seem to be more solidly in support of non-Portuguese lineage. In particular the maximum values I have observed for regions like “Europe West” and “Great Britain”. The top ranking frequency of these two regions also being greater among my Cape Verdean survey group than for my other survey groups (Brazilians & Hispanics) with similar Iberian background (see this chart).16 It also seems striking that the maximum value for “Europe South” (46%) should be considerably higher than for “Iberian Peninsula” (31%) among my 100 Cape Verdean survey participants (see figure 6 & table 11). However without additional clues any conclusive statements cannot be made, as several ancestral scenario’s might still be applicable all at the same time.
Table 13 (click to enlarge)
This table is showing some of the inter-island variation among my survey participants. Keep in mind that the original regional scores have not been scaled. All other things being the same one might therefore expect that my samples from Brava would have the highest regional group averages for each region. But intriguingly this is not the case. The island origins of my survey participants are not based on a 4 grand parents criterium per se. As many people were not fully aware. See also footnote 6.
***
Another indication (again nothing conclusive!) seems to be forthcoming from the inter-island variation shown in table 13 above. Obviously sample size is quite minimal but it still seems noteworthy that especially Fogo islanders tend to have more “Europe South” on average than “Iberian Peninsula”. While it is the opposite especially for Barlavento islanders. The ratio of these two interrelated regions being most balanced for Brava. This outcome could possibly be suggesting a greater degree of Portuguese lineage for the Barlavento islands. While for Fogo possibly a greater degree of Sephardi Jewish lineage and perhaps also genuine Italian ancestry might be suggested, both mainly to be traced back to the 1500’s. In line with their earlier settlement history. As well as the circumstance that socalled “Europe South” really seems to be a generic genetic component found all across the southern Mediterranean, incl. not only among Portuguese but also Sephardi Jews (see this screenshot and section 7 for further discussion).
In regards to the regions possibly suggestive of western European lineage (“Europe West”, “Great Britain”, “Ireland”, etc.) the inter-island variation is less apparent. When going by group averages that is. However it might perhaps not be a coincidence that many of the “Europe West” and “Great Britain” outliers were obtained for persons from the Barlavento islands. Especially intriguing to take into account the stories of pirates from Great Britain, France and the Netherlands sometimes settling and intermarrying with local women on Barlavento islands (see entry for 1700 in this overview). Although such stories are probably not exclusive to the Barlavento. As contraband trade (salt, pano textiles etc.) with West Europeans and especially the English was rampant on other islands as well. Otherwise most maximum scores for the other European regions were received for people from Brava. Which would be in the line of expectation as Brava islanders had the greatest degree of European DNA on average in my survey. See also:
- The British Presence on the Cape Verdean Archipelago (Sixteenth to Eighteenth Centuries) (M. Soares, 2011)
- Montrond generations (photo shoot of the descendants of a Frenchmen who settled in Fogo in the 1870’s) (Viola Berlanda)
6) “Africa North”, “Middle East”, “European Jewish” and other minor regional scores
Table 14 (click to enlarge)

This table shows the statistical details of regions which usually were reported with low confidence, a.k.a. trace regions. However not always! Take note of the maximum values especially. The number of times a specific region did not show up at all in the breakdown is measured by “# 0% scores”
***
Figure 7 (click to enlarge)

This selection shows the maximum values obtained by my Cape Verdean survey participants for the encircled regions. The screenshot in the bottom right corner perhaps being most illustrative as it shows all these regions in rather elevated degree, aside from 7% “Caucasus”.
***
In this section I will discuss the regional scores which were generally speaking only being reported as “low confidence” or “trace region” for my Cape Verdean survey participants. The labeling by AncestryDNA itself already indicates that only a shaky basis exists for the appearance of these scores (see also this link). Often such results are therefore dismissed as just statistical “noise”. Rightfully so in many cases. But given correct interpretation and proper follow-up research at times these scores can still potentially lead you to distinctive ancestors as well! Each case to be judged on its own merits. Based on table 14 we might already find justification to regard the “Africa North”, “Middle East” and “European Jewish” scores as quite robust. Because in fact these regions were often also reported above trace level. For the remaining regions we can see from the average and median scores that generally speaking these were rather trivial results. In fact most of the time these regions, especially “Pacific Islander” and “Native American” were not reported at all (“# 0% scores”). Overall being very rare and therefore highly atypical outcomes for my Cape Verdean survey group.
***
Table 15 (click to enlarge)

This table is based on my ongoing survey of AncestryDNA results around the world. Featuring the group averages among the most likely source populations for “Africa North” and “Middle East” scores when reported for Cape Verdeans.
***
Figure 8 (click to enlarge)

These screenshots show a selection of plausible source population for “Africa North” and “Middle East”. Take note that the (mixed) Sephardi result does not show any substantial “Africa North” but it does include high “Europe South”, “Middle East” and “Caucasus” amounts
***
In my 2015 discussion (section 4) of Cape Verdean AncestryDNA results I already gave a detailed account of where the “Africa North” scores might possibly hail from when reported for Cape Verdeans. Describing at least 4 ancestral scenario’s involving direct or indirect inheritance by way of either Portuguese, Fula, Sephardi Jewish or Mauritanian/Moroccan ancestors. I will now also include “Middle East” in this discussion as this is in fact a closely related region for “Africa North”. Table 15 shows the group averages for both regions among the most plausible source populations for these DNA components (when appearing in the AncestryDNA results of Cape Verdeans). Regrettably I was not able to also include Sephardi Jews or Mauritanians for lack of samples. But otherwise the picture arising seems to be rather clear already. All three selected populations indeed being likely to have passed on such markers as they all possess them in sufficient degree. It must be noted though that similar to the “Iberian Peninsula” region the “Africa North” region is not perfectly predictive. Given the complex (pre)history of North Africa genetic affiliations with neighbouring populations to the east (“Middle East”) and also the southern Mediterranean (“Europe South” and “Iberian Peninsula”) are often expressed in the AncestryDNA results of actual North Africans. For more details:
- North African AncestryDNA results
- Fula AncestryDNA results (spreadsheet)
- Portuguese AncestryDNA results (spreadsheet)
In 2015 I cautioned that definite answers to the question how these regional scores are to be explained may not be provided yet. Especially given that “individual family trees will also stand in the way of a “one size fits all” narrative.” Still going by what I discussed in the previous section 5 I do now have additional reason to believe that generally speaking an indirect inheritance by way of Portuguese ancestors might be most relevant for Cape Verdeans. Take notice for example how in table 14 the group average for “Africa North” among 32 Portuguese (5.5%) is nearly twice as high as it is among 100 Cape Verdeans (2.9%). This would make sense given that my Cape Verdean survey participants are also on average about half European genetically speaking. Such reasoning is reinforced by the fact that the highest “Africa North” scores were usually obtained by my Cape Verdean survey participants with increased level of European admixture. Furthermore these people were very often being assigned to the “Portuguese” migration!
But this positive correlation with Portuguese admixture did not always manifest itself. Especially not for “Middle East” scores. In fact the group average for “Middle East” among Cape Verdeans (2.3%) is higher than among Portuguese (1.5%). Not by much but even more so when correcting for African admixture. Leading me to assume that additional ancestral scenario’s might exist. In particular a Sephardi Jewish connection may be suggested in several cases. Even though I have only seen very few Sephardi Jewish results it is likely that on average they will show substantial amounts of “Middle East” in their breakdown as well as “Europe South” actually (see figure 8).
On the other hand it cannot be ruled out either that in individual cases also Fula ancestry might still (partially) be responsible for both “Africa North” and “Middle East” scores among Cape Verdeans. As shown in table 14 the Fula people actually possess these DNA markers to a greater degree than Portuguese. Fula ancestors are also perfectly plausible as they have been present in Cape Verde from the early 1500’s. Despite lack of detailed data I do think it is safe to say that the average proportion of Fula ancestry among Cape Verdeans will be far lower than the average proportion of Portuguese ancestry. Given that the Upper Guinean roots of Cape Verdeans are multiple and varied and not restricted to just one ethnic group (see Top 20 ethnic roots). So in that way the odds of a Fula ancestral scenario might be decreased but nonetheless still valid!
Obviously more corroborating evidence needs to be forthcoming to confirm any of these speculative scenario’s. Also the upcoming update of AncestryDNA, especially by introducing a new “Portugal” region, might very well reduce or even eliminate some of these regional scores (see section 7). In the meanwhile however from my experience a very promising avenue of follow-up research would be to systematically scan your DNA matches. To see if any Portuguese, North African, Fula or Sephardi Jewish DNA matches show up. I have actually already done this for 50 of my Cape Verdean survey participants (using my filtering method in Excel) and I will report the outcomes in greater detail in my next blog post. I can already reveal that all of these aforementioned matches are indeed being reported for Cape Verdeans. Albeit with different frequency and also differences in shared segment size.
- DNA matches reported for 50 Cape Verdeans on AncestryDNA (part 1)
- How to find those elusive African [and European] DNA matches on Ancestry
Jewish admixture impacted by dilution?
Table 16 (click to enlarge)

This table is showing the group averages for the specified regions. Also according to island background. The island origins of my survey participants are not based on a 4 grand parents criterium per se. As many people were not fully aware. See also footnote 6.
***
In table 16 the group averages for “Africa North”, “Middle East”, “European Jewish” etc. are also being shown as specified by island (grouping). Potentially an interesting research field given founding effects from particular settlers who may have been more numerous in certain islands than others. For example exiled Mourisco’s or Conversos. However at this stage not much island variation is showing up. Atleast not very statistically meaningful. Especially given that the sample size for Santiago is very minimal. Still it seems that “Africa North” is slightly peaking for not only Brava but also Fogo and interestingly Santiago. Santo Antão had quite a few high “Middle East” outliers, but interestingly again Santiago has a rather elevated group average as well. While “European Jewish” sofar is rather evenly spread and generally subdued across the islands.
Unlike you might have expected the overall level of “Africa North” or “European Jewish” for my Cape Verdean survey group actually is not very striking when compared with the Portuguese or other nationalities I have included in my AncestryDNA survey. Although it does stand out when compared with survey groups without an Iberian background, such as African Americans. And again also the maximum values must be kept in mind. See also:
Within my Cape Verdean survey group there were at least 4 (unrelated) persons with confirmed Moroccan Jewish lineage from the late 1800’s. Two of them shown in figure 7. Some of these persons did indeed show rather high “European Jewish” scores, up to 9%. But on average for these 4 people “European Jewish” was around 5%. Indicating the generally rapid dilution of DNA when originating from one single family line. After 7 or 8 generations the genetic inheritance from one single ancestor might actually already not be detectable in DNA testing, especially with unfavourable recombination. This is sometimes called a genetic “wash-out” and comparable to the very minor or even absent Native American admixture results being reported for many Americans. Who are often shocked by this outcome because they were expecting much more based on family lore. See also:
I still have reason to believe however that “European Jewish” is not a perfect indicator of Sephardi Jewish lineage because it is first most describing genetic similarity with Ashkenazi samples (from East Europe). Despite shared origins the Sephardi Jews still having a diverging genetic make-up because of their different Diaspora experience. First in Portugal & Spain and then into Morocco. Ashkenazi genetics perhaps standing out as more distinctive. Again I have not seen that many complete AncestryDNA results of Sephardi Jews (the one shown in figure 8 is mixed Ashkenazi & Sephardi). But I have seen several in profile preview whereby only regional ranking is visible. And from those observations I think it is very likely that they are described by AncestryDNA as a combination of “Europe South”, “Middle East” first most with “European Jewish” actually often being secondary or subdued and also “Africa North” often being entirely absent.
This is a crucial issue as it is the Sephardi Jews rather than the Ashkenazi Jews who have historically been most involved with Cape Verde. Most recently by way of Morocco and/or Gibraltar. This relatively recent geneflow is usually well documented and sometimes termed the “second wave” of Sephardi migrants/settlers within Cape Verdean society. The first wave taking place much earlier in the 1500’s due to the settlement of Conversos or exiled Crypto-Jews, from either Spain or Portugal. The genetic legacy of this first Sephardi “wave” probably being much more difficult to measure due to inevitable dilution. When compared with the second wave from the 1800’s/1900’s. Although given a certain critical mass and endogamy one might perhaps expect that a minimum level of Jewish admixture would still be maintained.
In short the last word has not yet been spoken on this topic 😉 More data is needed to reach any solid ground but perhaps the rather increased “Europe South” scores for Fogo islanders might already be indicative, as discussed in section 5. It is still also striking that the only result showing “European Jewish” as top ranking European region was for my survey participant from Santiago (see figure 2 and footnote 6). And in fact also a mestiço person from Guiné Bissau like wise had “European Jewish” in first place (see this screenshot). IBD matches with Sephardi people might also be a consequence of either first wave or second wave Sephardi Jewish settlers in Cape Verde. This is something I will try to revisit in my upcoming blog post. Another possibility to explore are Y-DNA haplogroups known to be highly suggestive of Jewish lineage. Two studies actually already have been devoted to this topic and presented fascinating outcomes. Follow the links below for further reading & background information:
- Ashkenazi, East European, Gypsy & Finnish AncestryDNA results (Tracing African Roots)
- Moroccan Jewish migration to Cape Verde (Cape Verde Jewish Heritage Project)
- Creolization and the Jewish Presence in Cabo Verde, 1497-1672 (T. Green, 2006)
- Estimated admixture proportions (incl. Sephardic Jews & North Africa) of Y-chromosome lineages from Cape Verde (Beleza et al., 2012, p.6)
- Y-chromosome lineages in Cabo Verde Islands witness the diverse geographic origin of its first male settlers. (Gonçalves et al., 2003)
Too “exotic” to be true? Trace admixture from: Asia, Americas and the Pacific
Figure 9 (click to enlarge)

This selection of screenshots is featuring the more “exotic” trace regions being reported for my survey participants. Although for the most part quite infrequently so and also usually very subdued. Except for “Asia South”.
***
In the sections above I have dealt with ancestral scenario’s for which a convincing degree of historical plausibility may exist. At first sight one might be inclined to say that this is not the case for the trace regions being highlighted in figure 9. Especially “Native American”, “Asia Central”, “Polynesia” and “Melanesia” seem quite outlandish given Cape Verde’s location! As already shown in table 14, these trace regions are actually appearing very infrequently and except for the Asian regions always at a very minimal level. For example “Native America” only was reported for 5 of my 100 survey participants with a maximum score of 1%. Therefore automatically to be taken with the proverbial grain of salt. I would however argue against complete dismissal in all cases.
The first thing to keep in mind is that the regional labeling on AncestryDNA can be quite misleading given genetic similarities & ancient migrations. For example socalled “Pacific Islander” scores are almost always combined with “Asia East” or “Asia South” amounts (when these latter regions are reported with substantial amounts >10%). And therefore in such cases they can safely be considered as merely mislabeled regions to be added to the Asian amounts indicating either Chinese or Indian lineage for Afro-Diasporans. In other cases Pacific Islander scores (especially “Polynesia”) might also suggest Southeast Asian lineage. The same goes for “Asia Central” which is again quite ambivalent and might be suggestive of Native American or South Asian lineage rather. Hopefully the upcoming update on AncestryDNA will reduce this confusing trace region reporting.
It is worth repeating again that without additional clues and corroborating evidence your attempts to trace back trace regions to specific ancestors or ethnic groups could very well lead to a dead end. Conjecture and unfounded speculation can then quickly turn to self deception. To improve correct interpretation of your unexpected results learn more about how other people of such background tend to be described by AncestryDNA. You will also reach a deeper understanding when you stop fixating on the regional labeling too much. You can still obtain insightful information, even from trace regions, as long as you adopt a broader perspective on genetics and resist jumping to premature conclusions. Follow these links for more details:
- Asian, Pacific & Native American AncestryDNA results
- East Asian & Polynesian AncestryDNA results
- South Asian & Melanesian AncestryDNA results
____________________
“a single mtDNA, an erratic in the Cabo Verde mtDNA pool, belongs to the Asian haplogroup B and, quite surprisingly, has the so-called Polynesian motif.” The explanation: “According to the family’s oral tradition of this subject, the great-grandmother (in the maternal line) came from North America to Boavista and was assumed to be a Navajo. In view of the mtDNA a Hawaiian origin, for example, would seem more plausible.” (Mitochondrial portrait of the Cabo Verde archipelago: the Senegambian outpost of Atlantic slave trade, Brehms et al, 2002, p.55)
____________________
Then again if one takes a closer and more detailed look into Cape Verde’s long history of being a strategically located stop-over for trans-oceanic vessels, with not only various Atlantic destinations but also Asian and Pacific destinations. And when one combines that knowledge with the circumstance that many Cape Verdean sailors and migrants at times chose to return to Cape Verde bringing along spouse and children from foreign countries, such seemingly “exotic” scores may start to become more credible. Even when overall historical plausibility must be leading the rather randomized movements of individuals across place & time should not be underestimated! I cannot specify the needed follow-up research or relevant context for all these cases. But a thorough analysis of one’s DNA matches may very well clarify such connections. In my experience especially in regards with South Asian admixture. Although usually not as conclusively as mentioned in the quote above. For another interesting account of possibly Pacific ancestry for one particular Cape Verdean family see:
- Our Ancestors Came from Many Bloods» Gendered Narrations of a Hybrid Nation (F. Rodrigues, 2005)
7) Upcoming Update?
Figure 10 (click to enlarge)
***
It is sometimes said that your DNA results are only as good as the next update. So it’s best not to get too attached to them 😉 Given scientific advancements and a greater number of relevant reference samples hopefully a greater degree of accuracy may be obtained in the near future. But naturally no guarantees are given that this will indeed be the case. AncestryDNA’s intended update promises to create several new regions. Especially for Europe & Asia, but none for West Africa. At the moment of writing this blog post there is still quite some uncertainty if AncestryDNA’s intended update will indeed be implemented or remain stuck in beta phase (as happened in 2016). I will therefore refrain from any in-depth judgement for now. For more details about the update:
- Updated “ethnicity” estimates at AncestryDNA (Cruwys News)
- AncestryDNA New 150+ Regions (Youtube)
My survey has been based on the current version of AncestryDNA’s Ethnicity Estimates. It remains to be seen therefore how well my present findings will correspond with any newly calculated AncestryDNA results. Will they be rendered completely obsolete or may they still contain lasting insights about the approximate ancestral composition for my Cape Verdean survey group? Based just on the few updated results I have seen for 4 Cape Verdeans (see figure 10 & 11) I expect that the continental breakdown is bound to remain quite steady. As these scores tend to be most reliable in admixture analysis. Given that Ancestry’s algorithm is said to have been improved this may actually lead to a decrease of misleading trace region reporting and a greater focus on a genealogically meaningful timeframe (going back 500 years or so).
Due to the creation of a new “Portugal” region the European breakdown for Cape Verdeans could very well see some major improvement. Proving that the “Iberian Peninsula” region in the current version of AncestryDNA was indeed underestimating genuine Portuguese lineage. This new “Portugal” region is still not likely to be 100% accurate however. In particular it may cause some overlapping regional scores for “France” and especially “Spain” (see Portuguese results in figure 10). But overall it should make it more easier to distinguish between ancient and genealogical admixture. Quite likely many of the seemingly West European regions being reported for my Cape Verdean survey participants will decrease while possibly also the “Middle East” and “Africa North” scores might diminish. It will be very interesting to see to what degree the European breakdown of Cape Verdeans will still be showing indications of non-Portuguese lineage after the update has been fully implemented.
Figure 11 (click to enlarge)
***

This person from Santo Antão had the highest “Cameroon/Congo” score in my survey (see figure 5 ). However it seems the update (shown on the left) has resulted in an improved detection of Upper Guinean roots (“Senegal” and “Mali”) even if the internal composition has shifted. “Mali” increasing from 4% to 36% and “Senegal” decreasing from 34% to 22%. However combined they are now 58% (36+22) while it used to be 38% (34 +4). Take note also how the 8% “Nigeria” has completely disappeared. And may therefore have been a misreading on AncestryDNA’s part. Also interesting to see how the 8% “Europe South” has been refined into only 1% “Italy”. While the new “Portugal” score looks very convincing indeed.
***
Within the African breakdown the major changes do not seem to be caused by any new regions. But rather because of the inclusion of new samples and/or the improved algorithm. The decrease of “Mali” at the dispense of “Senegal” is likely to be a recurring theme. Naturally these regions are still both suggestive of Upper Guinean ancestry of course. As I have been arguing from the outset of my survey and also in section 3 of this blogpost. Without knowing which exact reference populations Ancestry is using to calculate these new results for “Mali” and “Senegal” it will be difficult to infer anything else though. As always the country name labeling of ancestral categories in DNA testing is not to be taken too literally. A person from Guiné Bissau or Gambia could very well also get a predominant “Mali ” score when his results get updated.
The combined scores of “Senegal” and “Mali” will be a good measure to evaluate updated results by comparing with the breakdowns obtained within the current version. If the degree of Upper Guinea within the scaled African breakdown increases this arguably can be seen as an improvement. For example in figure 11 it seems that the elimination of most of the unexpected regional scores for “Cameroon/Congo” and “Nigeria” will diminish the odds of being mislead about Cape Verde’s predominantly Upper Guinean roots. Even if such Lower Guinean (as suggested by “Nigeria”) or Central African lineage (as suggested by “Cameroon/Congo”) might still be possible. But this subdued degree of only 3% “Cameroon, Congo, and Southern Bantu Peoples” does seem more realistic (see also section 4).
Still if the substitution of formerly “Senegal” scores by “Mali” scores is indeed going to be realized for most Cape Verdean results I have to say that I find such a consequence rather lamentable. The very consistent top ranking frequency of “Senegal” among my Cape Verdean survey participants (94/100) has arguably been one of my main research findings. While it was quite rare to have “Mali” show up as biggest region (5/100) (see chart 1). Any major shift in this outcome may very well lead to unnecessary confusion or a decrease of people’s confidence in their results. After all a generalized predominance of so-called “Mali” scores will be obscuring Cape Verde’s varied roots across the Upper Guinean area. Even though again both “Senegal” and “Mali” regions are ultimately indicative of Upper Guinean lineage. But due to the country name labeling people might get the wrong impression about Cape Verde’s Upper Guinean roots really being much more coastal, incl. Guiné Bissau, rather than interior17. As I have argued in a previous blog post any potentially misleading labeling of ancestral regions should be avoided. As they may convey a false sense of accuracy. See also:
- Regional origins within Upper Guinea for Cape Verdeans (Cabo Verde Raizes Na Africa)
- Suggestions for improving the African breakdown on AncestryDNA (Tracing African Roots)
***
Figure 12 (click to enlarge)

Although still in beta phase it seems that 23andme will FINALLY be offering a detailed African breakdown as has been highly anticipated for 5 years already! Especially this new category named “Senegambian & Guinean” should be very relevant for Cape Verdeans! If you follow this link you can see the proposed update in full detail: https://you.23andme.com/published/reports/cf3b3cb317584f76/
***
Arguably “Senegambian & Guinean” would make for a far more fitting proxy labeling for Cape Verde’s Upper Guinean lineage than either “Mali” or “Senegal”. Intriguingly this term has recently been proposed by 23andme as one of their new African categories (see figure 12). It will be very interesting to see which company (23andme or Ancestry) will eventually provide the most fitting African breakdown, in line with historically documented origins of Cape Verdeans and other parts of the Afro-Diaspora.
Either way I intend to once again contrast Ancestry’s updated results with historical plausibility as well as the results of actual Africans, Asians, Europeans, Native Americans etc.. As I will keep aiming for combining insights from various fields. Always looking for correct interpretation. Critical but also staying open-minded and careful not to be dismissive when informational value can still be obtained. In regards to Cape Verde’s generally mixed origins it can be said that we may be like our delicious national stew dish catchupa. Having varying ingredients in various proportions according to circumstance or recipe. Locally grown or imported. To enjoy a good catchupa you do not need to know its exact composition however acquiring detailed knowledge about its ingredients may very well be nutritious in more than just one way!
___________________________________________________________________________
Notes
1) For a vast majority of my survey participants I received confirmation of their Cape Verdean background by way of PM. In a few cases I was informed by my survey participants that they were aware of migrant ancestors in their family tree, going beyond my 4 Cape Verde-born grandparents criterium. For example 1 Portuguese great grandparent or 1 Moroccan Jewish great-great grandparent. As such lineage is generally in line with Cape Verde’s history of incoming migrants I have included these results in my survey. Whenever these ancestral details were available to me I have mentioned them in column AK in my spread sheet.
Aside from PM’s and public family trees I also tried to verify the background of my survey participants in other ways. Naturally to the best of my ability. Going by any clues given but in particular: plausible surnames and plausible regional combinations as well as the “migrations” mentioned in AncestryDNA’s Ethnicity Estimates. Taking a cautious approach and preferring to leave out possible survey participants when in doubt. I have actually also kept score of the AncestryDNA results for people of partial Cape Verdean descent. These can be seen in my spreadsheet under the heading “Partially CV”.
2) I am myself Dutch-born and have an ethnic Dutch father aside from my Cape Verdean-born mother. So therefore I perfectly understand how multiple and layered identities can co-exist with a deeply felt attachment to Caboverdeanidade.
3) The full potential of the migration/genetic community tool on Ancestry may not have been realized yet but I always believe in maximizing informational value despite imperfections. Overhasty dismissal based on unrealistic expectations can deprive you from helpful clues you may not realize at first hand. Like I stated in the main text above this migration tool provides an easy and systematic way to organize your matches along a certain part of your ancestry you like to zoom into. In particular it helps tremendously in sorting out your Cape Verdean related DNA matches. However many people in the mislabeled “Portuguese Islander” migration are also in fact mixed with African Americans. Others are mixed with Portuguese-Americans, Irish-Americans, Italian-Americans, Hispanic-Americans etc, and also many with Hawaiians (due to whaling connections). As long as the Cape Verdean relationship is relatively recent (going back to about 4/5 generations I believe) you are liable to end up in this genetic community.
It also offers an extra much needed dimension to the ethnicity estimates, enabling a more specific identification for many people. In fact I have used this tool to countercheck if any of my Cape Verdean American survey participants had any mixed American lineage they might not have been aware of themselves. The various American migrations (for African Americans, Euro Americans and Hispanic Americans) being especially predictive in my experience. Consistently showing up for people of mixed Cape Verdean background who shared their profiles with me.
In regards to the “story” behind the mislabeled “Portuguese Islander” migration. I didn’t have any high expectations as I understand these type of overviews need to be simplified for the general public… But I find especially the text for 1800-1825 lacking in detail (the other ones dealing with migration to the US are quite good though).
“ Further south on the Cape Verde islands, Portuguese settlers established sugar and cotton plantations and enslaved West Africans to work their fields. Over time, Cape Verde developed a mixed-race population. No laws banned interracial marriage, and Portuguese men had children with female slaves, often granting freedom to their offspring.” (Ancestry.com)
Cape Verde was not merely a slave trading post (this activity arguably became marginal after the 1600’s) and it was far from being a classical plantation economy due to climatic factors. Trade with the African mainland was not restricted to just slaves but included all sorts of products, incl. wax, gold, hides, horses, kola nuts etc.. A major reason for setting up the colony from the beginning was Cape Verde’s strategical location. In the 1600’s and onwards it’s main economic function was arguably more so providing passing trading ships with fresh water, vegetables & fruit. Also exports of salt and textiles (panos) were main industries. Not much is known of the particulars but I suspect a majority of Cape Verdeans would have been selfreliant peasants already in the early 1700’s when according to census the enslaved portion of the population was clearly in the minority, around 17%. For references see: Consulted Literature for CABO VERDE RAIZES NA AFRICA
4) I have done a quick analysis of the most plausible background of the mere 25 matches being shared with my Cape Verdean survey participant within the migration called “African Caribbeans”. Based on all clues given on the profile pages of these matches, such as surnames, public family trees, ethnicity summary etc.. Without having absolute certainty I believe atleast 14 are indeed Caribbean, but 6 matches could actually be fellow Cape Verdeans. Two persons seem Hispanic and two others appear to have recent mixed Portuguese lineage. One person was an African American from Louisiana. So perhaps not really a convincing basis for being assigned to this migration afterall.
5) For an example of a seriously misleading classification of Cape Verdeans see this entry in the online version of Encyclopædia Britannica.

Commonly around 28% of Cape Verde’s population is labeled as “African” (based on uncritical copying of CIA factbook info), even when these are just darker-skinned (‘black”) Cape Verdeans whose families have been living in Cape Verde (esp. Santiago) for many centuries already! The Encyclopædia Britannica takes this potentially misleading labeling for a subgroup of genuine Cape Verdeans one step further by giving an ethnic specification which to my knowledge is completely fictitious and unfounded! Which is not to say these ethnic lineages (Fula, Balanta etc) would not be plausible for all Cape Verdeans. To be traced back many generations ago though. But nowadays aside from recent West African migrants, a.k.a. “Mandjak” (who are a small minority of less than 3%, see these source) Cape Verdeans themselves do not adhere to these ethnic identities. Rather they consider themselves to be Cape Verdean or Crioulo, regardless of racial appearance!
This entry is supposedly based on a source from 2000 which I could not find being specified anywhere on their site…Eventhough to my knowledge no official data is being kept on racial or ethnic background of Cape Verdeans since independence in 1975. Obviously the 69,6% mestiço number is rather taken from the 1950 census, apparently the last time racial origin was counted in Cape Verde (see this source or also this one).
6) I tried to verify the island origins of my survey participants to the best of my ability. All the overviews specifying island origins on this page are merely an approximation though and not based on a 4 grand parents criterium per se. As many people were not fully aware. A greater part of my survey participants had mixed island origins already within the last 2 generations. Let alone going back further in time. Barlavento is referring to people with island origins from São Vicente, Santo Antão & São Nicolau, incl. mixed between those 3 islands. The same goes for Brava & Fogo, which also includes people with combined Brava & Fogo island origins. Regrettably only very few persons had island origins from Boavista and Sal but they were mixed with other island origins as well.
7) For the survey participant who scored 19% African I have received confirmation by PM and could also verify through public family tree that at least all 4 grand parents were indeed from Brava. For the survey participant with 86% African it’s a bit more complicated because this person was adopted and only has birth certificates to go by. One of the birthparents was indeed born in Santiago. However for the other birth parent São Tomé & Principe was given as birth location. Given the presence of Cape Verdean migrants (incl. also many from Santiago, see this source) and their descendants in São Tomé & Principe this information in itself does not rule out that this person’s grandparents could still all be from Santiago. I have kindly been given access to also view the DNA matches of this survey participant and combined with the African breakdown (predom. “Senegal” + Mali”: 57/86) I find a fully Cape Verdean/Santiago background to be very plausible. Which is why I have included this person in my survey eventhough I do not have 100% certainty.
8) In our current age being “mixed” along with “diversity” is often being attached with positive associations (inspite of being politically contested as well). Judging from the reactions of some DNA testers one may even get the impression that admixture especially when involving unexpected and “exotic” types of lineage is sometimes being placed on a pedestal 😉 Test results reflecting only one predominant type of ancestral lineage on the other hand are sometimes said to be “bland” or “boring”. I personally do not have any preconceived opinions about being “mixed” or not. I find homogeneous DNA test results just as interesting as more diverse ones. In both cases they speak of a person’s ancestral heritage which will always be fascinating for that reason alone already. Overall speaking Cape Verdeans might very well be among the most equally balanced admixed populations in the world. However this is not some kind of competition. And much also depends on how you define being “mixed”. Is it just a racial thing or does intra-African or intra-European mixing between ethnic groups also count? Going back in time far enough every one can be said to be mixed to some degree, even in continental terms. Ongoing research is steadily revealing this to be the case, both for Europeans and Africans. Returning to my Cape Verdean survey results I find it intriguing that even for the persons showing relatively lesser amounts of admixture the typical and all pervasive blending of mainly Upper Guinean, Portuguese and to a lesser degree Jewish components is still surfacing, regardless of the actual proportions.
9) One major difference to keep in mind is that AncestryDNA includes “Africa North” in its total African admixture proportions. Which goes against common practice in DNA studies which usually separate Sub-Saharan African (SSA) DNA from North African DNA (because of its greater similarity with West Eurasian DNA). Overall this does not really impact my analysis. Although strictly speaking the group average of 2.9% “Africa North” should be deducted from the African group averages I calculated for a proper comparison.
Although published in 2012 and 2013 the Beleza et al. studies are most likely based on genotyping performed already in 2010 (see this article from A Semana). Instead of using the more common ADMIXTURE software it uses Frappe. Given the quick developments in the field of DNA-testing it is quite likely therefore that AncestryDNA’s genotyping is more up-to-date and offering greater resolution. Verdu et al. (2017) is a more recent paper and likewise provides higher resolution as measured for example by the number of 2,304,069 autosomal SNPs being analyzed (Verdu et al, p.2536). It is very unfortunate though that this study does not provide any exact admixture proportions or statistics aside from a few charts.
Another indication of different methodologies can be found in the actual reference populations being used to establish admixture proportions. In case of Beleza et al. (2012 & 2013) their Cape Verdean dataset is being compared with two other datasets only: 60 white Americans from Utah (CEU) and 60 Yoruba Nigerians (YRI) from the 1000 genomes database. While Ancestry’s current Reference Panel (version 2.0) is made up of 3,000 samples from 26 different global regions, incl. nine from several parts of Africa! Much wider in scope therefore. In Verdu et al. (2017) a conscious decision seems to have been made to only use the closest fitting reference samples available. 109 Gambian Mandinka, 22 Senegalese Mandenka, 107 Iberian, 28 French and 89 British samples again from the 1000 genomes database as well as the HGDP database (Verdu et al, p.2537). Which can be very insightful but possibly underestimates origins beyond Upper Guinea and Southwestern Europe.
Read these articles for more details:
- Autosomal DNA testing comparison chart (ISOGG)
- Softwares and methods for estimating genetic ancestry in human populations (Liu et al., 2013)
10) In Beleza et al. (2012) a fascinating and very useful account is given about the settlement patterns of the various Cape Verdean islands. Even though rich in historical detail I do find that in some aspects the hypotheses being proposed by the authors are too rigidly trying to fit their genetic research data into one single model. In particular their theory on why Santiago should have a higher African admixture level than Fogo:
“Fogo island displays low African ancestry levels that are
similar to the northern islands, even though its settlement history is
concurrent with Santiago and based on the same slave labor
system [17]. It is likely that this discrepancy resulted from
differential survival and integration levels of ‘‘rural slave’’
communities after slavery was abolished. According to this
interpretation, the emergent societies of the islands of Fogo and
Santiago would have been divided into two major subgroups with
very different reproductive success: one composed by the offspring
of mixed unions between European men and ‘‘domestic’’ slave
women, which later became the major ruling segment of the Cape
Verde society; and the other composed by the ‘‘rural slaves’’ who,
due to their higher mortalities (both pre- and post-reproductive,)
had to be continuously replaced by other enslaved Africans from
the mainland. Historical work has shown that the slave labor
system was more extreme and lasted longer in Fogo than in
Santiago [14]. In addition, it is likely that the relative proportions
of ‘‘rural slaves’’ and admixed rulers were higher in Santiago than
in Fogo, because of the larger size of the former. In this setting, the
higher levels of African ancestry presently observed in Santiago
were likely to be caused by demographic and social conditions
favoring the attenuation of cultural mediated forms of differential
reproductive success [54,55] between admixed rulers and former
slaves.” Beleza et al. (2012, p.10).
Although I agree that such a demographic mechanism could indeed partially explain the difference in African admixture levels between Fogo & Santiago. I am still missing the role of Badiu or runaway slave a.k.a. maroon communities in Santiago. Most likely already arising in the 1500’s and later on in time also replenished by manumitted ex-slaves. Due to favourable geography I would assume that Santiago was more suitable to host such communities when compared with Fogo. And this could then account for a greater retention of African genetics (as well as culture) within Santiago as well.
In the quote above it is also mentioned that due to high mortality rural slaves had to be “continuously replaced by other enslaved Africans from the mainland“. I am however under the impression that Cape Verde’s enslaved population was heavily creolized (locally born) already in the 1600’s (see this blog post). While going by the census taken in 1856 only 1% of Cape Verde’s population might then have been born in mainland Africa (see this blog post). Also inspite of the persistence of slavery its overall impact on Cape Verde’s population composition must have been quite limited going by the census taken in 1731. Even for Fogo and Santiago where relatively speaking the slavery system endured the longest. For Santiago the share of enslaved persons within the entire island population being less than 20% and for Fogo around 25% in 1731. While already then Fogo was having a noticeably higher share of mestiços: 58% versus 14% for Santiago (see various tables on this page). So it seems to me that the reason for higher African admixture in Santiago must mostly be found rather in the preceding centuries (1500’s/1600’s).
Then again this theory of differentiated reproduction rates for various segments of Cape Verde’s population might also (partially) explain why the mestiço/mixed race share of Cape Verde’s total population has steadily been increasing between 1731 and 1900! Another aspect to take into consideration then also being the role of mulatto/mestiço men in the dispersion of European genes among the Cape Verdean population. For example the spread of European Y-haplogroups is not per se a reflection of the reproduction rate of European men but also their mixed-race male descendants! Especially when being privileged by some relative social status they may have had disproportionate offspring, incl. also with unmixed “black” Cape Verdean women. Just going by anecdotal evidence many Cape Verdean men of older generations tended to be boastful of the number of children they had conceived 😉 Hopefully future research will be able to shed more light on this topic.
11) This possible correlation between Upper Guinean lineage and regional scores for either “Ivory Coast/Ghana” or “South-Central Hunter-Gatherers” will be strongly context-dependent and quite ambivalent without further clues. For Cape Verdeans however I do believe that going by historical plausibility such a case can be made. In particular for Sierra Leonean or related Guinean (Bissau/Conakry) lineage. From table 7 it can be verified that people from Sierra Leone are described by AncestryDNA mainly as a combination of “Ivory Coast/Ghana” as well as “Senegal” and “Mali” with also a minor but consistent frequency of “South-Central Hunter-Gatherers” scores (termed “Pygmy/San” in my survey). Although other explanations might still be valid I do highly suspect that for example the 1.2% “Pygmy/San” group average for my Cape Verdean sample group is to be associated with Sierra Leonean lineage or related lineage from Guinea Bissau/Conakry. While for instance the 20% maximum score for “Ivory Coast/Ghana” for my survey participant with presumed island origins from Santiago (see footnote 7) also seems quite likely to denote either Sierra Leonean or related Guinean (Bissau/Conakry) lineage. Very interestingly my only survey participant from Guiné Bissau actually scored a very similar amount for “Ivory Coast/Ghana”: 22%! See also:
- South-Central Hunter-Gatherers” suggestive of remnant West African Pygmy DNA?
- West African AncestryDNA results (part 1)
- Youtube video showing the results for the person from Guiné Bissau
12) In my comparison of Cape Verdean samples with Upper Guinean samples, as shown in table 9, I have decided to only rely on non-Fula samples. In order not to make things more complex because of the additional West Asian and North African admixture being reported for Fula persons. Preventing an evenhanded comparison. Even when in fact the number of Fula persons in my African survey (n=43) is much more ample than for non-Fula Upper Guineans (n=5). DNA testing probably being more popular among the former. I also decided to remove one atypical Gambian survey result from the group averages. Because of partial Aku/Krio lineage expressing itself in an inflated “Benin/Togo” score. Finally I also chose not to include the one single mestiço sample from Guiné Bissau because of her mixed heritage possibly also including Cape Verdean lineage. See also:
- Fula AncestryDNA results (spreadsheet)
13) For those who also tested with 23andme there might be some exciting new developments on the way. As it seems that actually also this DNA testing company will FINALLY (after five years of empty promises) be providing their customers with a more detailed African breakdown. Incl. most likely a very suitable category for Upper Guinean lineage, called ” Senegambian & Guinean”. In addition they will have two more categories for specific parts of West Africa (“Coastal West African & “Nigeria”). As well as two distinctive categories for describing Bantu lineage (“Congolese Bantu” & “Great Rift Valley Bantu”) and finally also the “Sudanese” category for Northeast African DNA. I have not yet been able to ascertain how predictive these categories may be as this update is still in beta phase. However when fully implemented this should give Cape Verdeans with unexpected non-Upper Guinean scores the possibility to countercheck their AncestryDNA results. For a preview follow this link:
14) In order to make the European compositions for my sample groups inter-comparable I have scaled the European part of the AncestryDNA breakdown to 100%. This also enables a comparison with plausible European source populations. I have done the same for the African breakdown throughout my survey. Basically I applied the following formula:
- Scaled amount = % for a given European region divided by % of total European amount (all based on group averages)
The scaling formula I used is very simple therefore and can be verified from within the spreadsheet by clicking on any cell featuring a regional score and then viewing the calculation in the function bar (fx) in the upper left corner. All other Excel formulas I used throughout the sheet and especially in the tab “Stats” can also be verified in this same way.
15) The whole set-up of my European AncestryDNA survey is merely intended as an exploratory exercise. AncestryDNA’s regional framework (current version) is not best equipped to learn about specific ethnic details. Even when still insightful in itself, given correct interpretation. And hopefully to be improved by the upcoming update. In order to learn more about possible ethnic lineage on your European side I would recommend dedicated family tree research and a close analysis of your DNA matches. In order to zoom in to possibly European DNA matches you can use my filtering method as discussed in this blog post and apply an European filter rather than the African ones (4 & 5 in this sheet). I will apply this myself for 50 of my Cape Verdean survey participants in a follow-up to this blog post.
16) Also during a previous survey I performed among Cape Verdean 23andme results I came across a similar finding of somewhat increased Northwest European scores when compared with Latin Americans. Partially this may yet have been inherited by way of Portuguese ancestors as the Portuguese when tested on 23andme also score similar components (reflective of ancient migrations). However I do suspect that proportionally speaking this Northern/Western European component is more elevated for Cape Verdeans on 23andme than for Portuguese. The differential quite possibly to be explained by more recent admixture among Cape Verdeans through Dutch, French and English sailors I suppose. Follow this link for more details:
17) Given my ongoing African AncestryDNA survey results there really is a vast array of possible ancestral scenario’s to consider when wondering about what “Mali” may imply. Nonetheless many people who receive socalled “Mali” scores often seem to be eager to make a claim of having actual Malian lineage. The appeal seems apparent 😉. Afterall the Mali Empire has a glorious history and is also well known for its ruler Mansa Musa. Arguably one of the wealthiest persons to have ever lived. However both the genetic and even more so the cultural legacy of this medieval Mali empire (c.1200-1600) extends beyond modernday Mali’s borders! The Mande speaking people being widespread across Upper Guinea and the western Sahel. And despite many shared traditions these people do also have distinctive and separate ethnic identities.
And just to reiterate any “Mali” score is not per se indicative of Mandé lineage per se! In the current version both Atlantic & Gur speaking people from surrounding countries tend to score high “Mali” amounts. The updated “Mali” region may very well contain additional samples aside from the mere 16 samples right now. Until Ancestry makes any detailed announcement about these samples we cannot be sure what exactly these “Mali” scores are measuring. However by comparing with the results of actual Africans with verified background we can gain more insight! For more details see:
__________________________________________________________________________
Sources:
Beleza et al. (2012). The Admixture Structure and Genetic Variation of the Archipelago of Cape Verde and Its Implications for Admixture Mapping Studies. PLoS ONE 7 (11), (available online).
Beleza et al. (2013). Genetic Architecture of Skin and Eye Color in an African-European Admixed Population. PLoS Genet 9 (3), (available online).
Verdu et al. (2017). Parallel Trajectories of Genetic and Linguistic Admixture in a Genetically Admixed Creole Population. Current Biology, 27 (16), 2529-2535. (see also this article)
Wheat, D. (2016). Atlantic Africa and the Spanish Caribbean, 1570-1640. (available online)

Thanks for this awesome blog. I have an unrelated question, I’m AA and my Mali score was 12% also my Senegal score was 3%. Does this mean that I am 15% Mandenka? Also, I have no Africa north or Middle East. Do you think I could have some Fula or Hausa in there?
LikeLiked by 1 person
Thanks Joshua! Eventhough AncestryDNA’s African breakdown can be very useful, it’s still also sketchy and not suitable for pinpointing ethnicity in a conclusive fashion.I would advise you to have a closer look into your DNA matches and see if you have any matches in alignment with your Upper Guinean roots.
https://tracingafricanroots.wordpress.com/2017/05/10/how-to-find-those-elusive-african-dna-matches-on-ancestry-com/
LikeLike
Hello. So I was able to find a Nigerian cousin on Ancestry who has similar results as mine. She also stated that she is half-Igbo and half-ibibio.
My results:
46% Nigerian
14% Cameroon/Congo
12% Mali
12% IvoryCoast/Ghana
8% Great Britain
3% Senegal
2% Africa SE Bantu
2% Africa SC HG
1% Native American
Her results:
73% Nigerian
16% Cameroon/Congo
6% IvoryCoast/Ghana
2% Mali
3% Benin/Togo
1% Africa SC HG
LikeLiked by 1 person
Congratz! Impressive “Nigeria” score for your match. Although seemingly similar I would assume that all of the non-Nigerian scores being mentioned for your match are really a mislabeling of Nigerian genetic diversity. However in your case all the various African regions are much more likely to be traced to various places all over West Africa. As this would be in accordance with the known history of how African Americans evolved from multiple African origins.
LikeLike
Have your results updated?
Still waiting on mine.
LikeLike
Not yet, Ancestry is sure taking its time rolling out this update…
LikeLike
I have one more question. I have 1% Native American, and when I first saw it I thought it to be the native americans that we know of like cherokee, or navajo or something. But I’ve ran my results through different raw dna uploads and when native american comes up it’s never the USA Native american, it comes back as central american or south american. Could it be that for an african-american, Native American is a marker of african caribbeans? I know that during the slave trade many africans were taken to south america as well as central america.
How would you determine native american for african-americans?
LikeLike
Lastly, Ancestry gave me 12% Ivory Coast/Ghana and I found a possible ghanaian cousin. Her results are 96% Ivory Coast/Ghana, 2% Cameroon/Congo and the last 2% it doesn’t show.
I won’t give the first name but her last name is Antwi which from my research found out it’s an Ghanaian surname (Akan)
LikeLiked by 1 person
I’m not a big fan of the various admixture tools available on Gedmatch, DNA land and such. They can provide helpful information but you need to be very careful in your interpretation of their output. Which often can be misleading and contradictory.
Just going by historical plausibility I do no think there is any reason to assume your 1% Native America score is not in fact from a USA Native American group. Unless you have further clues to go by I would personally attempt to trace back such a line first of all by solid family tree research and secondly by a close analysis of your DNA matches. I have myself not performed such research but on these blogs you might get some further tips:
http://www.rootsandrecombinantdna.com/2016/12/interpreting-your-ethnicity-admixture.html
https://dna-explained.com/2017/11/01/native-american-dna-resources/
LikeLike
Wow, quite extensive as usual. A few observations/questions:
First like to start off by saying no offensve was taken, so this doesn’t come from a place of anger or really annoyance, either – and I am only speaking from my personal experience – but I do not think African Americans in general (and specifically younger generations) are at all as sensitive to how European ancestry entered their background as I’ve seen you sometimes imply from your understanding of our culture. It’s why you see so many African Americans taking dna tests, these days. Yes, I’d say for most the primary reason is to more closely located with the African communities from which are ancestors were taken; but a big reason is also the “surprise” of finding the smaller pieces of our heritage from outside that continent. We recognize that for most/many that European ancestry was usually the result of unfortunate circumstances, but we actually recognize it as historical fact and don’t carry too much cultural animus against anyone because of it. Just my personal opinion, but while discussions when it comes to African American history should be treated with a GENERAL sensitivity on here, on a page like this they don’t always have to be treated with such SPECIFIC sensitivity everytime our racial admixture is mentioned. We’re a pretty tough people, and very much capable of handling our complicated history. 🙂 Those who are less so, however, probably wouldn’t be here reading a detailed blog about genetics and history. Please feel more free to speak, offer fewer disclaimers, and less like we’re an angry monster in the background waiting to pounce at preceived offenses. 🙂
If you do not mind me asking, from which island (or islands) in Cape Verde does your mother trace her heritage? With this Cape Verdean update you’ve done, has it changed your understanding of your own Cape Verdean numbers? It was very interesting to learn about the different racial variations within the islands. I guess I’d alwasy suspected that some islands would have a bit more African or a bit more European heritage, but it was interesting to see which ones. What I’m particularly interested in – and you touched on it lightly – was how this is seen within the country. You mentioned “Badiu”, for instance. Can you explain a bit more the spirit of this word; what it means within Cape Verdean culture? Are there any islands seen as having a more “European” sub-culture? I understand and appreciate the creole culture of the islands is not race-based, but it is interesting to see how this is seen in the country when you really drill down.
Finally, while we’ve discussed how potentially unfortunate the possible updates may be for African regions, it seems that for Europe, things could potentially get much better. I see I’ve been under the (uneducated) assumption that people from Spain and Portugal weren’t that genetically distiguishable. Seperating the two into seperate regions will really help those have a better understanding of their heritage, particularly from the places each colonized. I’m also glad to see for the Portuguese and their descendants that the misleading “Great Britain” score will likely be pushed to more realistic levels. I can understand how the British can get so many regions because of ancient and then historical migrations, but the other way around can be misleading, IMO.
Anyway, as usual, really great read!
LikeLiked by 1 person
Thanks! I truly appreciate your well thought and frank feedback on my posts! Incl. taking a questioning stance which I find refreshing as I believe it makes for stimulating discussion and greater insight. And it also keeps me on my toes so to speak 😉 Your comment contains some profound observations which actually merit a much more detailed reply than I can offer right now. So I may revisit these themes later on. In fact I have been intending for a while now to publish blog posts in a similar format as this one but then being applied to my updated survey findings for African Americans, Brazilians, Jamaicans, Haitians, Dominicans etc. Aside from analyzing their scaled African breakdown also providing more details on their non-African admixture. Due to lack of time and the upcoming update on Ancestry I’m not sure I will be able to finish all these planned blog posts though.
Eventhough this is a serious topic that last comment did make me LOL, but in a good way 😉 It was not my intention at all to give such an impression! You may be right that I am being overcautious in offering disclaimers but perhaps that’s just in my nature. I actually always attempt to point out any limitations, shortcomings or possible bias in each one of my blog posts. Enabling my readers to judge for themselves how valid my musings on whichever subject may be, haha. As I do aim for an objective fact-driven blog which stays on focus. Taking a non-judgmental stance whenever possible.
The disclaimers you are referring to in this blogpost are not per se directed at African Americans. But they were indeed triggered by certain undercurrents in let’s say “Black Popular Culture” I personally have been observing. Just to clarify my position I am in no way suggesting African Americans are some kind of monolith! I am very much aware that varied opinions exist on the matter of European admixture. And many African Americans may be neutral towards to this issue indeed.
Eventhough I am of Cape Verdean descent and located in the Netherlands I would say I am fairly well informed. Because I have engaged in direct online discussions with many African Americans on this topic for atleast 8 years already (ever since I took my first DNA test in 2010). Also because of my efforts to collect DNA test results as well as just personal interest I have seen countless African Americans sharing their DNA results on the internet and social media. Often also including their reactions and appraisal of their European admixture results.
Naturally I cannot make any precise call on how widespread any perceived sensitivity about European admixture among African Americans may be. Afterall the internet does tend to give greater voice to those who may have more extremist ideas. However just from my personal experience I would say there is definitely an undercurrent of discontent or disconnect about European admixture among a considerable subsegment of African Americans, including “mainstream” ones. And as pointed out in this blog post I am fully understanding of such a stance. I believe that also the issue of “Blackness” and how it is defined and/or questioned is playing a large role in all of this. Based not only on appearance but nowadays also based on the degree of non-African admixture as showing up in personal DNA test results. The less than anticipated degree of Native American lineage (based on family lore) for many African Americans might also be an indicator. As these expectations were probably often based on ancestors from previous generations with either mistaken or concealed European admixture. I find this topic very interesting and worthy of more frank discussion. But this might not be the best place for it.
My main preoccupation in this blog post being Cape Verdean Americans as well as Cape Verdeans elsewhere (incl. the Netherlands and Cape Verde itself) being overtly influenced by an USA-specific perspective on racial admixture. At times even copying the more radical ideas being spread by fringe movements. This is again based on my personal observation. But quite plausible and apparent given ever increasing Americanization across the globe. This also includes a greater exposure to Black Popular Culture as it exists in the USA. I actually welcome this as I highly admire the achievements of African Americans in not only the cultural field but also in the social and political domain. And I do believe that inter-cultural exchange can be beneficial, generally speaking. Nonetheless I do also strongly believe that the local context of Cape Verdean society & history should not be bypassed when discussing European admixture. Personal family histories are bound to sometimes deviate from the assumed narrative. I also think it is self-defeating to allow generalizations about European admixture to determine how you should feel about your own unique DNA makeup. Especially without at least having done any basic genealogical & historical research of your own in advance.
LikeLiked by 1 person
My mother was born & raised in São Vicente, which is the second most populous island after Santiago. It’s known for its port city Mindelo which used to be an important stopover for British shipping in the late 1800’s and early 1900’s because of its coal deposit. But at least three of her grandparents are from the neighbouring island of Santo Antão. This island being mostly rural because of more favourable geography and rainfall. It was also settled much earlier than São Vicente which is mostly inhabited by people who have migrated there from other islands within the last 150 years or so. Eventhough just small islands I always found there’s a striking difference between the more cosmopolitan vibe in S. Vicente versus the more traditional atmosphere on Santo Antão.
To get an impression you may want to watch these Youtube videos:
Mindelo in the mid 1900’s
São Vicente present day
Santo Antão
I used to think my “Mali” amount was relatively high, when compared to my “Senegal” amount and total African being scaled to 100%. However I have seen more balanced proportions of both regions now. Plus I also suspect just “quirky” recombination may have caused that outcome for me as well as other Cape Verdeans with relatively lower amounts of overall African ancestry. And therefore not per se suggestive of a slightly different mix of Upper Guinean origins. I think recombination might also be a factor in the relatively higher seemingly Central African regional scores I received. I do think they might be suggestive of distinctive ancestors from possibly Angola or Mozambique. But I am not sure if these scores will be maintained after the update.
For me personally the most intriguing thing remains my 6% “Middle East”. Even when other Cape Verdeans in my survey have received similar amounts. It is still clearly towards the higher end of the range, the group average being around 2%. Especially given that I’m only half Cape Verdean. In a follow-up of this blog post I intend to explore this further by trying to find out if there is any correlation between Sephardi Jewish matches being reported for Cape Verdeans and their “Middle East” scores.
LikeLike
Yes indeed I also find it very interesting! There are actually quite a few studies which have been written about this topic. Not only about racial relations within Cape Verde. But also on how Cape Verdean Americans had to deal with a different perspective when arriving in the USA. I will see if I can add some links later on. Just quoting from a well researched dissertation, THE CAPE VERDEAN ‘COMMUNITY’ IN PORTUGAL: ANTHROPOLOGICAL CONSTRUCTIONS FROM WITHIN AND WITHOUT (Batalha, 2002, p.109):
It then goes on to describe that despite a recent surge in appreciation and even promotion of Badiu identity and aspects of its culture it actually used to be a pejorative term in origin. Based on the negative stigmatization of people with (nearly) exclusive African origins by Portuguese colonizers but also many of their mixed-race descendants in Cape Verde. This attitude lingers on to some extent also in the present day, especially among the older generations. In this sense it is a rather touchy subject. The more African inspired Badiu identity on Santiago is often being contrasted with the more European influenced socalled Sampadjudo identity of most of the other islands. Brava and Fogo traditionally standing out as the islands with the largest degree of European descended people. Both of these islands also providing the largest number of people migrating into the USA, atleast in the first waves (late 1800’s-mid 1900’s). However also the socalled Barlavento islands, incl. São Vicente, Santo Antão and São Nicolau, are often being grouped under this Sampadjudo label.
However from my own experience this contra-position derived from colonial times is a bit exaggerated as actually due to inter-island migration the differentiation is becoming less stark. Ever since Cape Verde gained its independence in 1975 there has been a major migration from the other islands into Praia, the capital of Santiago. And this has caused a new interpretation to arise of the Badiu term. Which, at least from my understanding, used to be more restrictively applied to the rural population of Santiago but nowadays is often more freely used to refer to all Santiago inhabitants. For example I have an aunt who went to live in Praia because of better employment opportunities. And both of her children were born and raised there. Despite their father also hailing from SãoVicente/Santo Antão these cousins of mine consider themselves to be Badiu because they speak the local Crioulo variant and just feel more at home there.
There are many other finer distinctions to be made in how the Badiu identity is to be seen as it is not a static concept but still under development. Also other dimensions are to be taken into consideration (such as island specific evolution of culture & population). So I do not think that race in itself or rather the degree of African admixture is the sole determinator of island variation. However it is also true that despite a great deal of relative racial harmony Cape Verdeans are not free of prejudice. They are afterall only human 😉 A quite telling phenomenon for example is how recent West African migrants from not only Guiné Bissau, but also neighbouring Senegal, Guinea Conakry but even Nigerians are all referred to and stereotyped by the blanket term “Mandjaku/Mandjak”. This is actually a distinctive ethnic group within Guiné Bissau, closely related to the Papel people (see this link). But Cape Verdeans use it as a catch-all phrase regardless of actual background. At times without any real malintent but sometimes also used with a pejorative or xenophobic undertone. These are issues Cape Verdeans need to still work on as their (very long) colonial past has not been fully processed yet.
LikeLike
True! The new European breakdown on Ancestry should really be an improvement and it will also be helpful to distinguish between genuine English lineage among Cape Verdeans (which may exist to a minor degree in individual cases) and the generally inflated and falsely labeled “Great Britain” scores in the current version which might in many cases actually have been inherited by way of Portuguese ancestors.
I will need to see more updated AncestryDNA results of actual Portuguese and Spanish persons for proper judgment. But from what I’ve seen sofar (also incl. Hispanic results) the distinction being made between “Portugal” and “Spain” is already quite impressive and certainly very helpful. Eventhough I do suspect it will be inevitable that some overlap will persist, also in fact including the new “France” category. Especially Galician origins from northern Spain and perhaps also Andalusian origins from southern Spain might often be mistaken for Portuguese and vice versa. A very extensive genetic study of the Iberian Peninsula was recently published which may be quite relevant in this regard:
Patterns of genetic differentiation and the footprints of historical migrations in the Iberian Peninsula (2018)
LikeLike
Wait, they are proposing a new “France” category? I had not heard that. Given how genetically similar everything from France to Germany is, I’m not sure if this will end up being helpful.
Thanks for the link about Spain, though. Though I must say I found it incredibly confusing as the person trying to make sense of the data couldn’t even seem to. From a macro perspective it seems that we might get some success is seperating out the Basque from everyone else with their ancient “French” profile. But beyond that, I didn’t see it really explain any difference between “Portugal” and “Spain.” Maybe I’m just tired, but there doesn’t seem to be any sharp line between “Spain” and “Portugal,” only a general cline. And then the big problem is that while we know where they took the Spanish samples from, what really throws off depicting this in a map is that they didn’t do the same for Portugal.
I’m so interested in the Iberian because it makes up a full quarter of my scaled European Ancestry despite me knowing of no Spanish roots, which is way more than what people of predominantly British ancestry get, I believe. People from the British Isles usually get some “Iberian” ancestry because of ancient migrations north the northwest of the Iberian Peninsula, but from what I’ve seen it’s usually low single-digits if they get any at all accounting for recombination and such. It’s funny, because even my ancestry profile on the different admixture tools on Gedmatch usually give me about half “Northern/Northwestern European” and half “Western Meditrannean/Atlantic/etc.”
Anyway, hoping Ancestry will find some way to better pinpoint Western European ancestry in future updates. Unless you are very heavily Irish – a country with a very distinct genetic signature, apparently – everything else seems like a crap-shoot.
LikeLiked by 1 person
Yes apparently a few French Canadians have had their results updated already and received very high “France” amounts in the 90% range even! French DNA was perhaps the most awkwardly described in the current version of AncestryDNA. This was very apparent in my survey findings for Haitians. Judging from the map below there could still be a major overlap between the England & Germanic regions and northern parts of France. However the rest of France is solidly covered by this new region. So this could be a further improvement. Although I suspect that there will also still be overlap with other Southwestern European regions.
LikeLike
Speaking of France, the one possible “French” ancestor (Therrien) you found for me for the filtering search not only turned out to be American, but his French side is actually from Quebec. On each side (one English/Welsh and the other French-Canadian), his people have been in the country since the 1500’s. He was the one match for which “Iberian” was his highest total; he says that “Portugal” is a full quarter for him just like “Iberian Peninsula” is a full quarter of my European ancestry. I don’t know if he literally meant Portgual, which would mean he got some kind of update, or if he’s just using that for Iberian Peninsula.
But, the twist is that he found some Portuguese matches. I didn’t ask them how close they were but the surname was “Daponte,” and they are apparently from the Azores. So he’s not really sure, now. lol I still imagine it’s distant enough where he shouldn’t be getting “Iberian” as his biggest region, and his French ancestry is not from the part that would most likely attract “Iberian” as a significant region; his French ancestros are from northwest France. So I’m actually thinking that if we’re connected, it may even be through his significant British half.
Anyway, the update should help clear things up a bit in regards to Western Europe.
LikeLiked by 1 person
Finding a common ancestor for DNA matches who are of mixed background can be tricky indeed! It’s really too bad that Ancestry doesn’t specify the ethnicity or admixture of the shared DNA segments with your matches.
LikeLike
A bit further off topic, but a random African match popped into my Ancestry matches last night. He only had two regions: Cameroon/Congo and African Southeast Bantu. I haven’t gotten any answer back from him, but from the surname (Masendu) is from the Kalanga people, and that this is a group centered on western Zimbabwe and and eastern Botswana. In western Zimbabwe this region is known as Matabeleland, in which they are a minority group. In Botswana, I believe they are a majority in the area in which they live having migrated there by 600 AD, so they’ve been there quite awhile. The Kalanga seem to be associated with the famous settlement of Great Zimbabwe.
Bantu groups this far southeast tend to get the two regions the other way around, though I have no idea how much a percentage of each he is. It’s interesting for me to start to find more Bantu matches given that 14% of my ancestry is given over to “Cameroon/Congo” and another 2% over to African Southeast Bantu. I’m actually rather surprised I’ve been finding so many matches to the southeastern end of this mega-region since only 2% is African Southeast Bantu.
LikeLiked by 1 person
Same here. Ancestry gave me 14% Cameroon/Congo as well as 2% Southeastern Bantu. Did you get Nigeria? Also is your genetic migration Virginia or South Carolina?
LikeLike
Very, very minimal “Nigeria” even though many of my African matches are from there; in fact, it’s my second-to-last region given to me at only 1%. Most of my “Nigeria” seems to get classed as “Cameroon/Congo” or “Benin/Togo,” as most of my matches from Nigeria are from ethnic groups along the edges of the country. I also get both of those genetic migrations, but I knew that from family history; just about every African American is going to get one or the other and many will get both.
LikeLike
Interesting indeed! I’m right now preparing a blog post in which I will attempt to correlate regional admixture with DNA matches as reported by AncestryDNA for 50 Cape Verdeans. Looking into their African DNA matches, they are overwhelmingly from Upper Guinea, as expected. However i did find some more surprising matches from other places as well, incl. Ghana, Nigeria, Cameroon, Angola and even Malawi and Ethiopia! Not sure yet how to account for such matches in a general way. I suppose first of all the shared segment size does need to be taken into consideration to rule out any false positives or IBS matches. Socalled population matches also to be kept in mind . These matches being the result of widely dispersed shared DNA from ancient times in adjacent and overlapping genepools rather than any relatively recent (~500 years) genealogical connection with a distinctive place or ethnic group.
LikeLike
Hello Fonte, Your updated blog on Cape Verdean dna results from Ancestry.com was very thorough and a great read. My results has been updated and you are still able to view my results. My new estimates are
Portugal 41%
Mali 26%
Senegal 25%
Spain 3%
European Jewish 1%
Northern Africa 1%
Middle East 1%
Norway 1%
Benin/Togo 1%
Ivory Coast/Ghana <1%
The low confidence regions have been eliminated. My previous estimates were
Senegal 33%
Iberian Peninsula 26%
Mali 13%
Europe South 7%
Low confidence regions
Great Britain 6%
Africa North 4%
Middle East 4%
Asia Central 2%
Africa South-Central Hunter-Gatherers 1%
European Jewish <1%
Benin/Togo <1%
Melanesia <1%
Cameroon/Congo <1%
As you can see my Senegal estimate dropped while my Mali estimate increased. The Europe South estimate along with the Great Britain estimate are now gone. Based on your analysis of Portuguese dna estimates I thought this would be the case. Also based on your analysis, the Middle East and Africa North estimates dropped. The only surprise to me was the Norway score. Thank you again for your illuminating analysis.
LikeLiked by 1 person
Thanks a lot for the appreciation! I am glad that this blog post has been useful to you! I am actually preparing a follow-up post in which I will analyze the DNA matches being reported for 50 of my Cape Verdean survey participants. However I will also include the newly updated ethnicity estimates in my analysis and how they might correlate with the DNA matching patterns I will be describing.
LikeLike
This is article is truly fantastic. I am so grateful for your research. I am descended from a Cabo Verdean (Fogo) and, as he died more than half a century before I was born, this information is able to give me a real sense of who he was. Thank you.
LikeLiked by 1 person
You’re very welcome, thanks a lot for the appreciation! I’m really glad this blog post has been useful to you!
LikeLike
To the best of my knowledge my grandmother has some Cape Verdean roots from Brava (1/4 or even possibly 1/8 depending on who you ask), the rest being Portuguese from Madeira… her SSA is on the lower side as one might expect anywhere between 1-6% depending on the test so it may be difficult to draw conclusions from it.
HOWEVER on AncestryDNA, MyHeritage, and even DNA.Land she always scores Lower Guinean. AncestryDNA gives “Benin/Togo”, MyHeritage gives “Nigerian” (as opposed to “Sierra Leone” or “Western African”) and Dna.Land says “Lower Niger Valley” (rather than “Senegal”). The only site to give an African region consistent with what we would expect for Cape Verde is 23andme, which puts about half of her African into Senegambia/Guinea and the rest broken between Nigerian, Southern East African, and Broadly West African. 23andme dates each of these African components (when the “fully” African ancestor lived) to 1750-1800.
It would look to me that she has Nigerian or Beninese, rather than Senegambian ancestry.
Is Brava different in terms of African ancestry compared to the rest of CV? Should I look to other explanations for the African ancestry? Her Portuguese ancestry is Madeiran and historical documentation suggests the slaves in Madeira (10% of the population in colonial times) were also Senegambians, with very little Lower Guinean or Central African.
Someone suggested I should consider whether a Portuguese male ancestor could have taken African wife or slave directly from the Bight of Benin, and if my family lived in Cape Verde but did not acquire their mixture there. I think you once suggested this based on not scoring many Cape Verdean matches but I didn’t seriously consider this as a possibility until my grandmother’s African started to match Lower Guinea and not Senegambia.
LikeLiked by 1 person
Hi Michael,
Intriguing questions! I will answer them to the best of my capability. But like you said with these minimal amounts of African admixture it is very difficult to draw any conclusions from it 😉
Your grandmother’s African breakdown on 23andme reads as follows right?
Total African: 1.2%
Senegambian & Guinean: 0.6%
Nigerian: 0.2%
Southern East African: 0.1%
Broadly West African 0.2%
While on Ancestry it’s:
1% “Benin/Togo”
Let me start with saying that based on what I have seen reported for actual Africans I am pretty sure that the current version of 23andme has a much more accurate African breakdown than Ancestry (after its September 2018 update). See also these links:
https://tracingafricanroots.com/2019/02/25/23andmes-new-african-breakdown-put-to-the-test/
https://tracingafricanroots.wordpress.com/2018/09/22/did-ancestry-kill-their-african-breakdown-part-1/
In particular the socalled “Benin/Togo” region on Ancestry has become notoriously vague, potentially covering all of West Africa! (see this map) Even more so at trace level it is not indicative of Lower Guinean lineage per se. And either way I have always found 23andme’s algorithm better suited to calculate small amounts of admixture, even before Ancestry’s update.
So if you ask me what is more likely to be the principal source of African lineage for your grandmother: either the 1% “Benin/Togo” or the 0.6% “Senegambian & Guinean”, I definitely would opt for the latter.
Then again I find it interesting that 23andme does detect (albeit VERY minimal) some additional “Nigerian” DNA as well. Theoretically speaking I suppose it could be that your grandmother has not one but two sources of African lineage.
The feature on 23andme called “Ancestry Timeline” could be a very useful tool in theory. But based on what I have seen reported for many other people and also myself it often gets it (very) wrong with its predictions. Which are not to be taken as anything precise or final at all! Personally I would not go by 23andme’s statement that this part of your grandmother’s lineage is to be dated from 1750-1800. And is to be traced back to just one single person of fully African background. Given the long history of African admixture among “white” people living in both Cape Verde, Madeira and Portugal I think it is perfectly possible that she might have various African ancestors on different family lines. It might be impossible to really trace when exactly such ancestors entered her family tree, but could be going back to as far as the 1500’s, when reinforced from multiple family lines.
Then again it’s still also a possibility to take into consideration. The size and scattering of the African segments might be telling I suppose. If she indeed only has one single African anctor, to be traced back to a relatively recent timeperiod. You would expect these segments to not have been impacted by recombination that much yet. So bigger segments and perhaps also on less chromosomes. How does her chromosome painting look like on 23andme?
LikeLike
To give you an idea these are the 23andme results of a close DNA cousin of mine. He has done extensive genealogy research and so he knows for a fact that he has 1 CV great-grandparent from S.Vicente (where my mother is from also). So he is 1/8 CV which is comparable to your 1/4 or 1/8 CV grandmother. Otherwise he is fully English/Welsh. His CV ancestor actually arrived as a part of a whaling crew in Wales in the late 1800’s, similar to how CV’s ended up in the US and also the Pacific! See this article for the fascinating story of CV sailors settling in Wales.
Cape Verde to Cardiff (BBC)
As you can see his total African % at 5.6% is more pronounced than for your grandmother, possibly because people from S.Vicente tend to be around 50% African, genetically speaking. While for Brava it is more usual to also encounter people with lower amounts of African admixture of around 10-20% African, who would socially speaking often be considered “white”. If indeed your grandmother’s African admixture is hailing from Cape Verde and not from Madeira or elsewhere!
Another noticeable thing is that although “Senegambian & Guinean” is clearly predominant, it is in fact not the only African region being mentioned! The “Ghanaian, Liberian & Sierra Leonean” % is very likely to be still broadly Upper Guinean. But also “Nigerian” and even some “Congolese” is showing up, albeit very decreased. I suspect this is just an imperfection of 23andme, it is very commonly reported for other CV’s as well, but usually below 1%. When it is clearly deviating from the group averages I do suspect it could be a genuine indication though for lineage outside of Upper Guinea, but only in individual cases.
Looking at the chromosome painting it is interesting to see some rather long stretches at times of African segments.
Lastly I also included his Ancestry Time Line just to illustrate how misleading some of its predictions can be. You would have to very carefully read the white paper of this tool to make more sense of it. But it’s already clear that my DNA cousin (who again has done very extensive genealogy going as far as the 1700’s on his English/Welsh side i believe) does not have any recent French/German or Scandinavian ancestry (which is rather a misreading of English DNA). Nor is it very likely that has any full blooded Ghanaian or Nigerian ancestors from the last 200 years. And if he does happen to have one they certainly would not be more recent than any full blooded Portuguese ancestor.
LikeLike
My grandmother has a mixture of larger and smaller segments of African, with the largest ones being “Senegambian and Guinean” while the others (Nigerian, SE African and Broadly West African) are smaller. Her SSA is present across 6 different chromosomes right now but with the expected updates in July I will monitor this to see if it changes. My inclination is she might have multiple African ancestors from different regions. But if you trust 23andme’s algorithm over AncestryDNA’s then I would say her African distribution might actually make sense for Cape Verde.
The low African I would attribute to what may actually only be 1/8 CV from Brava rather than 1/4 (I have no way of knowing for sure but based on your results on your spreadsheets from Brava I find this more likely), so if we assume this ancestor to have been around 20% SSA (which makes sense since I have a photo of the ancestor from whom the CV ancestry is thought to come and you can definitely see admixture in her features but she is probably just passable as white), we would expect 2.5% or so SSA, which is within the margin of error. Mind you also, FTDNA gives her 3% SSA (2% East-Central African, 1% South-Central African) and Myheritage gives her 2.6% Nigerian. GEDMatch typically also has her anywhere from 3-6% more SSA than their Iberian calculator averages.
Knowing many CV people from Brava and Fogo I do find on a phenotypical level that many of them can just pass as white, meaning if you aren’t looking explicitly for African influence in the features you might miss it. I do not see this so much amongst people from the other islands. I know many white people in my area who identify as Portuguese Americans who have Cape Verdean ancestors (mostly from Brava) who “passed” as white and would have identified as Portuguese, and I believe this is what happened with us.
LikeLike
Yes it doesn’t seem out of line, however at the same time it could still be indicative of African admixture by way of Madeira/Portugal as well.
I see, do keep in mind that my survey on DNA results from Brava is still rather limited in sample size (n=14). I would consider n=30 to be pretty robust already though. And I do not see any particular reason to assume that the results I have collected sofar would not be representative or atypical.
I have started a new survey based on 23andme results for CV’s and I will be aiming to collect atleast 100 CV results again, when possible even more. So keep your eye out on that!
I have heard about similar stories from multi-generational CV-Americans. The way I was made to understand it this “Portuguese” identification was however not solely based on appearance. But also simply based on former Portuguese nationality or even strong feelings of adherence to Portugal. Many CV migrants to the US arrived when CV was still formally part of Portugal. Which it had been for all of its existence during many centuries since “discovery” in 1460. You have to keep in mind that independence was only in 1975 and despite strong localized identities an additional attachment to Portuguese culture/language etc. as well would not be contradictory to them. But just part of their multi-layered sense of being.
LikeLike
I was very surprised she did not get any Portuguese related migrations (or any for that matter) on Ancestry. I keep checking to see what will show up! As for the SSA breakdown, I would imagine Madeira and CV, at least early on, received a similar set of African ethnicities so really at this point the mixture could be from either source for us.
I do also know a Madeiran girl who has traced an ancestor from St. Vincent and the Grenadines who moved back to Madeira in the 1800s.. this person was a mixture of Portuguese and Vincentian (Afro-Caribbean descent). So I don’t discount similar explanations for us either.
I would not be surprised if the SSA average for Brava is in the 20%s because of most of the results I have seen from there personally, also on GEDmatch, the average person is somewhere between 25-35% SSA, with some that are higher and some that are even lower (it is these people who might be those I see who can “pass” as white). But I do know Brava and Fogo are said to be the most European of the islands and based on the people I see from there in person, I’ve yet to meet one who I believe to be more than 50% SSA. I don’t deny they exist though. A lot of the people from those islands here get mistaken in person for Puerto Rican.
Recently we have seen an influx of Cape Verdeans from Santiago into my area who look much more phenotypically African than the other Cape Verdeans here. I am often shocked when I see them because I would just assume them to be African American.
LikeLike
Not that I know of. In fact in this blog post i came to the conclusion that based on the “Senegal” and “Mali” scores on Ancestry there is hardly any variation between the various CV islands. Although subtle differentiation might be indicative at times. I am currently conducting a new 23andme survey and pretty much the same outcome will be forthcoming.
I cannot tell you with full certainty whether her African lineage is indeed CV related or derived from Madeira or elsewhere (Brazil for example or Portugal where also African admixture has been taking place since the 1500’s). It is always good to keep an open mind, but often the most plausible scenario will eventually end up to be true after all.
About the composition of Africans being brought to Madeira (as well as to Portugal), they were indeed often Upper Guinean, but certainly not exclusively so! Because of the prevailing sailing routes Madeira was often also used as a transit between Brazil and Portugal as well as between Sao Tome & Principe and Portugal. In fact there is plentiful documentation which testifies to the diverse backgrounds of enslaved AFricans living in Portugal (and by extension also Madeira). See this chart for example which lists the Ethnic Origins of slaves in Lisbon: 1680-1755.
LikeLike
I responded to your first comment above also, this is my second comment:
My great aunt used to claim that we had an African ancestor directly from Africa. She used to say it was an Angolan brought to CV. But I find this unlikely. Either way, our family does have stories and tales indicating memory of there being a fairly recent African ancestor, but I don’t know if this means we should assume them to be continental African… I think it’s just awareness that some of their ancestry had been black African.
Based on possible sources of African ancestry, this is what I believe is most to least likely based on evidence and I would be curious for your input:
Cape Verdean ancestor from Brava with low-level African (20% or so) who moved to Madeira, “passed” as white, and mixed into our family. This is consistent with our knowledge of family who lived in Brava, the balance of Senegambian ancestry to other West African if you trust 23andme, and the overall level of SSA scored (which is higher on other tests).
A fairly late stage African ancestor from Madeira. Slavery ended in Madeira in 1775, which means there would have still been people who looked black and/or mixed into the 1800s, which could leave room for some family testimony of black ancestors.
African ancestor directly from West Africa, who was brought to Madeira or CV along trade routes but not due to slavery.
I do not think our African ancestors had touched the mainland of Portugal because we have no record of any ancestors from mainland Portugal in the last 200 years, we are strictly Madeiran and Cape Verdean.
LikeLike
That’s very interesting, it might be a valuable clue for further research! Especially when combined with traditional genealogy. You’d be surprised how much info you can get from church records etc! Of course there are some complicating factors, such as non-parental events, family tales being based on misunderstandings, incomplete knowledge etc.
For many CV’s there actually often is family lore about relatively recent Portuguese ancestry dating from the early 1900’s or 1800’s. At times backed up by documentation but not always. However DNA testing now seems to offer extra corroboration. Especially being assigned to one of the “Portuguese” migrations on Ancestry or receiving Portugal as a Recent Ancestral Location on 23andme. See also discussion on this page under “Admixture mostly occurring in the 1500’s/1600’s or rather in the 1700’s/1800’s?”
In fact I was surprised that your grandmother did not receive any Portuguese related migration on Ancestry. They have 6 of them , incl also Madeira! But this might just be a fluke, as I have seen it at times also with other people (but not often).
Portuguese
Azores
Azores & San Francisco Bay Area
Azores, Madeira & Hawaii
Central California Portuguese
Madeira & Hawaii
Portugal & Brazil
Either way I would strongly advise you to take up traditional genealogy as well as a additional means to solve the questions you have about your CV family line as well as hopefully clarify your minor African admixture.
For helpful resources on Cape Verdean genealogy & history go to this page (directly under the banner for the Creola Genealogist)
https://tracingafricanroots.com/2018/12/17/dna-matches-reported-for-50-cape-verdeans-on-ancestrydna-part-1/
LikeLike
That is very helpful, I will look into it. Thank you.
Based on all the evidence you see what is your personal opinion/best guess as to the source of our African? What I think is also worth mentioning is that compared to the other Madeiran matches she has on various sites, her African does come out higher than average for Madeirans (usually I see 0-1% SSA) but she is always 1%+, but I am aware that Cape Verdean and Madeiran migration happened both ways, meaning that some Madeirans with higher than usual SSA may actually have Cape Verdean ancestry similarly to how many Cape Verdeans descend from Madeira.
Or certain parts of Madeira could have had a higher concentration of Africans. I really would love to see a study quantifying African admixture across the island and figuring out if it’s from slaves brought right to Madeira, vs Cape Verdean ancestry or something else altogether.
We also score 0.1% Native American. I always wondered how that got in there or if it’s just noise.
So really it is a wide network of trade routes, shipping lanes, and migrations to untangle here. In the end we would be well off just to recognize if you’re from any of these islands, your ancestral history is anywhere from slightly to significantly different than people in the Portuguese mainland and that as “islanders” we have a different history.
Regardless of the source of the African I am still interested in learning about it and embracing it as part of our story. 🙂
LikeLiked by 1 person
Great attitude! With DNA testing being so popular nowadays I see this more and more that people with minor African admixture are starting to investigate this part of their (often forgotten) ancestral heritage as well.
Unless you have corroborating evidence i would assume it is noise. There seems to have been a quite drastic increase in such trace levels of unexpected continental admixture (~0.1%) for all people who test with 23andme when compared with the former results on Ancestry. I came across this during my survey of native Africans as well as among Cape Verdeans.
In fact as you mention because of Madeira & Cape Verde being in the midst of a network of trade routes, shipping lanes, and migrations there is always a possibility of such admixture being genuine. A distant single mixed-race Brazilian ancestor from perhaps the early 1800’s or 1700’s comes to mind. See also section 6 of this blog post where I found that 95 of my CV survey participants did not show any Native American admixture at all. However 5 individuals did! And going by their DNA matches this might be inherited by way of a Brazilian ancestor. For more discussion see section 4 of this blog post:
https://tracingafricanroots.com/2018/12/17/dna-matches-reported-for-50-cape-verdeans-on-ancestrydna-part-1/
But frankly the odds of discovering exactly how such admixture came to be will be very small, unless the admixture is going beyond absolutely minimal tracelevel of 0.1% into levels >0.5%. Above 1% i tend to think most unexpected continental scores will be quite robust already, even if not always in the assumed time frame.
LikeLike
The Amerindian is probably either not real, or so far distant that it only sometimes shows, as it does not show up consistently for my mother and grandmother across all DNA testing services we have participated in and certainly it never shows up on every test for all 3 of us… this is what I have seen:
Professor Doug McDonald found a tiny bit of “real” Amerindian ancestry for my mother and myself, a very small shared segment. He has not analyzed my grandmother.
Both my mother and I used to score less than 0.1% Amerindian on 23andme, but ours has been taken away: my grandmother still scores hers.
FTDNA finds less than 1% Amerindian for both me and my mother, which it calls South American… my grandmother does not score this.
Based on this I am inclined to believe that it is either artificial or very distant. The African is clearly real because it shows up on every test and is consistent with what we knew about our family, but I don’t plan to “claim” the Amerindian unless I can prove without doubt that it existed. Would be interesting if it did!
The interesting part is that my mother used to think some of our relatives looked part Asian or Amerindian. She was surprised it didn’t show up consistently and with a more significant amount. I wondered if some of the pseudo-Amerindian appearances could have been due to the type of African — don’t some West African/European mixed people sometimes look almost triracial? I’ve definitely seen Cape Verdeans who do.
LikeLike
Yes me too, although obviously judging appearances will be subjective and superficial 😉 I suppose for most people such an association is triggered by a pseudo-Asian/Amerindian eye shape and perhaps also a certain type of hair texture. This picture below is from a woman from Santiago.
Her slanted eyeshape with (near) epicanthic fold may strike some people as exotic for Africans. But that may be simply due to a lack of exposure to the phenotypical diversity existing among Africans.
However from what I have seen such eyeshapes are not uncommon at all among native Africans. Also they are not restricted to just one particular area or ethnic group. Although frequencies may be more noticeable among certain groups of people. First of all of course the Khoi-San from Southern Africa! However also across West Africa I have seen such eyeshapes, not only on people from Senegambia but also from Benin, Nigeria etc.
For a very intriguing paper on how genetics and phenotype may correlate for CV’s you should read this paper which I also discuss in this blog post actually:
Genetic Architecture of Skin and Eye Color in an African-European Admixed Population (Beleza et al., 2013)
LikeLike
Those scenarios all seem more or less plausible. Probably also in the ranking you suggested. I would still also take into consideration that your grandmother’s minor African admixture is not due to one single African ancestor from a relatively recent time period (1750-1850). But possibly you could also be looking at multiple African ancestors whose bloodlines got diluted into the Madeiran genepool, starting from the 1500’s.
DNA matches provide a valuable way of corroborating admixture. As you know I have scanned and filtered your grandmother’s DNA matches on Ancestry according to this method. Out of her 17.433 matches I managed to single out 6 confirmed (by family tree or because I happen to know them) CV matches. About 55 matches might be either fully CV or mixed CV.
Also I found about 20 most likely North African matches. Which also could be an interesting avenue of research btw, although difficult to entangle as different scenarios might be possible. Incl. Moorish ancestry by way of Portugal, but also enslaved captives from the Moroccan/Mauritanian coastline and even Canarian Guanches. See also section 3 on how to interpret North African matches in this article:
https://tracingafricanroots.com/2018/12/17/dna-matches-reported-for-50-cape-verdeans-on-ancestrydna-part-1/
Unfortunately no fully SSA matches sofar, but the odds for that happening are of course quite slim given the minimal African admix for your grandmother. Although I suppose this finding does make a relatively recent fully African ancestor less likely. Especially if this ancestor had indeed been Nigerian the odds of getting matched would be quite good as many Nigerians have tested with Ancestry.
The number of CV related CV matches for your grandmother might be higher than just 50-60. But even if we assume it’s rather 100 or even 200 it would still be rather subdued. Given that perhaps around 10.000 CV Americans might already have taken an Ancestry test! Many of them also from Brava. Who all tend to be very closely related due to relative endogamy.
I myself have literally thousands of CV related matches! Despite being only half CV. This also goes for many other partially CV descended persons I have seen on Ancestry. The “Portuguese Islander” migration makes it very easy to verify. I will have to check also with my DNA cousin I mentioned earlier who is 1/8 CV. But I believe he also has atleast hundreds of CV related matches.
In this way the number of CV related matches for your grandmother does seem rather low. And of course there is also the very likely possibility that your grandmother is related with her CV matches through mutual Madeiran/Portuguese ancestors and not mutual CV ancestors (as also seems to be the case for us). You can check this by the Shared Matches tool on Ancestry which will show you the matches who match both your grandmother and the CV match.
What I’ve been thinking of, just as a speculation, is that possibly your distant CV ancestor (either a grandparent or great-grandparent of your grandma) was himself of Madeiran descent. This ancestor may have been born in Brava but coming from a family which was not deeply rooted in local society but perhaps only residing there for 1 or 2 generations. This happened quite frequently from what I can tell, especially during the 1800’s and early 1900’s when Portuguese and other European migration to Brava seems to have been on the increase. The family tree of CV’s well known poet Eugénio de Paula Tavares might be ilustrative. He was born himself in Brava 1867 but his father was from Portugal (Santarem) while his mother was CV born but in turn herself had a Spanish father, possibly a Portuguese grandmother and Italian and Canarian great grandparents who all migrated to Brava. See this link (in Portuguese)
http://www.eugeniotavares.org/docs/pt/biografia/nascimento.html
So again I think doing thorough family tree research might bring you greater insight!
LikeLike
I appreciate all of your feedback and this has all been very helpful. I knew if there was anyone to ask to help me figure it out it would be you since you have a lot of knowledge on the African diaspora 🙂
Not sure if this helps with figuring it out (though I think I am considering now that any of these explanations might make sense — either CV mediated SSA admixture, people “passing” over the color line in Madeira itself, or returning Portuguese/African mixed people from Brazil or the Caribbean as we do have many Caribbean matches on 23andme from Trinidad, St. Vincent, and even Barbados), but if you go back through our family photos starting with my great grandmother and going back, the people in the photos do get noticeably more SSA-influenced as you go back. This would suggest to me that in the early 1800s, we have ancestors who had not yet “passed” as white or had the African ancestry fully assimilated into the white population.
Either way I guess it doesn’t make a HUGE difference how the admixture came to be, but it’s interesting to speculate. What I find most interesting, and perhaps the most consistent finding, is that it is West African ancestry rather than Angolan/Congolese/Mozambican that we are looking at, even though many in my own family anticipated it would be Angolan (and our family rumor is of an Angolan ancestor, as I mentioned).
LikeLiked by 1 person
The challenge is because Madeirans themselves have African ancestry at low levels (10% of the population was enslaved as of 1775). People from mainland Portugal for instance, with exceptions, typically do not score SSA at all.
I wonder if the Cape Verdean relative from Brava could have been a mixture of local descent and recent Portuguese. This might make the most sense. Because I’ve seen photos of these ancestors (I can send them in an email if you would like to see) and they do look mixed.
LikeLike
MJ, concerning your statement ” But I do know Brava and Fogo are said to be the most European of the islands and based on the people I see from there in person, I’ve yet to meet one who I believe to be more than 50% SSA. I don’t deny they exist though.” I would caution you from making generalize statements on the amount of African ancestry based on physical features without knowing that person or their family history.
My family is from Fogo and I was born in the U.S. The physical appearance of the members of my family including grandparents, great aunts
and uncles, and cousins range from what you described as “phenotypically African” to family members that are light complexioned individuals. My admixture results from Ancestry. com was 54% SSA yet one of my sisters has a light complexion.
LikeLiked by 1 person
I’m mostly basing it off the genetic results from those two islands (which tend toward being more European than African, especially for Brava, in contrast to some of the other islands like Santiago where the people are mostly predominantly African) but yes, there will obviously be exceptions and phenotype is not the most reliable indicator. From what I have seen though, from many of the Cape Verdeans I have seen, I would have overestimated their African ancestry, not underestimated it, i.e. many people for whom I’ve seen both their result and their phenotype, I think look more SSA than the result. But I understand what you are saying at the same time.
LikeLike
Hello Fonte,
My name is James. I am from Memphis, TN originally. I recently discovered I have Cape Verdean ancestry. It wasn’t known by my family, however, I’m certain I have a Cape Verdean ancestor because after reviewing my cousin matches (Ancestry.com and MyHeritage), I literally have hundreds of cousins of Cape Verdean decent in New Bedford, MA and on the islands of Brava and Fogo currently. In addition, I know that all of my mother’s family members share the same cousin matches and have the Portuguese / Iberian DNA. Lastly, we are all share large DNA segments from only 2 chromosomes. I know our shared ancestor isn’t relatively recent, however, I am certain that the Cape Verdean ancestor is there. I was hoping if you knew of any significant settlements of Cape Verdean in the Southeastern U.S.? As stated, I am from the South and most of my mom’s ancestors were from Virginia and the Carolinas before finally settling in Tennessee and northern Mississippi (around Memphis). Most of my cousins have the surnames Gonsalves, Monteiro, and Lopes. By the way, I love your posts. I made a comment on one of your previous posts dealing with African-Americans. They were always informative and laid out in great way. Thanks for all the hard work you have been doing. Thanks again.
LikeLiked by 1 person
Hi James, thanks a lot for your comment! Very intriguing!
I am not aware of any early settlement by Cape Verdeans in the South. Except for Florida but that was rather recent I believe (post WWII) and by way of Cape Verdean Americans who had previously settled in Northeast America. Not too sure about this though!
Are you part of the socalled “Portuguese Islander” migration on Ancestry? Or perhaps another one related to Portuguese lineage?
From what i’ve seen hunderds of Cape Verdean matches is exceptional indeed for an African American! And all things being the same I would assume a rather recent connection. Although I suppose your common ancestor with your Cape Verdean matches might also have been Portuguese Have you found out yet if the DNA segments are either European or African?
I discuss the various matching possibilities between African Americans and Cape Verdeans in greater detail in this blog article:
https://tracingafricanroots.com/2018/12/17/dna-matches-reported-for-50-cape-verdeans-on-ancestrydna-part-1/
See especially foot note 6:
LikeLike
Hi FonteFelipe,
Sorry for such a late reply, and thank you so much for taking time to answer my earlier post.
I am not a part of the “Portuguese Islander” migration on Ancestry or any of the other groups. Our Portuguese DNA usually ranges between 7-12%, depending on which test we are looking at (Ancestry vs MyHeritage). It may not be enough to narrow the search down to a specific group migration.
I haven’t been able to find out if our shared segments are African or European as of yet. I’m assuming they are likely European due to the fact that these cousins only appear on one side of my mom’s family members that have Portuguese or Iberian genes. I have communicated with several of my cousins and we are all pretty lost as to where the common link is. I assume that the ancestor was Cape Verdean because so many of them live in New Bedford, MA.
I agree with you that it was a relatively recent connection. More than a few of my cousin matches are in the 4th-6th cousin range and they share > 20cM DNA segments with us. By the way thank you for the link you sent me. I will definitely use it. I apologize again for the late reply. I recently graduated medical school, and started working so it has been kind of hectic. I know it’s an excuse, but I want you to know I appreciate your help. Thank you again, and Happy New Year.
LikeLiked by 1 person
Hi James,
That’s great news about your graduation! Congratz! No need to apologize at all. I’m glad you are still investigating this fascinating connection.
So you have several close Cape Verdean matches with shared DNA >20cM. And also your mother’s side of the family have “Portugal” scores of around 10% on Ancestry. I would say on both counts this certainly is atypical for African Americans without any recent Cape Verdean connection. What are their “Senegal” scores on Ancestry (after the latest update in November 2019)?
The possibility of a shared Portuguese ancestor might still be there I suppose. But also very intriguing you found evidence of a Cape Verdean American residing in Alabama! Were any dates mentioned?
Triangulation might bring you closer to solving this puzzle. Focusing on clusters of DNA matches who are all interrelated. And therefore probably share one common ancestor. This will be easiest on MyHeritage. As they have a triangulation feature integrated within the individual pages of your DNA matches. Also in case you still like to find out if the shared DNA segments are either European or African you might want to use the chromosome browser on MyHeritage and then compare on Gedmatch. Testing with 23andme might also be helpful in this regard.
You might already be aware but there’s also a great group on Facebook which is dedicated to Cape Verdean genealogy. It has many helpful and nice people over there who are all trying to find their family. Many of them are likewise only partially Cape Verdean:
https://www.facebook.com/groups/438321819686279/?ref=bookmarks
Good luck & best wishes for the New Year! Please let me know if you find out eventually. I would love to hear about it!
LikeLike
Again FonteFelipe,
Thank you so much. I really do appreciate it. In regards to the Cape Verdean in Alabama, his name was Francisco (Frank) Santiago, and he was supposedly born around 1890 in Cape Verde. The earliest record I found of Francisco in Alabama was a marriage record in the 1920s. His father was listed as an Antonio Silva according to another record. I’m not sure how the surname changed; my guess he may have changed it to the name of his home island Ilha Santiago or a middle name. I’m not sure when exactly he came over, but we do see some of his descendants ended up living in Mississippi (even closer to my home) ! Additionally, I found a recent story about the last recorded slave ship in US history, the Clotilda, had repairs done in Cape Verde before sinking near Mobille in 1860. It makes me believe that Cape Verdeans could have very well been crewman on similar ships of the past; especially given the islands’ history of seafaring.
The Senegalese scores of my immediate family members are fairly low at approx. 0-4%, but our scores from Mali are fairly high. These were about the same, even before the 2019 update. As for our Cape Verdean cousins, their Senegalese scores usually lies within the 40-50% range. Those are just a few of our highest cousin matches from Ancestry.
Thanks again for the info and link; I will put them to good use. Also, I will definitely let you know if I ever narrow the search down. Out of all of the people I have contacted, you have been the most helpful. I really can’t thank you enough for being so kind and willing to share your insight.
LikeLiked by 1 person
To add to my previous comment: I recently noticed one of my cousin matches had a documented Cape Verdean ancestor who was first recorded in Mobile, AL. Mobile is on the coast and next to Mississippi. I feel like there may have been more people who came along with him.
LikeLiked by 1 person
Hi James,
I’m not sure if this is the same guy but I happen to have come across a Cape Verdean named Antonio Silva who was in Georgia around the same time (1871)! It was a very unique find made by a Cape Verdean genealogist. I’ll just quote her here:
This find is being discussed right now in that Facebook group I referred to you earlier. There is apparently some uncertainty about his former enslaved status. As it seems that the Freedmans Bureau also worked with Black soldiers and sailors, incl. possibly Cape Verdeans? Either way this could be a very useful clue for you I suppose! I find this very intriguing so please let me know if you happen to find out any more details!
LikeLike
You will be interested to know AncestryDNA finally updated and my grandmother lost her “Benin/Togo” and now has Senegal instead! Finally this seems correct for enslaved ancestors in Madeira or Cape Verde.
With that said, 23andme now split her African (which is 1.2%) into Senegambian/Guinean and “Broadly Congolese and SE African” and 23andme has interestingly always had a tiny trace of something Bantu in her result.
LikeLiked by 1 person
Also going to add that 23andme, for whatever reason, shows my mother’s African instead as Nigerian, the last update switched it from Senegambian/Guinean to Nigerian. I wonder if for her, it is combining the Senegambian/Guinean and Congolese my grandmother scores and picking something intermediate for my mother, misreporting it as Nigerian.
For what it is worth, the only African region never showing up for any of us under any update is Ghana/Ivory Coast area. So I am confident we do not have any ancestry from there. Senegambian is the most consistent across all the DNA tests for us, and I think it is pretty conclusive we have an ancestor from there.
LikeLiked by 1 person
Great! Thanks for letting me know. This would indeed be more in the line of expectations.
I am currently shifting my attention towards DNA matches and also how these may correlate with admixture. 23andme offers some great research possibilities because it has a chromosome browser which allows you to check the ethnicity of the DNA segments you share with your DNA matches.
How many African segments does your grandmother have? And have you ever looked into which matches she has along those segments? It is probably going to be quite tricky to research. Also because you have to take into account inheritance by both parents.
I plan to blog about this topic eventually. A program called DNA Painter can be quite helpful in mapping distinctive DNA segments. See also this link below. It deals with Native American DNA however you can adopt the same strategy and apply it for any kind of distinctive admixture you want to research I imagine:
https://dna-explained.com/2019/08/29/native-american-minority-ancestors-identified-using-dnapainter-plus-ethnicity-segments/
LikeLike
I am going to take a look. I know I have several new Cape Verdean cousins on 23andme that show up for my grandmother (they are either full Cape Verdeans from Fogo and Brava or half CV, half white American, with African ranging anywhere from 1.5% at the lowest to around 40% at highest). I sent them sharing invites so I can figure out which segments the matches are on.
My grandmother has 7 African segments across 5 chromosomes. 2 of these are Senegambian/Guinean and the rest are Congolese. A very small “broadly SSA” segment shows up, and she still retains her 0.1% Native American!!
LikeLiked by 1 person
The Cape Verdean Community is known for retaining our culture, clubs, social events and keeping in touch with relatives that remained on Cape Verde Islands. If the Ancestry DNA test is improved to accurately narrow down Cape Verde Islands, I think more of our people may test. Your current results contradict CVI and some of the Islands were inhabited before the Portuguese discovered them (land taken like indians). Many of us know the actual land and house where our relatives lived the last 1rs. So a different Country showing up on our the test without CVI seems wasteful.
LikeLike
On 23andme you can already obtain a specification of your Cape Verdean Island origins. I do appreciate the effort being made to provide such detail. But currently it is not accurate in many cases. This is because their predictions are based on their client database. And CV-Americans with island origins from Brava and Fogo are therefore overrepresented. This in turn is reflected in their predictions which tend to put Brava in first place for every Cape Verdean, regardless of actual island origins.
This is the feedback I gave 23andme about this tool:
LikeLike
I thought there was going to be an update as to Portuguese and the Portuguese islands, such as Cape Verde? Yes my results show my Portuguese and African lines, and shows that I come from Poruguese Islanders. Problem is, It shows everyone coming from the Azores. My family was from Cabo Verde (Cape Verde) not the Azores. I am first generation Cape Verdean here in the United States along with many if not most of my d to h cousins.
LikeLiked by 1 person
The last update on Ancestry took place in 2019. It was mostly a missed opportunity though… There should now be 24 separate sub-communities for Portuguese lineage. However because this tool is based on Ancestry’s customer database these are still mostly from the Azores (12) and Madeira (4). As afterall most Portuguese-Americans migrated from the islands and not the mainland.
What I really hate is that Ancestry did not change the name of the “Portuguese Islander” migration into simply “Cape Verdeans”. Instead right now it is being termed ” Portuguese Islanders in the Eastern US”… Because I am sharing profiles with many Cape Verdeans I know for a fact that this genetic community is OVERWHELMINGLY consisting of people of Cape Verdean descent. Many of them actually not even residing in the USA or being first generation CV-born migrants to the USA. I really don’t understand why Ancestry finds it so difficult apparently to acknowledge that in appropriate labeling?
I have nothing against the Portuguese, as in fact I am proud of my genuine Portuguese lineage. But frankly I’m quite insulted by this continued labeling of “Portuguese” Islanders… How in earth can it have escaped Ancestry’s attention that this genetic community is principally consisting of Cape Verdeans and their descendants???
Like I said in my previous comment on 23andme Cape Verde is correctly identified as a Recent Ancestral Location (RAL) for me and other Cape Verdean descendants and also fittingly placed under “Senegambian & Guinean” right now. Plus impressively it attempts to zoom in to even island level. Not very accurate yet. But I understand it’s a work in progress and also dependent on actual customers filling in their family details
LikeLike
Even if that 28% refers to ‘black’ Cape Verdeans instead of African immigrants, it is still incorrect because the Badiu population is much higher.
Unfortunately, those DNA testing tends to be very biased. They always get a larger number of samples from Fogo & Brava, which skews the percentage.
https://journals.plos.org/plosone/article/figure/image?size=large&id=10.1371/journal.pone.0051103.g001
https://journals.plos.org/plosone/article/figure/image?size=large&id=10.1371/journal.pone.0051103.g003
So, to achieve a fairer representation based on population, the samples should always be like this:
Santiago – 56%
São Vicente – 15%
Santo Antão – 9%
Fogo – 7%
Sal – 7%
São Nicolau – 2%
Maio – 2%
Boa Vista – 1%
Brava – 1%
If the samples from every genetic testing conducted on the CV show those percentages, I’m certain we would observe a decrease in the Euro R Y-DNA and the overall Autosomal DNA. I would expect a much higher number of samples from Santiago, São Vicente, and Santo Antão, as they account for 80% of the population. However, it can be problematic that Fogo has more samples than Santiago and Barlavento.
From the second image above, you can see that the total number of samples is 431. Therefore, based on the population percentage, the samples should have been distributed equally, like this:
Santiago – 241
São Vicente – 66
Santo Antão – 39
Fogo – 31
Sal – 29
São Nicolau – 10
Maio – 6
Boa Vista – 5
Brava – 4
LikeLiked by 1 person
Thanks a lot for your detailed comment. I truly appreciate it when people offer constructive criticism! I certainly agree that Santiago unfortunately remains undersampled in DNA studies while other CV islands have been overrepresented. I think your suggestion to apply a sample distribution based on the population proportion of each island makes a lot of sense, whenever this is possible.
My own research is of course very much done on a best-effort basis. And especially in previous years (2015-2018) there were simply very few DNA testers from Santiago around. Luckily this has been changing gradually. Especially now that DNA testing is getting popular in Portugal as well there are more Santiago test results available. I have always tried to point out such sampling bias in the disclaimers of my blog posts. For example for my very first survey of CV results (n=23) in 2015:
And from my first summary of my overall Afro-Diaspora survey results in 2016:
LikeLike
According to latest census information from 2021 the share of immigrants living in Cape Verde is less than 4%. A majority of them being from mainland West Africa but also including Chinese and Europeans. So Britannica was definitely very wrong! After I contacted them in 2018 they did remove that nonsense graphic btw but they never formally replied to my remarks and they still maintain a misleading text in their entry for Cape Verdean people.
Either way, of course making a distinction between “black” and “mixed/mulatto” Cape Verdeans will be subjective and contextdependent because the differences are not always that clear-cut.
Furthermore this issue you raise also depends on how strictly or rather how loosely you would define “Badiu”. From my (limited) understanding there is this traditional notion of “Badiu di fora” referring to dark-skinned rural inhabitants of Santiago’s interior who are known to have retained their African roots to a great degree, both genetically and culturally. However nowadays it seems that Badiu is applied more casually to anyone who is born in Santiago and knows how to speak the island-specific Crioulo dialect of Badiu. Therefore also including people born in the capital Praia which has many people who are not per se (very) dark-skinned and also many people with family origins from other islands. Especially due to heavy internal migration within Cape Verde after independence.
In this old comment of mine I already mentioned that I myself have two cousins who were born in Praia and they consider themselves to be Badiu, even when both their parents are actually from S.Vicente/Santo Antão. Do you happen to be from Santiago yourself? If so, I would really like to hear your input on this issue of evolving Badiu identity.
I think generally speaking there are two main considerations when it comes to DNA samples from Santiago:
1) Even when the majority of Santiago’s population still is of clearly predominant African descent there has always been a considerable minority segment of mixed-race people in Santiago as well. This can be confirmed from plentiful historical testimony right from the start of colonization in the 1500’s. In the census of 1731 the share of mixed-race people (“mestiço”) in Santiago was said to be around 14% (see third table on this page). Intriguingly it seems that many of these people were also among the first settlers of other CV islands which were populated in a later stage than Santiago. In 1929 their share was estimated to be 25% (see this table). And according to census in 1950 mixed-race people (“misto”) were said to represent 37% of the Santiago population. The last two tables taken from this interesting thesis.
***(click to enlarge)
Naturally these are only estimates and many disclaimers might apply as again making the distinction between “black” and “mixed” is subjective! Apparently the 1950 census was the last one held during colonial administration in which also racial categories were used. So I am assuming it applies a “Portuguese gaze” and was not based on self-identification. But still greaty indicative I would say that Santiago’s population cannot be said to be exclusively “black”.
Taking things one step further: the absorption (through intermarriage etc.) of mixed-race individuals within the overall “black” population of Santiago most likely also explains how the overall African DNA profile of many people in Santiago has been diluted somewhat. In such a way that “100% African DNA” scores do not appear to be that frequent among DNA testers from Santiago. Instead the 70%-90% admixture range seems more prevailing. Atleast based on observations sofar! Of course future research might clarify this issue eventually 😉 As I said in the main text: ” I suppose such results might still be forthcoming for Cape Verdeans (with at least 4 Cape Verde-born grandparents) given wider and more targeted sampling. But the frequency of such results might be quite low.”
See also this chart taken from the Verdu et al. study (2017). Based on 44 samples drawn exclusively from Santiago. It demonstrates how Santiago also shows a wide admixture spectrum even when on average its African genetic heritage is more pronounced than on the other islands.
2) I do not have any data on the situation after 1950. However going by the previous census information it appears that the share of mixed-race people living in Santiago has gradually been on the increase. Which makes sense given ongoing mestiçagem/racial mixing. However another thing to take into account is that Praia (Santiago’s biggest city & national capital) has received a significant influx of migrants from other islands during the last few decades since independence. Most of them apparently from Fogo followed by S.Vicente and also Santo Antão. It can be assumed that most of them might be classified as “mixed-race”.
I have been trying to find a good source of how great the recent demographic impact of these migrants from other CV islands might be. According to the recent INE census it would appear that rural migrants from other parts of Santiago still contributed for most of the growth of Praia’s population. However I believe their analysis doesn’t take into account the Praia-born offspring of migrants from other CV islands. Just based on anecdotal evidence this offspring could be quite numerous as it has already been more than 60 years that Praia started to grow exponentially. From only 20,000 inhabitants in 1960 to a staggering 170,000 in 2020 (see this graph)!
This circumstance makes it all the more crucial that a “4-grandparents born on the same island” criterium is being applied, when performing DNA studies wishing to make statements about the historical population structure of each CV island. Of course nothing remains the same, populations are constantly changing and inter-island migration has been in existence for a longer time. Still the scale of modernday migration and hypermobility is clearly a new development which should be taken into account. Unfortunately this sort of dedicated sampling has not taken place so far for Cape Verde. At least from what I am aware of. For example also not that Verdu et al study from 2017 which was intended to be focused on Santiago exclusively (p.2536):
LikeLike
I just noticed your responses. Thank you for your detailed reply with studies/sources ; I really appreciate it.
“Furthermore, this issue you raise also depends on how strictly or rather how loosely you would define “Badiu”.”
Badiu are people who are descended from rural slaves or runaway enslaved Africans on the island of Santiago.
Those slaves revolted and escaped, giving rise to “maroons,” also known as “kilombo,” and their own identity, “Badiu.”
“However nowadays it seems that Badiu is applied more casually to anyone who is born in Santiago and knows how to speak the island-specific Crioulo dialect of Badiu. Therefore also including people born in the capital Praia which has many people who are not per se (very) dark-skinned and also many people with family origins from other islands. Especially due to heavy internal migration within Cape Verde after independence.”
Yes, I understand that there may be some confusion among people of other island origins who live in Santiago. However, this is not the case. Although 50% or more of the population speaks the Santiago creole, this does not imply that they are Badiu. Some Praia residents (of other islands’ origin) believe they are badiu/badia, but they are not. One is not a badiu just because were born in Praia. “Badiu” has nothing to do with one’s geographic location.
“In this old comment of mine I already mentioned that I myself have two cousins who were born in Praia and they consider themselves to be Badiu, even when both their parents are actually from S.Vicente/Santo Antão. Do you happen to be from Santiago yourself? If so, I would really like to hear your input on this issue of evolving Badiu identity.”
Yes, I am from Santiago myself. Praia-born with family from Fogo. I believe that this is typically the result of one’s ignorance and parents’ failure to educate their child on their ethnic history. There are many misconceptions about what “badiu” is. Particularly from people from other islands or even Santiago itself. I once heard people from Barlavento say that “badiu” refers to all of the Sotavento islands. which, of course, is not the case. They have no idea that people from other Sotavento islands are referred to as sampadjudu by people from Santiago. Statements like “speak the badiu creole” or “born in praia makes you a badiu” are based solely on hearsay, which confuses outsiders who have little understanding of what it means to be a badiu.
“1) Even when the majority of Santiago’s population still is of clearly predominant African descent there has always been a considerable minority segment of mixed-race people in Santiago as well.”
“Intriguingly it seems that many of these people were also among the first settlers of other CV islands which were populated in a later stage than Santiago. In 1929 their share was estimated to be 25% (see this table). And according to census in 1950 mixed-race people (“misto”) were said to represent 37% of the Santiago population. The last two tables taken from this interesting thesis.”
True, despite being predominantly African, there was always a minority of mixed-race people. If I’m not mistaken, they originated in the older city of Ribeira Grande (now known as Cidade Velha) and were granted permission to settle on other islands by the Portuguese due to the social stratification of the time. They were the first “sampadjudo” (as the field slaves aka badius referred to them) and the ancestors of all other islands. Meanwhile, many badius escaped slavery by fleeing to the far north and hiding in the mountains. Despite the fact that Cidade Velha is predominantly African today, it is possible that many mixed-race people were absorbed into the larger black population, which is one of the reasons why non-African admixture can be found in badiu people. BTW, this is consistent with what I was taught in school.
“According to the recent INE census it would appear that rural migrants from other parts of Santiago still contributed for most of the growth of Praia’s population.”
True, there has been a lot of migration from other islands because Praia is the capital, but trust me when I say that they are nowhere near the majority or more than the people descended from rural migration. Some people tend to underestimate Praia’s badiu population and overestimate the number of people from other islands, but hey it is the capital, and there will always be foreigners/migrants.
Many people from the interior settled in Praia for a variety of reasons, including a desire for a better life and employment, and they had a far greater impact on the Praia population than anything else. You can confirm this by observing that the majority of Praia’s inhabitants still have families in the countryside, that their families still have houses in the interior, and this is from generation to generation, and you can also notice that those whose families migrated from other islands do not have this experience.
Prior to the 1960s, Praia was somewhat rural, but it experienced significant migration from the countryside, resulting in the formation of new neighbourhoods, districts, and streets. For example, many areas in Praia were once desert but are now quite urbanised, particularly among rural families. Later, a wave of migration from other islands occurred as a result of opportunities. In fact, rural migration is still taking place.
“This circumstance makes it all the more crucial that a “4-grandparents born on the same island” criterium is being applied,”
That’s what I’m trying to say. I thought that was the norm? However, as you stated, nothing remains the same, and it is still important to consider things like this because historical perspective is applied to this.
LikeLiked by 1 person
Muito obrigado!
Sorry for the late reply!! As I told you before I really appreciate your well argumented remarks! I tend to have a backlog in answering the comments on my blog because of my day time job. Also I want to ensure that I give a proper response for each comment. So that’s why it sometimes takes a while before the comment gets approved/answered 😉 When making a comment on my blog you should get an option to receive an email notification when I reply.
Great! I have only visited Praia once and just for a few days. I was impressed, but I’d love to get to know Santiago much better. As well as Fogo of course! Hopefully in future trips to CV (I live in the Netherlands myself), I actually intend to visit each island eventually 😀
Again many thanks for providing your perspective on Badiu identity as well as the issue of migration into Praia! Have you done any DNA testing yourself? Feel free to send me a PM and I can include you in any of my upcoming survey’s.
LikeLike
I agree that with more evenly distributed sampling from the most populated islands, esp. Santiago, the national averages would show a considerable increase of genetic impact from Africa. That is when attempting to say something generalizing confined to the current Cape Verdean population still living on the CV islands.
However it is often said that the Cape Verdean Diaspora might be more numerous than the population living in Cape Verde itself. Or atleast about equal in size. See also these links:
Cape Verdeans (Wikipedia)
Cape Verdean Diaspora or Afro-Diapora?(Fonte Felipe, 2015)
Transnational Archipelago: Perspectives on Cape Verdean Migration and Diaspora
This claim is arguably based on imprecise estimations. But it cannot be ignored that due to historical reasons and so-called chain-migration many CV-migrant communities might have stronger links with specific islands. And therefore their average DNA profiles might also deviate somewhat from the national average in Cape Verde itself.
Especially for the USA it is known that the ancestral links with Fogo and Brava are bound to be much more significant than with Santiago. Reinforced by early founding effects from migrations which go back to the 1800’s and sometimes even earlier. Of course across the generations plenty of intermarriage took place with local Americans and also with other CV islanders (esp. S. Nicolau & Santo Antão). But from my observations the degree of endogamy among many CV-Americans is still quite impressive. Basing myself on my survey research for this post and also the ongoing contacts I have been maintaining through FB groups focused on CV genealogy and DNA testing platforms. It is not impossible at all to still find people whose family lines are all American-born for 3 or even more generations. While still ultimately all their ancestors were Cape Verdean-born. This can in fact easily be confirmed by way of DNA testing, as illustrated by this blog post.
I personally don’t think this has to be problematic per se when conducting DNA studies. As long as the relevant context is being clarified. In my experience one very useful way of dealing with this issue is to explicitly analyze inter-island substructure. Looking more closely into the relevant patterns for each island or subset of islands and also making comparisons to obtain greater understanding of local developments. While also attempting to improve the perspective on Cape Verde’s overall population structure. In spite of sample size perhaps not being perfectly “representative”.
In fact I already started doing this in 2015 (see this chart). Obviously on a best-effort basis and with a very rudimentary samplesize 😉 But still with proper interpretation I do think you can get very valuable information from such analysis. In this blogpost from 2018 I was able to expand my analysis of inter-island variation considerably. Also in my 2021 survey of Cape Verdean 23andme results I again obtained useful insights on inter-island diferentation. And therefore I intend to continue applying such analysis also in the near future. Naturally doing everything within my capacity to obtain a sample group which is reasonably representative and do justice to the full spectrum of Cape Verdean diversity. Both on the islands and in the Diaspora. I am quite confident that next time I will be able to include more Santiago samples and hopefully also a few more from other undersampled islands such as Maio and Boavista.
You might already be aware that very recently a new DNA study was published: A genetic and linguistic analysis of the admixture histories of the islands of Cabo Verde (2023). I am quite excited about this study although I do think it has several shortcomings. I intend to post a blog with my review of this study very soon. So keep an eye out on that, i’d be curious to know your opinion on the study! Regrettably it appears that the number of Santiago-born samples within this new study is again not fully representative, when going by currentday CV population. Although they do form the biggest subgroup (59/233=25%).
LikeLike
Thank you for sharing your perspective. I will look into the study.
I look forward to your review of the study.
LikeLiked by 1 person
Thanks a lot for your interest! I aim to blog about the study in either november or december. So check back soon or else subscribe to my blog! Sera um grande prazer e honra de ter mas assinantes de Cabo Verde, Ayan ! 😀
LikeLike